Biosensors Emerging Materials and Applications Part 1 doc
Bạn đang xem bản rút gọn của tài liệu. Xem và tải ngay bản đầy đủ của tài liệu tại đây (1.87 MB, 40 trang )
BIOSENSORS
–EMERGINGMATERIALS
ANDAPPLICATIONS
EditedbyPierAndreaSerra
Biosensors – Emerging Materials and Applications
Edited by Pier Andrea Serra
Published by InTech
Janeza Trdine 9, 51000 Rijeka, Croatia
Copyright © 2011 InTech
All chapters are Open Access articles distributed under the Creative Commons
Non Commercial Share Alike Attribution 3.0 license, which permits to copy,
distribute, transmit, and adapt the work in any medium, so long as the original
work is properly cited. After this work has been published by InTech, authors
have the right to republish it, in whole or part, in any publication of which they
are the author, and to make other personal use of the work. Any republication,
referencing or personal use of the work must explicitly identify the original source.
Statements and opinions expressed in the chapters are these of the individual contributors
and not necessarily those of the editors or publisher. No responsibility is accepted
for the accuracy of information contained in the published articles. The publisher
assumes no responsibility for any damage or injury to persons or property arising out
of the use of any materials, instructions, methods or ideas contained in the book.
Publishing Process Manager Mirna Cvijic
Technical Editor Teodora Smiljanic
Cover Designer Jan Hyrat
Image Copyright Goran Kuzmanovski, 2010. Used under license from Shutterstock.com
First published June, 2011
Printed in Croatia
A free online edition of this book is available at www.intechopen.com
Additional hard copies can be obtained from
Biosensors – Emerging Materials and Applications, Edited by Pier Andrea Serra
p. cm.
ISBN 978-953-307-328-6
free online editions of InTech
Books and Journals can be found at
www.intechopen.com
Contents
Preface IX
Part 1 Biosensor Technology and Materials 1
Chapter 1 Signal Analysis and Calibration of Biosensors for
Biogenic Amines in the Mixtures of Several Substrates 3
Toonika Rinken, Priit Rinken and Kairi Kivirand
Chapter 2 Molecular Design of Multivalent Glycosides
Bearing GlcNAc, (GlcNAc)
2
and LacNAc – Analysis
of Cross-linking Activities with WGA and ECA Lectins 17
Makoto Ogata, Yoshinori Misawa and Taichi Usui
Chapter 3 Determination of Binding Kinetics between
Proteins with Multiple Nonidentical Binding
Sites by SPR Flow Cell Biosensor Technology 35
Kristmundur Sigmundsson, Nicole Beauchemin,
Johan Lengqvist and Björn Öbrink
Chapter 4 Sum-frequency Generation
Spectroscopy in Biosensors Technology 59
Volcke Cédric, Caudano Yves and Peremans André
Chapter 5 How to Make FRET Biosensors
for Rab Family GTPases 81
Nanako Ishido, Hotaka Kobayashi, Yasushi Sako,
Takao Arai, Mitsunori Fukuda and Takeshi Nakamura
Chapter 6 Chiral Biosensors and Immunosensors 99
Marzena Kaniewska and Marek Trojanowicz
Chapter 7 Recent Progress in the Construction Methodology
of Fluorescent Biosensors Based on Biomolecules 123
Eiji Nakata, FongFong Liew, Shun Nakano and Takashi Morii
VI Contents
Chapter 8 “No Calibration” Type Sensor in Routine
Amperometric Bio-sensing - An Example
of a Disposable Hydrogen Peroxide Biosensor 141
C. Creanga, S. Serban, R.W. Pittson and N. El Murr
Chapter 9 QCM Technology in Biosensors 153
Yeison Montagut, José Vicente García, Yolanda Jiménez,
Carmen March, Ángel Montoya and Antonio Arnau
Chapter 10 Electrodeposition of Insulating Thin Film
Polymers from Aliphatic Monomers as
Transducers for Biosensor Applications 179
Guillaume Herlem and Tijani Gharbi
Chapter 11 Surface Modification Approaches
for Electrochemical Biosensors 209
Jin Shi and D. Marshall Porterfield
Chapter 12 Aptamer Sensors Combined with
Enzymes for Highly Sensitive Detection 227
Koichi Abe and Kazunori Ikebukuro
Chapter 13 Enhancing the Performance of Surface-based
Biosensors by AC Electrokinetic Effects - a Review 243
Protiva Rani Roy, Matthew R. Tomkins and Aristides Docoslis
Chapter 14 New Concepts of Integrated Photonic
Biosensors Based on Porous Silicon 265
Cécile Jamois, Cheng Li, Emmanuel Gerelli, Régis Orobtchouk,
Taha Benyattou,
Ali Belarouci, Yann Chevolot,
Virginie Monnier
and Eliane Souteyrand
Chapter 15 Porous Silicon Sensors
- from Single Layers to Multilayer Structures 291
J.E. Lugo, M. Ocampo, R. Doti and J. Faubert
Chapter 16 Organic-inorganic Interfaces
for a New Generation of Hybrid Biosensors 311
Luca De Stefano, Ilaria Rea, Ivo Rendina, Michele Giocondo,
Said Houmadi, Sara Longobardi and Paola Giardina
Chapter 17 Porous Silicon-based Electrochemical Biosensors 333
Andrea Salis, Susanna Setzu, Maura Monduzzi and Guido Mula
Part 2 Biosensors for Health 353
Chapter 18 Minimally Invasive Sensing 355
Patricia Connolly, David Heath and Christopher McCormick
Contents VII
Chapter 19 Biosensors for Monitoring Autophagy 383
Dalibor Mijaljica, Carlos J Rosado,
Rodney J Devenish and Mark Prescott
Chapter 20 Amperometric Biosensors for Lactate,
Alcohols and Glycerol Assays in Clinical Diagnostics 401
Oleh Smutok, Galina Gayda, Kostyantyn Dmytruk, Halyna Klepach,
Marina Nisnevitch, Andriy Sibirny, Czesław Puchalski, Daniel Broda,
Wolfgang Schuhmann, Mykhailo Gonchar and Vladimir Sibirny
Chapter 21 P450-Based Nano-Bio-Sensors
for Personalized Medicine 447
Camilla Baj-Rossi, Giovanni De Micheli and Sandro Carrara
Chapter 22 Development of Potentiometric Urea Biosensor Based on
Canavalia ensiformis Urease 483
Lívia Maria da Costa Silva, Ana Claudia Sant’Ana Pinto,
Andrea Medeiros Salgado
and Maria Alice Zarur Coelho
Chapter 23 Biosensors for Cancer Biomarkers 499
Zihni Onur Uygun and Mustafa Kemal Sezgintürk
Part 3 Biosensors for Environment and Biosecurity 545
Chapter 24 A New Biosensor to Enumerate
Bacteria in Planktonic and Biofilm Lifestyle 547
Maria De Giusti, Francesca Berlutti, Fabrizio Pantanella,
Lucia Marinelli, Alessandra Frioni, Tiziana Natalizi,
Daniela Tufi and Piera Valenti
Chapter 25 Indirect Amperometric Determination
of Selected Heavy Metals Based on
Horseradish Peroxidase Modified Electrodes 569
Philiswa N. Nomngongo, J. Catherine Ngila
and Titus A. M. Msagati
Chapter 26 Chemical Biosensors Based on Proteins
Involved in Biomineralization Processes 589
Rayana R. Ruiz-Arellano, Hugo Javier Serrano-Posada,
María Liliana Marín-García, Bernardo A. Frontana-Uribe
and Abel Moreno
Chapter 27 Applicability of GFP Microbial Whole Cell
Biosensors to Bioreactor Operations - Mathematical
Modeling and Related Experimental Tools 601
Delvigne Frank, Brognaux Alison, Gorret Nathalie,
Sørensen J. Søren, Crine Michel and Thonart Philippe
Preface
Abiosensorisdefinedasadetectingdevicethatcombinesatransducerwithabiologi‐
callysensitiveandselectivecomponent.Whenaspecifictargetmoleculeinteractswith
thebiologicalcomponent,asignalisproduced,attransducerlevel,proportionaltothe
concentrationofthesubstance.Thereforebiosensorscanmeasurecompoundspresent
intheenvironment,chem
icalprocesses,foodandhumanbodyatlowcostifcompared
withtraditionalanalyticaltechniques.
This book covers a wide range of aspects and issues related to biosensor technology,
bringing together researchers from 19 different countries. The book consists of 27
chapters written by 106 authors and divided in three sections. The first section, enti‐
tled Biosensors Technology and Materials, is composed by 17 chapters and describes
emergingaspectsoftechnologyappliedtobiosensors.Thesubsequentsection,entitled
BiosensorsforHealthandincludingsixchapters,isdevotedtobiosensorapplications
in the medical field. The last section, composed by fo
ur chapters, treats of the envi‐
ronmentalandbiosecurityapplicationsofbiosensors.
Iwanttoexpressmyappreciationandgratitudetoallauthorswhocontributedtothis
book with their research results and to InTech team, in particular to the Publishing
ProcessManagerMs.MirnaCvijicthataccomplisheditsmissionwithprofessionalism
anddedication.
PierAndreaSerra
UniversityofSassari
Italy
Part 1
Biosensor Technology and Materials
1
Signal Analysis and Calibration of Biosensors
for Biogenic Amines in the Mixtures
of Several Substrates
Toonika Rinken, Priit Rinken and Kairi Kivirand
University of Tartu, Institute of Chemistry
Estonia
1. Introduction
In real life we should often conduct analyses, where several compounds with similar
properties are simultaneously present in solutions. In traditional analytical chemistry, this
problem is usually solved by the pre-treatment of probes, enabling to eliminate the
interference effect of different compounds. This process requires skilled labour, resources
and time and eliminates the possibility to carry out on-line analyses.
A promising option for the conduction of on-line analyses is the application of biosensors,
which are considered to provide reliable results, at least concerning the issues of selectivity.
As biosensors are based on a selective bio-recognition of assessable compounds, there are
typically only a restricted number of molecules (besides the ones of the analyte) present in a
probe, which can induce measurable signals. However, in cases we have several competing
compounds which can generate identical measurable effects, the selectivity of a biosensor
can be quite poor and the results illusory. This phenomenon occurs clearly in the studies
with enzyme inhibition-based biosensors (Luque de Castro & Herrera, 2003), but can be also
well observed with biosensors, based on enzymes having activity towards several
substrates, e.g. biosensors measuring biogenic amines (Kivirand & Rinken, 2009), different
sugars etc.
Biogenic amines (BAs) are natural nitrogenous compounds formed mainly in the process of
decarboxylation and aging of free amino acids. The detection of these compounds is a
valuable tool for assessing the freshness and quality of a wide variety of protein-containing
products like fish, meat, cheese, wine etc. (Yano et al, 1996;Vinci & Antonelli, 2002;Önal,
2007). The most common biogenic amines, used for the indication of food quality are
histamine, putrescine and cadaverine (Kivirand & Rinken, 2011). Other BAs, commonly
determined in foodstuff are trimethylamine (Mitsubayashi et al, 2004), spermidine, spermine
and tyramine (Alonso-Lomillo et al, 2010). At present, regulations have been established
only for the intake of histamine, but no accordant limits are set for other BA-s, including
putrescine and cadaverine, although several studies have indicated that putrescine and
cadaverine could increase the toxicity of histamine by inhibiting the enzymes involved in
histamine biodegradation (Niculescu et al, 2000). The allowed maximum residue level of
histamine in food according to EEC regulations is 100 mg/kg (EEC, 2001); the international
food safety organization FDA has established the histamine level to 50 mg/kg (FDA, 2001).
Biosensors – Emerging Materials and Applications
4
Biosensors for BAs comprise different amine - selective enzymes, like amine oxidase
(previously copper-containing amine oxidase EC 1.4.3.6, in 2008 EC entry deleted and
replaced by monoamine oxidase EC 1.4.3.21 and diamine oxidase EC 1.4.3.22), putrescine
oxidase (EC 1.4.3.10), methylamine dehydrogenase (EC 1.4.99.3) and flavin-containing
mono-oxygenase type-3 (EC 1.14.13.8) in combinations with a variety of signal transduction
systems and are based on different signal rising mechanisms. No other bio-recognition
systems beside enzymes are known to have been used in BA biosensors at present (Kivirand
& Rinken, 2011).
The selectivity of the most widely used enzyme diamine oxidase is relatively poor. The
available data about the substrate specificity of this enzyme towards different amines varies
within a wide range for enzyme preparations from different sources, and even seems to be
dependent on the applied experimental method. The best substrates for diamine oxidase
from the seedlings of different papilionaceuos (Pisum sativum, Lathyrus sativus, Lens culinaris,
Vicia faba) are cadaverine (1,5-diaminopentane) and putrescine (1,4-diaminobutane); other
BAs have much lower affinities. The relative specific activity of pea seedlings’ diamine
oxidase (PSAO) is found to be 100 % towards putrescine, 111 % towards cadaverine, 56 %
towards agmatine and spermidine, 44 % towards 1,6-diaminohexane, 30 % towards
histamine, 8 % towards spermine and no activity has been found towards 1,3-
diaminopropane (Kenten & Mann, 1952). Characterizing the relative specificity of this
enzyme with the help of a oxygen sensor, it was found to be 100 % towards cadaverine,
86.2 % towards putrescine, 42.6 % towards 1,6-diaminohexane, 37.7 % towards 1,7-
diaminoheptane, 11.6 % towards dopamine and 9.8 % towards histamine (Kivirand &
Rinken, 2007). It has also been reported that PSAO has at least 3 times higher specificity
towards histamine than other plant amine oxidases (Medda et al, 1995). According to
literature, PSAO has very low activity towards 1,3-diaminopropane (Matsuda & Suzuki,
1977) and 1,2-diaminoethane (Kivirand & Rinken, 2007).
The above - presented data concerns studies, where only one substrate has been present in
solution. In real probes, there are several BAs, produced in the process of putrefaction of
proteins, simultaneously present and the inhibition phenomenon by competing substrates
(amines) has to be considered, since the enzyme accepts different BAs as alternatives. The
competing substrates generate analogous signals, measured with a reaction signal
transduction system. In the case of oxidases, the enzyme actually requires a second substrate
(oxygen) or a substance, which can act as an electron acceptor in the oxidation reaction and
makes the reaction possible.
In BA biosensors the most commonly used signal transducers are various electrochemical
sensors. According to the electron transfer mechanism utilized (with or without an
additional mediator), electrochemical biosensors are classified into three generations
(Eggins, 1996;Freire et al, 2003). An overview of the studied to date BA biosensors, all based
on an amine-selective enzyme and some electrochemical signal transduction system, is
given in (Kivirand & Rinken, 2011). A big problem for most BA biosensors is that it is not
possible to differentiate between different BAs. As the ratio of BAs in a probe is resulting
from the amino-acidic consistence of proteins, the results of BA analyses with biosensors are
sometimes vague and reflect the combination of the levels of several BAs.
The studies with biosensors are usually based on the steady state response of the measuring
system, where the system generates the maximum response. Most authors claim that with
this method of data acquisition, the sensitivity of biosensor systems towards certain amines
is not interfered by other biogenic amines, present in the sample. For example, Carsol et al.
Signal Analysis and Calibration of Biosensors
for Biogenic Amines in the Mixtures of Several Substrates
5
studied a pool of different amines instead of a single amine substrate with amine oxidase
based biosensors and detected no interactions of different amines (Carsol & Mascini, 1999).
Albrecht-Ruiz et al. used diamine oxidase based colorimetric method for histamine
detection and found that the absorbances of putrescine, cadaverine and histamine are
additive, as the measured absorbances were less than 10 % smaller than their expected
values. According to the presented data, the absorbances were smaller in all cases, where
putrescine and/or cadaverine were present (Albrecht-Ruiz, 1999). Simultaneous analyses of
the total BA content in fish probes with diamine oxidase based biosensor and ion-
chromatography (conductivity detection) showed, that the obtained results with both
methods were similar in cases when the BA contents were low. When BA concentrations
began to rise during the storage of fish samples, differences between the results, obtained
with diamine oxidase biosensor and ion-chromatography, began to increase (Carelli et al,
2007). There exists also a report about enzyme-based BA biosensor array, using an artificial
neural network for the pattern recognition (Lange & Wittmann, 2002).
In the present study we analyze the output currents of BA biosensors, based on pea
seedlings diamine oxidase and an electrochemical oxygen sensor to find the potential impact
of different biogenic amines into the biosensor response and propose several models for the
calibration of these biosensors in case of simultaneous presence of these amines in solutions
The biosensor response has been characterized by the maximum signal change parameter of
the reaction, calculated from the transient phase data (Rinken, 2003).
2. Materials and methods
2.1 Materials and experimental procedures
Diamine oxidase was isolated from Pisum sativum seedlings (PSAO, EC 1.4.3.22), purified as
described earlier (Kivirand & Rinken, 2007) and used in soluble form (PSAO activity in the
enzyme extract was 5.43 IU/mg solid; 7.55 mg/mL). All other reagents used in the study
were of analytical grade.
PSAO catalyzes the oxidation of amines by dissolved oxygen:
R-CH
2
NH
2
+ H
2
O + O
2
PSAO
⎯
⎯⎯→ RCHO + NH
3
+ H
2
O
2
(1)
The change of dissolved oxygen concentration in reaction medium in the course of reaction
was followed with a simple Clark - type oxygen sensor. All kinetic measurements were
carried out under continuous stirring in a closed and thermostated glass cell in air-saturated
0.1 M phosphate buffer (pH 7.0) at 25° C. The reaction was started by injection of 100 μl
PSAO solution into reaction medium, which was containing amine(s) and the sensor output
signal was registered at 1 sec intervals (final PSAO concentration 0.108 IU/ml). Each
experimental curve consisted of minimum 800-1600 data points, allowing the calculation of
the biosensor response parameters according to the dynamic biosensor model (Rinken &
Tenno, 2001). For these calculations, SigmaPlot
®
9.0 (SPSS Software, USA) and GraphPad
Prism
®
5.0 (GraphPad Software, San Diego, USA) software were used.
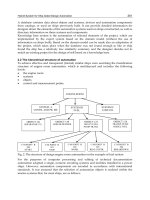
2.2 The basic principles of the applied dynamic biosensor model
The dynamic model for biosensors is designed to take into account the kinetics of enzyme
reactions with ping-pong mechanism, the diffusion of substrates and the inertia of the
Biosensors – Emerging Materials and Applications
6
diffusion – limited sensors (or the whole bio-sensing system). It enables the calculation of
steady state parameters from the biosensor transient response with errors less than 3 % and
with no need for additional determination of the system’s geometrical, diffusion or partition
parameters (Rinken & Tenno, 2001). According to this model, the normalized biosensor
output current I(t)/I
0
(corresponding to the normalized dissolved oxygen concentration
()/
(
0
)
, as I depend linearly on
) is expressed as a 3-parameter function of time t:
(
)
=
()
()
=
(
−
)
+
(
1−
)
−2
∑(
−1
)
exp
(
−
)
−−
(2)
where I(t) is the biosensor output current and
(
)
the corresponding dissolved oxygen
concentration at time moment t; I
0
is the output current and
(
0
)
the corresponding
dissolved oxygen concentration at the start of the reaction. Parameters A and B are complex
parameters characterizing the ongoing chemical reaction, both depending hyperbolically on
substrate concentration. Parameter A corresponds to the maximum possible biosensor signal
change in case time t
→
∞
(normalized signal change at steady – state) and parameter B is
the kinetic parameter (the initial maximal slope of the enzyme – catalyzed process curve); τ
s
is the time constant of the internal processes of oxygen transducer taken together and
characterizes the inertia of the transducer’s (system’s) response (Rinken & Tenno, 2001).
Parameters A, B and τ
s
are independent on each other. The most suitable parameter for the
characterization of results obtained with different biosensors and the calibration of these
biosensors, is the maximum signal change parameter A, as the kinetic parameter B includes
an intercept (diffusion constant of oxygen) resulting from its definition and is more sensitive
to experimental noise (Rinken, 2003). The application of the dynamic model enables to
calculate the biosensor response parameters quickly from the transient signal, minimizing
the influence of side processes, going on in the system (H
2
O
2
degradation, oxygen
absorption through the liquid – air surface etc.) and to avoid the uncertainty of determining
the steady state.
2.3 Correlation analysis of the biosensor data
The biosensor data (the values of maximum signal change parameters) was obtained over a
longer period from experiments, carried out with different diamine oxidase – based
biosensors in solutions, where one, two or three different biogenic amines (cadaverine,
putrescine and/or histamine), which concentrations varied from 0 to 2 mmol/L, were
present. For data analysis with different models we used the results of overall 112
measurements. The multivariate concentration – biosensor signal correlation analyses were
carried out using DataFit 9.0 software (Oakdale Engineering, USA).
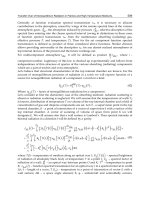
3. Discussion
3.1 Inhibition of diamine oxidase by a competing substrate
The selectivity towards different amines of diamine oxidase from pea seedlings (PSAO, EC
1.4.3.22), used in our studies, was characterized with the normalized maximum signal
change parameter A, calculated from the decrease of oxygen concentration due to the
oxidation of a particular substrate. The dependences of this parameter A on the
concentrations of 1,5-diaminopentane (cadaverine), 1,4-diaminobutane (putrescine) and
histamine in single substrate solutions are shown on Fig. 1 (a-c).
Signal Analysis and Calibration of Biosensors
for Biogenic Amines in the Mixtures of Several Substrates
7
0.0 0.4 0.8 1.2 1.6 2.0
0.0
0.2
0.4
0.6
0.8
1.0
1.2
c.
b.
a.
d.
Substrate concentration, mmol/L
Maximum signal change
parameter A
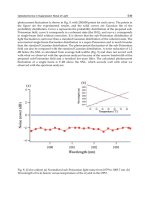
Fig. 1. The maximum signal change parameter A for (a) histamine; (b) putrescine; (c)
cadaverine and (d) cadaverine and putrescine equimolar mixtures. Measurements were
carried out in 0.1 M phosphate buffer (pH 7.00) at 25
o
C, [PSAO] = 0.108 IU/mL
As expected, all these curves were hyperbolas (Rinken, 2003). The maximum values of these
hyperbolic curves indicate the PSAO activity towards particular amines and were used for
the characterization of PSAO selectivity. Among the studied three substrates, PSAO showed
the highest specific activity towards cadaverine – the normalized maximal signal decrease
was 76% of the initial signal. Taking the PSAO specific activity towards cadaverine as 100%,
the relative activity of PSAO towards other common BAs was 86.2% for putrescine and 9.8%
for histamine. These results showed that concerning BAs, PSAO was highly selective
towards cadaverine and putrescine and its activity towards histamine was approximately 10
times smaller. Applying a different method, spectrophotometrical studies, a much higher
(27%) selectivity of PSAO towards histamine in comparison with cadaverine has been
reported (Medda et al, 1995).
The selectivity of PSAO determines the relative speed of oxidation of different amines and
has to be taken into consideration if PSAO is exploited for bio-recognition for analytical
purposes in solutions, which simultaneously contain several biogenic amines, which
oxidation is catalyzed by PSAO.
To study the inhibition of PSAO by a competing substrate, we followed the biosensor signal
in the mixtures of two different amines. In equimolar solutions of cadaverine and
putrescine, the resulting signal was considerably higher than the signals of cadaverine and
putrescine by themselves, but lower than the sum of the signals of single substrates at
similar concentrations (Fig.1 c-d). Comparing the parameter A values, obtained from
solutions, containing only cadaverine or putrescine and from their different mixtures, it
turned out that, as an average, the values of parameter A for mixtures were 1.14 ± 0.02 times
smaller than the summarized parameter A values for single substrates (Fig.2).
The analysis of the values of parameter A in mixtures at different substrates’ concentration
rates showed that neither cadaverine nor putrescine had a 100 % impact into the parameter
Biosensors – Emerging Materials and Applications
8
0.0 0.1 0.2 0.3 0.4 0.5 0.6 0.7 0.8 0.9 1.0
0.0
0.1
0.2
0.3
0.4
0.5
0.6
0.7
0.8
0.9
1.0
1.1
1.2
y = x
y = (1.14 ± 0.02)x
Parameter A
measured in the mixture
Parameter A
as a sum of parameters for single substrates
Fig. 2. The curve of the signal change parameter A as the sum of cadaverine and putrescine
signals vs. the same parameter, measured in the mixture of cadaverine and putrescine, at
similar substrate concentrations
A value. Both these substrates had an impact between 60 and 85 % of the maximum effect at
a certain concentration and the impact was smaller at concentrations below their particular
K
M
value. It is interesting to notice that the effect of one of these substrates was not
dependent on the concentration of the other, as for example the putrescine effect in the
resulting value of parameter A in the mixture was not dependent on the cadaverine
concentration.
The biosensor response was also studied in mixtures, which besides cadaverine and/or
putrescine contained histamine. In case the solution contained cadaverine and/or histamine,
even at low cadaverine concentrations it was not possible to detect any histamine effect on
the maximum signal change parameter A of the biosensor response (Fig. 3).
The calculated values of the parameter A were constant at fixed cadaverine concentrations,
even if the histamine concentrations in the mixture varied from 0.01 – 3.0 mmol/L, the latter
being over 20 times above histamine K
M
value and exceeding several times the histamine
maximum residue level in foods allowed by EEC regulations (100 mg/kg, corresponding to
0.9 mmol/L). Similar “screening” effect of histamine was also found in the mixtures of
putrescine/histamine and cadaverine/putrescine/histamine.
These studies indicate that applying a PSAO based biosensor for the detection of histamine
or the content of total amines, the concentrations of some amines are underestimated in case
there are several BAs simultaneously present in the sample. This “screening” phenomenon
and the dependence of the output signal on the rate and relative concentrations of
different biogenic amines in the sample can lead to the underestimation of the content of
biogenic amines in food, especially in cases when some particular biogenic amines
become dominant in the course of putrefaction, like putrescine and cadaverine in
decomposing of white fish.
Signal Analysis and Calibration of Biosensors
for Biogenic Amines in the Mixtures of Several Substrates
9
0.0 0.4 0.8 1.2 1.6 2.0
0.00
0.25
0.50
0.75
1.00
c.
b.
a.
Histamine concentration, mmol/l
Signal change
parameter A
Fig. 3. The calculated maximum signal change (parameter A) in the mixtures of cadaverine
and histamine at different concentration rates: histamine concentration is shown on x-axis
and cadaverine concentration is (a) 0.15 mmol/L; (b) 0.30 mmol/L; (c) 0.60 mmol/L.
Measurements were carried out in 0.1 M phosphate buffer (pH 7.00) at 25
o
C, [PSAO] = 0.108
IU/mL
The mechanism of PSAO - catalyzed oxidation of different amines follows a similar ping-
pong pattern (Yamasaki et al, 1970) and the enzyme accepts different amines as alternatives
to each other. For the characterization of the individual impact of the studied BAs into the
biosensor output signal, which is a lump sum of several parallel reactions, we applied
multivariate correlation analysis.
3.2 Multivariate correlation analysis
As different substrates generate analogous signals, a proper model should characterize the
impact of these substrates into the resulting signal, enabling the application of the signal
parameters for the calibration of a biosensor for several substrates. This task of calibration
inescapably requires signal measurements in solutions with varying concentration ratios of
BAs, which can be achieved by addition of a certain amount of definite amine to the probe
and so producing a series of BA solutions with variable concentrations. A good model in
combination with a vital number of measurements (equal to the number of coefficients in a
model) in different solutions forms a solid base for the calibration of biosensors, which
selectivity is relatively poor, e.g. PSAO-based biosensors for biogenic amines. Similar
models for biosensor calibration can be applied for other low selectivity biosensors, like in
the case of inhibition – based biosensors, where the catalytic action of an enzyme is modified
not only by the presence of given species, but also by very different compounds like metal
cations, various inorganic and organic species etc (Luque de Castro & Herrera, 2003).
3.2.1 Hyperbolic model
In single substrate solutions, the biosensor maximum signal change parameter A depends
on the substrate concentration hyperbolically (Rinken & Tenno, 2001):
Biosensors – Emerging Materials and Applications
10
[]
[]
22
22
*
*
()
bulk
cat S
total
OO
bulk
OS cat O S
diff diff
total
kE c
A
kKK k E kK c
=
++
(3)
In Eq.(3),
cat
k
∗
denotes the apparent catalytic constant of the enzyme-catalyzed reaction,
[E]
total
is the overall concentration of the enzyme in biosensor,
2
O
di
ff
k is the apparent diffusion
constant of oxygen,
2
O
K is the dissociation constant for the enzyme-oxygen complex, K
s
is
dissociation constant for the enzyme-substrate complex and
bulk
S
c
is substrate concentration
in solution.
As the reaction mechanism for competing BAs is similar, we used the sum of three
hyperbolas, each describing the impact of an individual substrate. After transformation, the
dependence of parameter
A on substrate concentration (Eq.3) can be presented as a function
with 2 coefficients (Rinken, 2003), which is the minimal number of coefficients to determine
one normalized hyperbola, which maximum value equals to 1:
=
+(+1)
(4)
In Eq. (4), the meaning of
K
s
is as defined above and the parameter m is a combination of 3
different physical constants and the total amount of enzyme
[E]
total
:
[]
2
2
*
cat
total
O
O
diff
kE
m
kK
=
(5)
The resulting biosensor signal’s maximum change parameter
A in the mixture of 3
substrates can be expressed as a function of 3 variables (the number of variables
corresponds to the number of competing substrates in solution) and 6 coefficients as
following:
=
+
(
+1
)
+
+
(
+1
)
+
+
(
+1
)
(6),
where
x, y and z are the variables denoting the concentrations of cadaverine, putrescine and
histamine accordingly;
m and K are appropriate coefficients. Applying Eq. 6 as a model for
the biosensor parameter
A, we got a good correlation with the experimental results with
standard deviation σ = 0.097 and correlation coefficient
R= 0.93. The basic problem with this
approximation was the great absolute values of coefficients
m
3
and K
3
characterizing the
effect of histamine, which were up to 10
20
times higher than the coefficients m
1
and K
1
for
cadaverine and
m
2
and K
2
for putrescine (Table 1, model 1). This may lead to the distortion
of the assumption that the reaction mechanism is similar for all substrates and amplification
of experimental noise.
To avoid this obstacle, we transformed Eq. 6 so, that the values of coefficients characterizing
the impact of different substrates were in the same order, although we had to add 3
additional coefficients:
=
+
(
+
)
+
+
(
+
)
+
+
(
+
)
(7)
In Eq. (7) coefficients
a
1
-a
3
, b
1
-b
3
and c
1
-c
3
have the following physical meanings:
Signal Analysis and Calibration of Biosensors
for Biogenic Amines in the Mixtures of Several Substrates
11
=
∗
(8)
=
(9)
=
(10)
Resulting from Eqs. 9 & 10, the quotient of coefficients b and c equals to
=
.
Applying Eq. 7 as a model for the biosensor parameter
A, we got similar fit as with Eq. 6,
but the values of the equation coefficients, characterizing different substrates were in the
same order (Table 1, model 2).
Model n
Coefficient
values
σ R
2
1.
=
+
(
+1
)
+
+
(
+1
)
+
+
(
+1
)
6 m
1
= 6.05
K
1
=1.48
m
2
=1.65
K
2
=0.48
m
3
=5.12·10
18
K
3
=6.26·10
20
2.
=
+
(
+
)
+
+
(
+
)
+
+
(
+
)
9 a
1
=1.57
b
1
=0.39
c
1
=0.26
a
2
=1.42
b
2
=0.41
c
2
=0.86
a
3
=0.26
b
3
=2.06
c
3
=10.73
0.097 0.871
Table 1. The number and values of the calculated coefficients, the value of standard
deviation
σ and square of the correlation coefficient R
2
for studied hyperbolic models of the
BA biosensor
The correlation of the calculated and experimental values of parameter
A is graphically
shown on Fig. 4, where the ideal correlation is shown with a solid line. It can be seen that
the calculated with hyperbolic model values of parameter
A correlate normally with the
experimental data and there are no systematic drifts, except in case of very low reaction
effects.
The main disadvantage of this hyperbolic model is the rather high number of coefficients,
which is 9 (6); 3 (2) coefficients for each substrate. So for the calibration of the BA biosensor
towards 3 substrates, it is necessary to carry out measurements at least 9 (6) different BA
concentration ratios: with the original sample and 8 (5) additional solutions, where a definite
amount of one or more substrates has been added. This procedure is time-consuming and
may also lead to notable experimental noise, although it enables the calibration of biosensors
in mixtures of several substrates.
Biosensors – Emerging Materials and Applications
12
0.0 0.2 0.4 0.6 0.8 1.0
0.0
0.2
0.4
0.6
0.8
1.0
A, experimental
A, calculated
Fig. 4. Correlation of the values of maximum signal change parameter
A, calculated with the
help of the hyperbolic model and from experimental data. Line x=y marks the ideal
correlation.
3.2.2 Quantitative Concentration – Signal Relationship (QCSR)
We also studied the application of some more formal models with a potentially smaller
number of variables to characterize the biosensor signal parameter
A. The QCSR model for
the characterization of the biosensor maximum signal parameter
A included different
addends as “descriptors” of reactions, going on in the biosensor and taking into account the
individual concentrations of BAs and the interference phenomena (inhibition by a
competing substrate) of these compounds. The interference was described with 3 different
types of “descriptors”, such as the products of duplicate substrate concentrations along with
the quadrates and exponents of each single BA concentration:
=++++++ℎ
+
+
+
+
+
+ (11).
In Eq. 11,
x, y and z are the variables denoting the concentrations of cadaverine, putrescine
and histamine accordingly; coefficients
a, b n denote the impact of each “descriptor” and
p is the constant term.
The correlation studies were performed with 5 models composed of different number of
”descriptors”, symmetrical towards all three studied substrates. The simplest model with 4
variables comprised the concentration terms of the three BAs and the constant term
(
=+++). As expected, this simple model showed systematic deviations from
the experimental data and the correlation was rather poor (R
2
=0.437), as it didn’t include the
interference of the substrates (Fig. 5, blue dots). The value of standard deviation was 0.198
(Table 2, model 3).
Complementing the model with the addends of the products of duplicate substrate
concentrations (
=++++++), the number of “descriptors”
increased to 7 and the correlation improved (R
2
=0.547), but not sufficiently to be applicable
for practical purposes (Fig. 5, green dots). Model
=+++ℎ
+
+
+ ,
also comprising of 7 “descriptors” resulted in a bit better correlation (R
2
=0.777) (Fig. 5, lilac
dots). Combining the 2 abovementioned models together, the number of “descriptors”
increased to 10 resulting in the square correlation coefficient R
2
=0.784 (Fig. 5, black dots). As
Signal Analysis and Calibration of Biosensors
for Biogenic Amines in the Mixtures of Several Substrates
13
Fig. 5. Correlation of the values of maximum signal change parameter A, calculated with the
help of different QCSR models and from experimental data. Line x=y marks the ideal
correlation.
the correlation was not sufficiently improved with the addition of the products of duplicate
substrate concentrations, these “descriptors” do not describe the interference of substrates in
solution satisfactorily and need not be considered in models, applied for the calibration of
BA biosensors.
Model n
Coefficient
values
σ R
2
3.
=+++
4 a=0.41
b=0.20
c=-0.13
p=0.37
0.198 0.437
4.
=++++
++
7 a=0.51
b=0.34
c=-0.35
d=-0.24
0.180 0.547
Biosensors – Emerging Materials and Applications
14
f=0.95
g=2.66
p=0.34
5.
=+++ℎ
+
+
+
7 a=1.26
b=0.86
c=-0.25
h=-0.54
j=-0.34
k=0.15
p=0.21
0.127 0.777
6.
=++++
+
+ℎ
+
+
+
10 a=1.22
b=0.84
c=-0.33
d=-0.01
f=0.41
g=2.48
h=-0.52
j=-0.33
k=0.13
p=0.21
0.126 0.784
7.
=++++
+
+ℎ
+
+
+
+
+
+
13 a=0.40
b=0.34
c=1.97
d=-0.13
f=0.27
g=-0.35
h=-2.98
j=-2.16
k=1.87
l=1.86
m=1.35
n=-2.26
p=-0.87
0.079 0.917
8.
=+++ℎ
+
+
+
+
+
+
10 a=0.49
b=0.42
c=1.24
h=-2.87
j=-1.99
k=1.28
l=1.73
m=1.18
n=-1.48
p=-1.35
0.086 0.901
Table 2. The number of “descriptors” n, the values of the calculated coefficients, the values
of standard deviations
σ and squares of the correlation coefficients R
2
for studied models of
the BA biosensor
Signal Analysis and Calibration of Biosensors
for Biogenic Amines in the Mixtures of Several Substrates
15
Addition of the exponential “descriptors” to the model improved the correlation and the fit
of the model with the experimental data was similar to that of the hyperbolic model (Eq. 6).
We used two different models, including the exponential terms, with overall 13 or 10
“descriptors” (Table 2, models 7 & 8). Similarly to the earlier results (Table 2, models 5 & 6),
the products of duplicate substrate concentrations didn’t improve considerably the
correlation and could be omitted. The QCSR model, including 10 “descriptors” (Table 2,
model 8) resulted in
R
2
=0.901, which value is similar to that obtained from hyperbolic model
(
R
2
= 0.871; Table 1 model 2).
According to data on Figs. 4 & 5 and Tables 1 & 2, the smallest divergence of the calculated
values from the experimental ones were achieved with the application of the hyperbolic
models (models 1 & 2) and the more complicated QCSR models (models 7 & 8), although
among the QCSR models one should prefer the one including smaller number of
“descriptors”. All these models could theoretically be used for the calibration and
measurements with BA biosensors in the presence of different amines simultaneously.
4. Conclusions
The application of diamine oxidase based biosensors is a good option for the rapid
determination of food quality, although in the case of simultaneous presence of several
biogenic amines, the sensor signal is influenced by the rate of concentrations of different
amines, formed during the process of protein putrefaction. In the presence of cadaverine
and putrescine, the effect of histamine on the biosensor response is totally screened and the
interaction of cadaverine and putrescine partially eliminates their own impact into the
signal, causing the decrease of the resulting signal output, which is not an additive sum of
the signals of single substrates. This screening effect can be successfully characterized with
different multivariate models of biosensor signal. These models enable the calibration of
biosensors towards several substrates in mixtures of different biogenic amines, which
generate analogous biosensor response. Similar methodology can be applied in other
systems, where the selectivity of a biosensor is low and the traditional ways of calibration
do not enable to determine the concentrations of individual compounds in mixtures.
5. Acknowledgements
This work was supported by Estonian Science Foundation (grant no. 7465).
6. References
Albrecht-Ruiz,M. (1999) Rapid method for biogenic amines evaluation in fish meal. Journal of
Aquatic Food Product Technology
, 8, 71-83.
Alonso-Lomillo,M.A.N., Dominguez-Renedo,O., Matos,P., & Arcos-Martinez,M.J. (2010)
Disposable biosensors for determination of biogenic amines.
Analytica Chimica Acta,
665, 26-31.
Brenda. The Comprehensive Enzyme Information System (www.brenda-enzymes.org, 2011).
Carelli,D., Centonze,D., Palermo,C., Quinto,M., & Rotunno,T. (2007) An interference free
amperometric biosensor for the detection of biogenic amines in food products.
Biosensors and Bioelectronics, 23, 640-647.