Biosensors Emerging Materials and Applications Part 2 docx
Bạn đang xem bản rút gọn của tài liệu. Xem và tải ngay bản đầy đủ của tài liệu tại đây (2.44 MB, 40 trang )
Molecular Design of Multivalent Glycosides Bearing GlcNAc,
(GlcNAc)
2
and LacNAc - Analysis of Cross-linking Activities with WGA and ECA Lectins
31
6. Acknowledgment
We thank professor Jun Hiratake of Kyoto University for useful suggestions.
7. References
Bhattacharyya, L.; Ceccarini, C.; Lorenzoni, P. & Brewer, C. F. (1987(a)). Concanavalin A
interactions with asparagine-linked glycopeptides. J. Biol. Chem., Vol.262, pp. 1288-
1293.
Bhattacharyya, L.; Fant, J.; Lonn, H. & Brewer, C. F. (1990). Binding and precipitating
activities of Lotus tetragonolobus isolectins with
L-fucosyl oligosaccharides.
Formation of unique homogeneous cross-linked lattices observed by electron
microscopy. Biochemistry, Vol.29, pp. 7523-7530.
Bhattacharyya, L.; Haraldsson, M. & Brewer, C. F. (1987(b)). Concanavalin A interactions
with asparagine-linked glycopeptides. J. Biol. Chem., Vol.262, pp. 1294-1299.
Bhattacharyya, L.; Haraldsson, M. & Brewer, C. F. (1988(a)). Precipitation of galactose-
specific lectins by complex-type oligosaccharides and glycopeptides: studies with
lectins from Ricinus communis (agglutinin I), Erythrina indica, Erythrina arborescens,
Abrus precatorius (agglutinin), and Glycine max (soybean). Biochemistry, Vol.27, pp.
1034-1041.
Bhattacharyya, L.; Khan, M. I. & Brewer, C. F. (1988(b)). Interactions of concanavalin A with
asparagine-linked glycopeptides: formation of homogeneous cross-linked lattices in
mixed precipitation systems. Biochemistry, Vol.27, pp. 8762-8767.
Brewer, C. F. (1997). Cross-linking activities of galectins and other multivalent lectins. Trends
Glycosci. Glycotechnol., Vol.9, pp. 155-165.
Burke, S. D.; Zhao, Q.; Schuster, M. C. & Kiessling, L. L. (2000). Synergistic formation of
soluble lectin clusters by a templated multivalent saccharide ligand. J. Am. Chem.
Soc., Vol.122, pp. 4518-4519.
Dam, T. K.; Oscarson, S.; Roy, R.; Das, S. K.; Page, D.; Macaluso, F. & Brewer, C. F. (2005).
Thermodynamic, kinetic, and electron microscopy studies of concanavalin A and
Dioclea grandiflora lectin cross-linked with synthetic divalent carbohydrates. J. Biol.
Chem., Vol.280, pp. 8640-8646.
Dessen, A.; gupta, D.; Sabesan, S.; Brewer, C. F. & Sacchettini, J. C. (1995). X-ray crystal
structure of the soybean agglutinin cross-linked with a biantennary analog of the
blood group I carbohydrate antigen. Biochemistry, Vol.34, pp. 4933-4942.
Goldstein, I. J. & Poretz, R. D. (1986). in The Lectins: Liener, I. E.; Sharon, N. & Goldstain, I. J.
Eds.: Academic Press, Orlando, FL, pp. 35-244.
Gour, N. & Verma, S. (2007). Synthesis and AFM studies of lectin-carbohydrate self-
assemblies. Tetrahedron, Vol.64, pp. 7331-7337.
Gupta, D. & Brewer, C. F. (1994). Homogeneous aggregation of the 14-kDa β-galactosidase
specific vertebrate lectin complex with asialofetuin in mixed systems. Biochemistry,
Vol.33, pp. 5526-5530.
Gupta, D.; Kaltner, H.; Dong, X.; Gabius, H J. & Brewer, C. F. (1996). Comparative cross-
linking activities of lactose-specific plant and animal lectins and a natural lactose-
Biosensors – Emerging Materials and Applications
32
binding immunoglobulin G fraction from human serum with asialofetuin.
Glycobiology, Vol.6, pp. 843-849.
Houseman, B. T. & Mrksich, M. (2002). Model systems for studying polyvalent carbohydrate
binding interactions. Top. Curr. Chem., Vol.218, pp. 1-44.
Kabat, E. A. (1976). in Structural Concepts in Immunology and Immunochemistry, 2nd ed.:
Rinehart, H. New York.
Kato, M.; Uno, T.; Hiratake, J. & Sakata, K. (2005). α-Glucopyranoimidazolines as
intermediate analogue inhibitors of family 20 β-N-acetylglucosaminidases. Bioorg.
Med. Chem., Vol.13, pp. 1563-1571.
Kiessling, L. L. & Pohl, N. L. (1996). Strength in numbers: non-natural polyvalent
carbohydrate derivatives. Chem. Biol., Vol.3, pp. 71-77.
Kitov, P. I.; Sadowska, J. M.; Mulvey, G.; Armstrong, G. D.; Ling, H.; Pannu, N. S.; Read, R. J.
& Bundle, D. R. (2000). Shiga-like toxins are neutralized by tailored multivalent
carbohydrate ligands. Nature, Vol.403, pp. 669-672.
Krishnamurthy, V. M.; Semetey, V.; Bracher, P. J.; Shen, N. & Whitesides, G. M. (2007).
Dependence of effective molarity on linker length for an intramolecular protein-
ligand system. J. Am. Chem. Soc., Vol.129, pp. 1312-1320.
Lee, R. T. & Lee, Y. C. (2000). Affinity enhancement by multivalent lectin-carbohydrate
interaction. Glycoconjugate J., Vol.17, pp. 543-551.
Lee, Y. C. & Lee, R. T. (1995). Carbohydrate-protein interactions: Basis of glycobiology. Acc.
Chem. Res., Vol.28, pp. 321-327.
Lindhorst, T. K. (2002). Artificial multivalent sugar ligands to understand and manipulate
carbohydrate-protein interactions. Top. Curr. Chem., Vol.218, pp. 201-232.
Lundquist, j. J. & Toone, E. J. (2002). The cluster glycoside effect. Chem. Rev., Vol.102, pp.
555-578.
Maierhofer, C.; Rohmer, K. & Wittmann, V. (2007). Probing multivalent carbohydrate-lectin
interactions by an enzyme-linked lectin assay employing covalently immobilized
carbohydrates. Bioorg. Med. Chem., Vol.15, pp. 7661-7676.
Mammen, M.; Choi, S K. & Whitesides, G. M. (1998). Polyvalent interactions in biological
system: Implications for design and use of multivalent ligands and inhibitors.
Angew. Chem. Int. Ed., Vol.37, pp. 2754-2794.
Mammen, M.; Dahmann, G. & Whitesides, G. M. (1995). Effective inhibitors of
hemagglutination by influenza virus synthesized from polymers having active
ester groups. Insight into mechanism of inhibition. J. Med. Chem., Vol.38, pp. 4179-
4190.
Mandal, D. K.; Kishore, N. & Brewer, C. F. (1994). Thermodynamics of lectin-carbohydrate
interactions. Titration microcalorimetry measurements of the binding of N-linked
carbohydrates and ovalbumin to concanavalin A. Biochemistry, Vol.33, pp. 1149-
1156.
Masaka, R.; Ogata, M.; Misawa, Y.; Yano, M.; Hashimoto, C.; Murata, T.; Kawagishi, H. &
Usui, T. (2010). Molecular design of N-linked tetravalent glycosides bearing N-
acetylglucosamine, N,N‘-diacetylchitobiose and N-acetyllactosamine: Analysis of
cross-linking activities with WGA and ECA lectins. Bioo
rg. Med. Chem., Vol.18, pp.
621-629.
Molecular Design of Multivalent Glycosides Bearing GlcNAc,
(GlcNAc)
2
and LacNAc - Analysis of Cross-linking Activities with WGA and ECA Lectins
33
Misawa, Y.; Akimoto, T.; Amarume, S.; Murata, T. & Usui, T. (2008(a)). Enzymatic synthesis
of spacer-linked divalent glycosides carrying N-acetylglucosamine and N-
acetyllactosamine: Analysis of cross-linking activities with WGA. J. Biochem.
(Tokyo), Vol.143, pp. 21-30.
Misawa, Y.; Masaka, R.; Maeda, K.; Yano, M.; Murata, T.; Kawagishi, H. & Usui, T. (2008(b)).
Efficient synthesis of spacer-N-linked double-headed glycosides carrying N-
acetylglucosamine and N,N’-diacetylchitobiose and their cross-linking activities
with wheat germ agglutinin. Carbohydr. Res., Vol.343, pp. 434-442.
Misawa, Y.; Masaka, R.; Yano, M.; Murata, T. & Usui, T. (2009). Synthesis of spacer-linked
divalent glycosides by chitinolytic enzyme form Amycolatopsis orientalis. J. Appl.
Glycosci., Vol.56, pp. 89-95.
Ogata, M.; Hidari, K. I P J.; Kozaki, W.; Murata, T.; Hiratake, J.; Park, E. Y.; Suzuki, T. &
Usui, T. (2009). Molecular design of spacer-N-linked sialoglycopolypeptide as
polymeric inhibitors against influenza virus infection. Biomacromolecules, Vol.10, pp.
1894-1903.
Ogata, M.; Murata, T.; Murakami, K.; Suzuki, T.; Hidari, K. I P J.; Suzuki, Y. & Usui, T.
(2007). Chemoenzymatic synthesis of artificial glycopolypeptides containing
multivalent sialyloligosaccharides with a γ-polyglutamic acid backbone and their
effect on inhibition of infection by influenza viruses. Bioorg. Med. Chem., Vol.15, pp.
1383-1393.
Pieters, R. J. (2004). Interference with lectin binding and bacterial adhesion by multivalent
carbohydrates and peptidic carbohydrate mimics. Trends Glycosci. Glycotechnol.,
Vol.16, pp. 243-254.
Rao, J.; Lahiri, J.; Lsaacs, L.; Weis, R. M. & Whitesides, G. M. (1998). A trivalent system from
vancomycin-
D-Ala-D-Ala with higher affinity than avidin-biotin. Science, Vol.280,
pp. 708-711.
Roy, R. (2003). A decade of glycodendrimer chemistry. Trends Glycosci. Glycotechnol., Vol.15,
pp. 291-310.
Roy, R. (1996). Syntheses and some applications of chemically defined multivalent
glycoconjugates. Curr. Opin. Struct. Biol., Vol.6, pp. 692-702.
Sacchettini, J. C.; Baum, L. G. & Brewer, C. F. (2001). Multivalent protein-carbohydrate
interactions. A new paradigm for supermolecular assembly and signal
transduction. Biochemistry, Vol.40, pp. 3009-3015.
Toone, E. J. (1994). Structure and energetics of protein-carbohydrate complexes. Curr. Opin.
Struct. Biol., Vol.4, pp. 719-728.
Usui, T.; Iwasaki, Y. & Mizuno, T. (1981). Isolation and characterization of two kind of
heterogalactan from the fruit bodies of ganodernra applannatum by employing a
column of concan. Carbohydr. Res., Vol.92, pp. 103-114.
Usui, T.; Hayashi, Y.; Nanjo, F.; Sakai, K. & Ishido, Y. (1987). Transglycosylation reaction of a
chitinase purified from Nocardia orientalis. Biochim. Biophys. Acta, Vol.923, pp. 302-
309.
Zeng, X.; Murata, T.; Kawagishi, H.; Usui, T. & Kobayashi, K. (1998). Analysis of specific
interactions of stnthetic glycopolypeptides carrying N-acetyllactosamine and
related compounds with lectins. Carbohydr. Res., Vol.312, pp. 209-217.
Biosensors – Emerging Materials and Applications
34
Zeng, X.; Nakaaki, Y.; Murata, T. & Usui, T. (2000). Chemoenzymatic synthesis of
glycopolypeptides carrying α-Neu5Ac-(2→3)-β-D-Gal-(1→3)-α-D-GalNAc, β-D-Gal-
(1→3)-α-
D-GalNAc, and related compounds and analysis of their specific
interactions with lectins. Arch. Biochem. Biophys., Vol.383, pp. 28-37.
3
Determination of Binding Kinetics between
Proteins with Multiple Nonidentical Binding
Sites by SPR Flow Cell Biosensor Technology
Kristmundur Sigmundsson
1,4
, Nicole Beauchemin
3
,
Johan Lengqvist
2,5
and Björn Öbrink
1
1
Department of Cell and Molecular Biology, Karolinska Institutet, Stockholm,
2
Department of Medical Biophysics and Biochemistry, Karolinska Institutet, Stockholm,
3
Goodman Cancer Research Centre, McGill University, Montreal, QC,
4
Present address: Department of Medical Biophysics and Biochemistry,
Karolinska Institutet, Stockholm,
5
Present address: Department of Molecular Toxicology, Safety Assessment,
AstraZeneca Research and Development, Södertälje,
1,2,4,5
Sweden
3
Canada
1. Introduction
Protein-protein binding interactions are crucial in signaling networks that regulate cellular
functions in health and disease. A large number of membrane and cytoplasmic proteins
participate in those networks, and a complete understanding of their functional activities at
the cellular level would require comprehensive analysis of the kinetics of the various protein
interactions. This is, however, a herculean task due to both the multitude of interacting
proteins and the complexity of the individual pairwise binding interactions. The latter are in
many cases not simple 1:1 binding reactions but a result of simultaneous interactions
between several distinct binding sites. In an initial attempt to tackle this challenge we have
developed new algorithms and experimental procedures to determine the binding kinetics
of the cell adhesion receptor CEACAM1-L and the protein tyrosine phosphatase SHP-1 (Fig.
1). CEACAM1-L is a signal-regulating cell surface-associated transmembrane protein that
regulates a plethora of basic biological events including cell proliferation and motility,
apoptosis, tissue morphogenesis, immune reactions and microbial infections, vasculogenesis
and angiogenesis, and cancer growth and invasion (Gray-Owen & Blumberg, 2006; Müller et
al., 2009; Singer et al., 2010). Many of CEACAM1-L's regulatory activities are a result of its
binding and activation of Src-family kinases and the protein tyrosine phosphatases SHP-1
and SHP-2. The cytoplasmic domain of CEACAM1-L contains two phosphotyrosine-based
ITIM sequences, pY488 and pY515, that bind to SH2 domains in the kinases and
phosphatases (Fig. 1). The kinases have one SH2 domain whereas the phosphatases have
two SH2 domains, N-SH2 and C-SH2, arranged in tandem. Thus, there is a potential for at
least four different binding interactions between CEACAM1-L and SHP-1 or SHP-2. Here
we have focussed on the binding interactions between the cytoplasmic domain of
Biosensors – Emerging Materials and Applications
36
CEACAM1-L and the SH2 domains of SHP-1, which were studied in an SPR-based flow cell
biosensor.
To be able to analyze such a complex system, with several distinct binding sites in both of
the interacting molecules, we started by characterizing the interactions between the single
binding sites, using peptides and protein domains. The resulting parameters were then used
as building blocks for more elaborate analyses of the interactions of the tandem N,C-(SH2)
2
domain with the double-tyrosine-phosphorylated cytoplasmic domain of CEACAM1-L. The
major questions that we addressed with this approach were: which complexes are formed
between the CEACAM1-L cytoplasmic domain and the tandem SH2-domain of SHP-1, what
kind of kinetics do they obey, and which of them are of physiological relevance. To that end
we had to develop new reaction schemes based on plausible interactions, and translate them
into equations and algorithms that could be used for curve fitting analysis of recorded
sensorgrams. The analyses demonstrated that both the N-SH2 and C-SH2 domains of SHP-1
participated in binding to the two ITIM sequences in CEACAM1-L. Interestingly, our
approach led to the discovery of a second phosphotyrosine binding site in the C-SH2
domain, which differed kinetically from the other C-SH2 binding site. At physiological
temperature, the most pronounced complex that was formed was a double-docked form, in
which the CEACAM1-L pY488 motif occupied the N-SH2 binding site and the pY515 motif
occupied one of the two phosphotyrosine binding sites in the C-SH2 domain.
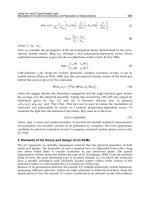
Fig. 1. Cartoon of CEACAM1-L, SHP-1 and a hypothetical interaction complex. Murine
CEACAM1-L has an intracellular domain of 73 amino acids including two phosphorylatable
tyrosine residues, Y488 and Y515. SHP-1 has two SH2 domains (labelled N and C) and a C-
terminal phosphatase domain (P). The phosphatase is autoinhibited when undocked. SH2-
domain interactions with phosphotyrosine-containing sequence motifs initiate a
conformational change leading to phosphatase activation.
2. Experimental procedures
2.1 Peptides
Peptides spanning the Y488 and Y515 regions of mouse CEACAM1-L were purchased from
K. J. Ross-Petersen AS (Horsholm, Denmark). These included both unphosphorylated and
Determination of Binding Kinetics between Proteins
with Multiple Nonidentical Binding Sites by SPR Flow Cell Biosensor Technology
37
tyrosine-phosphorylated forms of N-terminally biotinylated dodecameric peptides:
VDDVAY(488)TVLNFN, ATETVY(515)SEVKKK, and N-terminally cysteinylated
eicosameric and pentadecameric peptides: CKVDDVAY(488)TVLNFNSQQPNR and
CPRATETVY(515)SEVKKK, respectively. Additionally, a scrambled derivative of the
unphosphorylated Y488 dodecapeptide, Biotin-LANDFVNDTVYV, was purchased from the
same producer. All peptides were highly homogeneous and > 95 % pure as demonstrated
by amino acid analysis, HPLC, and MALDITOF mass spectrometry.
2.2 Recombinant proteins
The construction of recombinant proteins of single SH2 domains and the tandem form N,C-
(SH2)
2
of mouse SHP-1, and of the cytoplasmic part of mouse CEACAM1-L fused with GST
using the pGEX-2T vector system, has been described previously (Beauchemin et al. 1997).
Proteins were produced in Escherichia coli BL21. Protein synthesis was induced with IPTG
(0.2 mM). The tyrosine phosphorylated cytoplasmic part of CEACAM1-L (GST-Lcyt-
[pY488/pY515]) was produced in Epicurian coli TKX1 (#200124, Stratagene), inducing
protein synthesis simultaneously with IPTG (0.2 mM) and IAA (0.1 mM). Purification of the
GST fusion proteins was performed by affinity adsorption on glutathione-Sepharose
according to a standard protocol from the manufacturer (Amersham). Buffer exchange and
further purification of recombinant proteins was carried out on a Superose 12 prepacked
column attached to a FPLC 500 system (Pharmacia AB), equilibrated in 10 mM Hepes, 150
mM NaCl, 3.4 mM EDTA, and 0.005% surfactant P20, pH 7.4 (HBS). Protein purity was
confirmed by SDS-PAGE. Concentrations of purified GST-N-SH2, GST-C-SH2, GST-N,C-
(SH)
2
and GST-Lcyt proteins were determined by absorption spectroscopy, using the
following molar absorptivity values (ε in M
-1
cm
-1
, at 280 nm): 51730, 57480, 69630 and 43480,
respectively. In the protein interaction measurements, the active concentrations of the
analyte proteins were double-checked by the BIAcore-based procedure described in
(Sigmundsson et al., 2002). For GST removal, recombinant proteins were treated with 100
units of thrombin per 3 mg fusion protein per 1 ml at 4 ˚C, for 48 h, with mild swirling. The
calculated molecular masses of non-cleaved fusion proteins were: GST-N-SH2 = 37.5 kDa,
GST-C-SH2 = 39.0 kDa and GST-N,C-(SH)
2
= 51.1 kDa. The calculated molecular masses of
thrombin cleaved products were: N-SH2 = 11.3 kDa, C-SH2 = 12.9 kDa, N,C-(SH)
2
= 24.9
kDa and GST = 26.2 kDa. The tyrosine phosphorylation of GST-Lcyt was determined by
nanoelectrospray ionization mass spectrometry using a QTQF1 instrument (Waters),
analysing both intact full size protein and trypsinized fragments.
2.3 Protein interaction measurements
Interaction measurements based on surface plasmon resonance (SPR) detection were carried
out with a BIAcore 2000 instrument (BIAcore AB, Uppsala, Sweden).
2.4 Ligand immobilization
Peptides were immobilized on CM5 Sensor Chips, either by binding via the N-terminal
biotin groups to immobilized streptavidin (SA), or via direct coupling by thiol-disulphide
exchange. Carboxymethyl-modified dextran surfaces were activated according to a standard
procedure, with an injection of 0.05 M NHS/0.2 M EDC for 7 min. High density streptavidin
chips (SA ≈ 2000 RU) were prepared by injection of 140 μl of freshly prepared SA (50 μg/ml
in 5 mM acetate buffer, pH 4.5) at 10 μl/min. This resulted in 1995 – 2025 RU of immobilized
streptavidin per lane after blocking of remaining reactive esters with two injections of 1 M
Biosensors – Emerging Materials and Applications
38
ethanolamine-HCl, pH 8.5 for 2 min each. Low density streptavidin chips (SA ≈ 1000 RU)
were prepared by injection of 40 μl of SA (50 μg/ml) and blocking as described above,
which resulted in 980 – 1100 RU of SA per lane. N-terminally biotinylated dodecameric
peptides were dissolved in DMSO to give stock solutions of 3.5 g/l. Prior to immobilization,
the stocks were diluted to 50 μg/ml in HBS and then injected into separate lanes at 20
μl/min for one minute. Finally, the lanes were washed separately by four injections of 6 M
guanidine-HCl/HBS, pH 7.4 for 1 min each and injections of 4 M LiCl/HBS for 1 min and
0.25 % P20/HBS for 1 min, respectively. The levels of stably immobilized peptides were 200
– 240 RU and 65-80 RU per lane, for high and low density SA surfaces, respectively.
For preparation of low density peptide surfaces, N-terminally cysteinylated peptides were
immobilized via direct coupling by thiol-disulphide exchange. For this purpose, NHS/EDC
activated surfaces were modified by interaction with a freshly prepared solution of 80 mM
PDEA (thiol coupling reagent) in 0.1 M borate buffer pH 8.5 for 4 min, by injection of 40 μl at
10 μl/min, followed by a 4 min blocking step with 1 M ethanolamine-HCl, pH 8.5, prior to
peptide injections. Peptides were dissolved in DMSO at 2 mM concentration and were
diluted with 5 mM acetate buffers to the indicated concentrations immediately before
immobilization as follows: CKVDDVAY(488)TVLNFNSQQPNR 0.4 μM at pH 4.5,
CKVDDVA-pY(488)-TVLNFNSQQPNR 10.0 μM at pH 3.9, CPRATETVY(515)SEVKKK 0.2
μM at pH 4.5, and CPRATETV-pY(515)-SEVKKK 0.5 μM at pH 4.5. Levels of stably
immobilized peptides were 35 ± 5 RU per lane 1 and 2 for the pY515 and Y515 peptides
respectively, and 16 ± 5 RU for the pY488 peptide on lane 3, as determined after blocking of
remaining reactive surface 2-pyridinyldithio-groups with freshly prepared 6 mM L-cysteine
in 5 mM acetate, pH 4.5 for 2 min, followed by washing with 0.25% P20/HBS. If assuming
100% binding capacity of these two surfaces the theoretical saturation level, i.e. R
Max
with
regard to N,C-(SH)
2
as the analyte, was c:a 120 RU and 510 RU, for the pY488 and pY515
surfaces, respectively. The non-phosphorylated Y515 peptide on lane 2 was applied as the
reference surface. For preparation of peptide-free reference surfaces (lane 4), blocking was
performed by injection of the L-cysteine solution for 15 min at 10 μl/min.
For immobilization of the GST-Lcyt-pY protein, anti-GST antibody was amine-coupled to
CM5 Sensor Chips. For this purpose the carboxymethyl-modified dextran surfaces were
activated according to standard procedures. The antibody was diluted in 10 mM Na-acetate
buffer, pH 5.0, according to a standard protocol from the manufacturer and injected at 10
μl/min to a final immobilization level of 1000 ± 100 RU per lane. The surfaces were washed
ten times with 20 μl of 20 mM glycine, pH 2.2, followed by two washes with 20 μl 2 M
LiCl/HBS and one wash with 20 μl of 0.2 % P20/HBS, at a flow rate of 10 μl/min. GST-Lcyt-
pY was immobilized on lane 2 at a concentration of 0.2 mg/ml in HBS at a flow rate of 10
μl/min, for 6 min. A saturation level of c:a 112 RU was reached, and verified by an
additional injection of 20 μl of 0.5 mg/ml GST-Lcyt-pY, which did not add to the
immobilized amount of ligand. Lane 1 was saturated with GST and used as the reference
lane. When loading the reference lane, 0.4 mg/ml GST in HBS was flushed over both lane 1
and lane 2, for 10 min. This resulted in c:a 95 RU binding of GST to lane 1, while no change
was obtained in lane 2. Surfaces were washed 10 times with 1.5 M LiCl/HBS with no
detectable decrease in ligand levels.
2.5 Protein interaction analyses
Samples were kept at 2° C prior to injection. All interaction analyses were performed in
HBS at a flow of 20 μl/min. In all SPR assays involving peptide ligands, phosphorylated
Determination of Binding Kinetics between Proteins
with Multiple Nonidentical Binding Sites by SPR Flow Cell Biosensor Technology
39
peptides were placed in flow cells 1 and 3. Flow cell 2 was loaded with unphosphorylated
peptide or a scrambled unphosphorylated peptide and was used as a reference for
unspecific binding and background subtraction. Flow cell 4 was kept free of ligand
(peptide), but received the complete treatment of activation and inactivation. This flow
cell was used as an independent control to monitor differences in refractive indices of
sample and running buffer and to monitor background adsorption to the dextran (or
dextran-SA) surface. A monoclonal anti-phosphotyrosine antibody (PY99) was used to
confirm equal loadings of phosphotyrosine peptides in flow cells 1 and 3. For qualitative
binding studies non-cleaved and cleaved recombinant proteins were flushed over N-
terminally biotinylated dodecameric peptides at 25˚ C, immobilized on both high and low
density SA chips. Low density surfaces with N-terminally cysteinylated peptides (15-30
RU) were used in SPR assays aimed to determine kinetic constants. For this purpose,
recombinant proteins cleaved from GST were injected at different concentrations in a
randomized order with a total of 3 injections per concentration. This process was repeated
at 5˚, 15˚, 25˚, 35˚, and 37° C. Regeneration of ligand surfaces containing disulfide-linked
peptides was performed with a 1 min pulse of 4 M LiCl/HBS, followed by a 1 min pulse
of 0.25 % P20/HBS, at 20 μl/min. Interactions with the GST-Lcyt-pY ligand were
performed in triplicates at 25˚ C. The GST-Lcyt-pY ligand surface was regenerated with a
1 min pulse of 1.5 M LiCl/HBS, followed by a 1 min pulse of 0.20 % P20/HBS. To
optimize the interaction profiles used for kinetic calculations, the recorded primary
responses were processed in a double background subtraction routine. For this purpose,
triplicate injections of running buffer were recorded at all temperatures. Thereafter, the
averaged buffer profile of each flow cell, at a given temperature, was subtracted from the
primary response profiles of individual sample injections. Then, the reference lane
response was subtracted from the ligand lane response.
2.6 Interaction models
The recorded profiles of N,C-(SH2)
2
interactions with immobilized CEACAM1 peptides
(pY488 and pY515) were compared with three models, based on plausible interaction
mechanisms. The interaction of N,C-(SH2)
2
with GST-Lcyt-[pY488/pY515] required a
specific model, described below as Model 4. All the models assumed a mass transport
limited process based on the two compartment model (Myszka et al., 1997).
2.6.1 Model 1: A simple bimolecular interaction
The primary model for a simple interaction of two components, where one is in solution
(analyte: A) and the other is attached to a surface (ligand: L) is defined as a two step
process
where the first step is the mass transport of the analyte between the bulk flow and the
surface (characterized by the k
c
coefficient). The second step describes the interactions at the
surface, i.e. the rate of complex (AL) formation and dissociation.
A
bulk
A
surface
+ L
AL
k
c
k
c
k
a
k
d
Biosensors – Emerging Materials and Applications
40
2.6.2 Model 2: A bimolecular interaction of an analyte with two binding sites
The tandem shaped N,C-(SH2)
2
of SHP-1 represents a type of analyte, carrying at least two
binding sites per molecule. These two sites can possibly compete in binding to the same
phosphotyrosine motif (ligand: L). Model 1 cannot be applied to such an interaction, except
in the rare case where both sites (domains) would have identical interaction kinetics. A
model which takes into account the different kinetics of two binding sites on the same
analyte, interacting with a uniform ligand, has the form
Referring to N,C-(SH)
2
as the analyte, the rate constant pairs k
a1
, k
d1
and k
a2
, k
d2
describe the
kinetics of complexes formed via the N-SH2 and C-SH2 domains, respectively. This model
assumes a stoichiometry of 1:1 and a low density of the surface bound ligand.
2.6.3 Model 3: A bimolecular interaction of an analyte with three binding sites
This is an extension of Model 2, accounting for a third binding site in the analyte molecule.
The rate constant pair k
a3
and k
d3
, characterizes the kinetics of a complex (A
Z
L) formed via
this additional site, resulting in
2.6.4 Model 4: A bimolecular interaction between a ligand with two binding sites and
an analyte with three binding sites
A specific model was designed to address the interaction of the N,C-(SH2)
2
tandem domain
with the entire CEACAM1-L cytoplasmic domain phosphorylated on both tyrosine residues.
The model was restricted to AL binary complex forms, i.e. simultaneous binding of one A
molecule to two L molecules, or of two A molecules to one L molecule, was excluded. All
combinations of single docking between one of the three analyte sites and one of the two
ligand sites were included. Furthermore, we included all permutations of second docking
events allowing the formation of double docked AL forms from single docked forms. The
reactions in this model are displayed in Figure 4C.
A
bulk
A
surface
+ L
A
X
L
k
c
k
c
k
a
k
d1
A
Y
L
k
a
k
d2
A
Z
L
k
a3
k
d3
A
bulk
A
surface
+ L
A
X
L
k
c
k
c
k
a1
k
d1
A
Y
L
k
a2
k
d2
Determination of Binding Kinetics between Proteins
with Multiple Nonidentical Binding Sites by SPR Flow Cell Biosensor Technology
41
2.6.5 Mathematical description of models 1-4
A mathematical description of the interaction models is provided here in sets of coupled
first order differential equations. These equations were used in curve fit routines for kinetics
analyses, including the estimation of rate constants from experimentally obtained data. The
analyte concentration in the bulk and at the surface is defined by [A
B
] and [A
S
], respectively,
the concentration of free ligand binding sites as [L], and a surface bound complex of analyte
and ligand as [AL], all in the unit of μM. Different binding sites in the analyte molecule are
referred to as X, Y and Z. Association and dissociation rate constants are defined as k
a
or k
ax
,
and k
d
or k
dx
, respectively, where x defines a particular reaction. Unless stated differently, k
a
and k
d
are in the units of M
-1
s
-1
and s
-1
, respectively. The mass transport between the bulk
flow and the surface is defined by a coefficient k
c
. h
d
is a characteristic height of the diffusion
layer that links the change in concentration expressed per surface area ([AL]) and per
volume ([A
S
]). Calculations of h
d
and k
c
were performed in the same manner as we have
described previously (Sigmundsson et al., 2002).
Model 1:
(1.1)
(1.2)
Model 2:
(2.1)
(2.2)
(2.3)
(2.4)
Model 3:
(3.1)
(3.2)
(3.3)
(3.4)
(3.5)
Biosensors – Emerging Materials and Applications
42
Model 4:
The two ligand binding sites are referred to as α (pY488) and β (pY515). The three analyte
binding sites are referred to as X, Y and Z (N-SH2, C2-SH2 and C1-SH2, respectively). The
model takes into account three different ligand forms, which in our case refer to the
tyrosine-phosphorylation status of the ligand. In this respect the ligand is divided into three
populations: L
α
, L
β
and L
αβ
, for mono- and di-phosphorylated forms. The fractions of these
forms with regard to the total amount of phosphorylated ligand units are defined with Π, Ψ
and Ω, respectively. The detected response signal R, measured by an SPR-based sensor is
proportional to the amount of complex formed at the detector surface multiplied by the
factor MwG, i.e., R = MwG[AL], where Mw is the molecular mass of the analyte and G is a
factor converting the concentration to R values (G = 10000 R cm
2
/g of protein). When all the
immobilized ligand has been fully bound into an AL complex, R = R
Max
(i.e., a theoretical
maximum value). The contribution of the different [AL] complexes to the response signal (R)
can now be referred to as follows: R
αX
= [A
X
L
α
], defines the amount of a complex docked via
the α-site in the ligand and the X-site in the analyte. The total response of complexes docked
via the α
site is defined as R
α
. The amount of a double docked complex with a [α-X/β-Z]
configuration, is defined as R
αXβZ
. The total response of all double docked forms is defined
as R
αβ
. Complexes of di-phosphorylated single-docked ligands are defined with the
subscription 2P, eg. R
αX
2P
. Association constants labeled with stars (k
a
*
and k
a
**
) define the
second association steps giving rise to double docked forms. These constants have the unit
of s
-1
. To keep the amount of fit parameters at minimum it is assumed that a binding
between two interacting sites, whether formed via a primary or a secondary docking event,
dissociates with the same probability. Thus, the interactions described by k
a1
, k
a1
*
, k
a1
**
, all
share the same dissociation constant, k
d1
. The full size model includes 32 parameters.
Thereof 24 are rate constants. The model is easily adjusted for fewer reactions. The version
used to calculate the data presented in Figure 4 included 20 parameters, of which 16 were
rate constants. After the identification and elimination of non-existing reactions, and after
the identification of parameters which could be fixed, the fit variables could be limited to 5,
4 of which representing unknown rate constants, and R
Max
being the fifth global variable.
(4.1)
(4.2)
Determination of Binding Kinetics between Proteins
with Multiple Nonidentical Binding Sites by SPR Flow Cell Biosensor Technology
43
(4.3)
(4.4)
(4.5)
(4.6)
(4.7)
(4.8)
(4.9)
(4.10)
(4.11)
(4.12)
(4.13)
(4.14)
(4.15)
Biosensors – Emerging Materials and Applications
44
(4.16)
(4.17)
(4.18)
(4.19)
(4.20)
(4.21)
(4.22)
(4.23)
(4.24)
2.7 Determination of kinetic constants
Data modification including scale transformation and background subtraction was
performed with the program BIAevaluation 4.1. Data analyses and calculations based on
numerical approaches, including global curve fitting to interaction models for estimation of
kinetic constants, were performed with IGOR Pro (version 4.09.0, WaveMetrics, Inc.). Curve
fit functions based on models 1, 2, 3, and 4 were created as external operation routines,
compiled in C, using CodeWarrior IDE (version 5.1.1.1105, Metrowerks Corporation) and
applied together with the Global Fit Procedure in IGOR Pro, based on a nonlinear least-
squares method, utilizing the Levenberg-Marquard algorithm (Press et al., 1999). For
numerical integration, a fifth order Runge-Kutta-Fehlberg method was applied (Press et al.,
1999). Previous mathematical analysis has demonstrated that this numerical procedure,
used in the curve fitting routine, gives precise and accurate solutions of the underlying
differential equations (Sigmundsson et al., 2002).
2.8 Computational analysis of SHP-1 binding to mono- and di-phosphorylated
CEACAM1-L
The kinetic rate constants determined by the BIAcore analyses were used to compute the
binding kinetics of the SHP-1 tandem N,C-(SH2)
2
domain to CEACAM1-L phosphorylated
on Y488 only, or on both Y488 and Y515. This was done by setting up complete reaction
Determination of Binding Kinetics between Proteins
with Multiple Nonidentical Binding Sites by SPR Flow Cell Biosensor Technology
45
schemes for all possible pathways leading to the reversible formation of all complexes that
were identified by the experimental BIAcore analyses (see Tables 1 and 2 and Fig. 4C). The
coupled, non-linear differential equations that were formulated from these reaction schemes
were solved numerically, utilizing IGOR Pro.
3. Results
3.1 Interaction profiles
Interaction profiles of uncleaved and cleaved GST-fusion constructs of SHP-1 N-SH2, C-
SH2, and N,C-(SH)
2
domains with biotinylated peptides were recorded at 25° C. The SH2
domains interacted specifically with the two phosphorylated ITIM-like peptide motifs,
whereas responses with unphosphorylated ITIM-like sequences involving Y488 and Y515,
and a scrambled Y488 sequence, were insignificant and resembled the background profiles
of a ligand-free streptavidin surface (Fig. 2A-F). No binding was observed between GST and
the ligand surfaces (Fig. 2H). The N-SH2, C-SH2 and N,C-(SH2)
2
domains all interacted with
the pY488 ligand. However, the dissociation of the GST-fusion proteins was significantly
slower compared with that of the GST-free N-SH2, C-SH2 and N,C-(SH2)
2
domains (blue
curves in Figure 2: A vs. B, C vs. D, E vs. F). In fact, the binding of GST-C-SH2 and GST-N,C-
(SH2)
2
to pY488 gave rise to severe difficulties in regeneration of the ligand surface. These
results indicate that the GST moiety caused secondary interactions between the analyte
molecules at the surface.
No interaction was detected between pY515 and GST-N-SH2 or the N-SH2 domain (Fig. 2A-
B: red curves). The GST-C-SH2 and GST-N,C-(SH2)
2
proteins gave minor responses with the
pY515 ligand, while the free C-SH2 and N,C-(SH2)
2
domains showed significant interaction
(Fig. 2C-F: red curves). These results indicate that the GST part of these fusion proteins
blocked the access to a pY515 interaction site, which became available for binding in the
GST-free C-SH2 and N,C-(SH2)
2
domains. Together, Figures 2C and 2D indicate that the C-
SH2 domain holds 2 different binding sites. One of these is accessible (C1-site) and the other
is blocked (C2-site) in the GST-C-SH2 form. The accessible C1-site interacts with the pY488
ligand (blue), while the response to pY515 (red) is minimal (Fig. 2C). The C2-site on the C-
SH2 domain becomes accessible after cleavage from the GST fusion partner (Fig. 2D), giving
a characteristic binding profile to the pY515 ligand (red). This same site gives rise to an
additional profile in response to the pY488 ligand (blue), characterized by a sharp change in
the start of the association and dissociation phases (marked by arrows in Fig. 2D). The same
blockage of interaction with pY515 was seen for the GST-N,C-(SH2)
2
protein (Fig. 2E) when
compared with the response patterns of free N,C-(SH2)
2
(Fig. 2F). Figure 2G shows an
interaction with the anti-phosphotyrosine antibody (PY99), confirming identical
immobilization levels for the pY488 (blue) and pY515 (red) ligands.
3.2 Determination of kinetic constants for SH2 domains binding to distinct
phosphotyrosine ligands
Due to high avidity and problems with surface regeneration, it was not possible to collect
data for kinetic evaluation of the interactions of GST-C-SH2 and GST-N,C-(SH2)
2
with the
biotinylated pY488 and pY515 ligands. Furthermore, the interaction of GST-N-SH2 with the
biotinylated pY488 peptide could not be evaluated by any simple interaction models. The
free N-SH2 and C-SH2 domains were also unsuitable for kinetic analysis because they
underwent slow inactivation after cleavage of the GST moiety. Thrombin cleavage of the
GST-N,C-(SH2)
2
protein on the other hand provided a stable N,C-(SH2)
2
tandem domain,
Biosensors – Emerging Materials and Applications
46
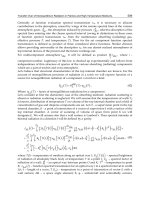
Fig. 2. Sensorgrams showing interaction profiles for SH2 domains derived from SHP-1 (non-
cleaved and cleaved from GST). Responses to the different CEACAM1-L-derived
biotinylated peptide ligands have the following colours: pY488 = blue, pY515 = red, Y488 =
green (reference lane) and a free streptavidin surface = pink. Analyte: A) GST-N-SH2, 2 nM
(3 × repeat), arrows indicate the start and end of sample injection. B) N-SH2, 4 nM. C) GST-
C-SH2, 10 nM. D) C-SH2, 15 nM, arrows indicate the two different profiles seen in the start
of the association and dissociation phases. E) GST-N,C-(SH2)
2
, 15 nM. F) N,C-(SH2)
2
, 20 nM
(3 × repeat). G) PY99 Mab, 1 nM. H) GST, 1 μM. RU: Response units, cRU: corrected
response units (response from the reference lane has been subtracted). Measurements were
performed in HBS, pH 7.4, 25˚ C, at a flow of 20 μl/min. Low density ligand surfaces were
used in A, B, C, D, F, G, H. A high density ligand surface was used in E.
Determination of Binding Kinetics between Proteins
with Multiple Nonidentical Binding Sites by SPR Flow Cell Biosensor Technology
47
which could be used for kinetic interaction analysis. For this purpose we used ligand surfaces
with N-terminally cysteinylated peptides, to circumvent the regeneration problems with the
biotinylated peptide ligands. Recordings at five different temperatures showed that the
interactions of N,C-(SH2)
2
with the pY488 and pY515 motifs were strongly temperature-
dependent, exhibiting an overall increase in both association and dissociation rates with
increasing temperature (Fig. 3). However, the interaction patterns were complex and could not
be fitted to the simple interaction model 1, or to a two-state version of model 1 in which the
primary binding is followed by a more stable binding (not shown). Thus, in order to work out
the kinetics, we designed and applied fit routines based on plausible interaction paths and the
information obtained from the experiments described in Figure 2. These routines were
denoted models 2 and 3. The resulting curve fittings are shown in Figure 3, and the respective
rate constants from these fits are listed in Table 1. Using these rate constants, the curve fit for
the highest concentration of each data set (plotted red) was subjected to profile analysis of the
underlying, contributing binding reactions (plotted black, blue and green), as shown in Figure
3. In addition, we estimated the surface-to-bulk analyte concentration ratio ([A
surface
]/[A
bulk
])
during the interval of sample injection, by applying the same parameters and rate constants as
used and obtained in the fit approaches. These profiles (not shown) indicated the data
recordings to be essentially free of mass transport limitation.
Recordings of the interaction of N,C-(SH2)
2
with the pY488 motif indicated some higher
degree of complexity. At 5° and 15° C model 3 matched best with this interaction, whereas
applying model 3 at 25° and 35° C, resulted in a reduction to model 2. Similarly, at 37° C the
interaction was best described by model 2, although a reduction towards model 1 was
indicated. The profile that contributed the most to the total signal at all temperatures was
the N-SH2-site interacting with the pY488 motif (Fig. 3, black dashed curve). This interaction
is characterized by rapid association and dissociation (Table 1; see also Figs. 2A and B).
Competition from one or two additional binding sites on the N,C-(SH2)
2
protein (belonging
to the C-SH2 domain) leads to slight profile changes. In the inserted graph in Figure 3 at 25°
C (black: N-SH2 site binding to pY488), we demonstrate with a simulation based on the
observed rate constants, how the profile for the N,C-(SH2)
2
molecule would appear if only
the N-SH2 site was active, and the other binding sites were inactive. The similarity of this
profile with that observed for the isolated N-SH2 domain in Figure 2B is striking. From
comparison with the binding profiles of the single SH2 domains (Figs. 2A-D) we conclude
that the second binding reaction, plotted as green dashed profiles in Fig. 3 (left panels),
represents the C1-SH2 site interaction with the pY488 motif. This interaction showed slow
association and dissociation, resembling the observed binding profile for the interaction of
the GST-C-SH2 accessible site with pY488 (Figs. 2C and D, blue curves). Interestingly, this
interaction was most pronounced at 25° C and decreased with further rise in temperature,
and therefore appears to be less relevant at physiological temperature (37° C). The third
binding reaction (blue dashed profiles in Fig. 3, left panels) corresponded to the interaction
of pY488 with the C2-SH2 site (the inaccessible site in GST-C-SH2, according to Fig. 2C and
D, which is the part of the blue curve characterized by a fast on/off profile, indicated by
arrows in Fig 2D). This interaction was also highly temperature-dependent. From 15° to 25°
C its magnitude decreased markedly, and at temperatures ≥ 35° C it no longer existed. This
is shown in Figure 3, where the data recorded at 25° and 35° C were analyzed with a
function based on model 3 (returning an infinitely small k
a3
). It should be pointed out that in
contrast to the results displayed in Figure 3, Figure 2D shows that the C2-site of the isolated
C-SH2 domain interacted with the pY488 ligand at 25° C, and provided a minor but
detectable contribution to the recorded signal. Thus, this interaction might only occur for the
Biosensors – Emerging Materials and Applications
48
Fig. 3. Sensorgrams for the interactions of N,C-(SH2)
2
with the CEACAM1-L-derived
cysteinylated phosphopeptides pY488 (left panel) and pY515 (right panel), at various
temperatures. At each temperature samples were injected for 3 minutes in a randomized
order with a total of three injections per concentration. All data are shown (black) together
with global curve fits (red). Residuals are shown above each global fit result. For the pY488
ligand at 5°, 15°, 25° and 35°, fits were based on model 3. Fits for pY488 at 37° and for pY515
at all temperatures, were based on model 2. Analyte concentrations were defined as fit
variables, with the initial values of 120, 60, 30, 15, 12, 6, 3, and 1.5 nM, as estimated from
dilution factors and applied with constraints of ± 30 %, in global fit approaches. Flow rate
was 20 μl/min. R
Max
was 120 and 510 RU for the pY488 and pY515 surfaces, respectively.
For the 24.9 kDa analyte, diffusion coefficients and h
d
at 5°, 15°, 25°, 35° and 37° C were: (9.5,
9.8, 10.2, 10.5, 10.6)×10
-7
cm
2
s
-1
, and 6.84, 6.92, 7.00, 7.08, 7.10 μm, respectively. Profile
analysis for the 120 nM concentration responses is provided to the right of each fit panel.
cRU: corrected response units. The results are tabulated in Table 1.
Determination of Binding Kinetics between Proteins
with Multiple Nonidentical Binding Sites by SPR Flow Cell Biosensor Technology
49
isolated C-SH2 domain at 25° C and above, disappearing in the N,C-(SH2)
2
domain for
conformational/stability reasons.
At 37° C the interaction of the C1-SH2 site with pY488 also disappeared almost completely.
The decrease in binding of the C1-SH2 and C2-SH2 sites to pY488 with increasing
temperature represents a true temperature-dependence and was not caused by denaturation
of the C-SH2 domain, since both of these sites bound significantly to pY515, even at 37° C
(Fig. 3, right panels; Table 1). Thus, at 37° C, the interaction of the N,C-(SH2)
2
tandem
domain with pY488 approached model 1, in which the rapid association/dissociation
between the N-SH2 domain and the pY488 motif dominated.
The analysis of the N,C-(SH2)
2
binding to the pY515 peptide gave excellent curve fittings
applying model 2, at all temperatures. From the data shown in Figures 2A and B (red curves),
we know that the N-SH2 domain did not interact with pY515. Therefore, it is unlikely that the
N-SH2 domain was involved in the interaction of N,C-(SH2)
2
with pY515. Accordingly, and
by comparing with the binding profiles of the single SH2 domains (Figs. 2C-F), we refer to the
major reaction of the N,C-(SH2)
2
with pY515 (Fig. 3, right panels: blue dashed profile) as the
C2- site, i.e. the GST-C-SH2-inaccessible site in the pY515 interaction (Fig. 2 C,D: red profiles).
The less pronounced reaction (Fig.3: green profiles) we refer to as the C1-SH2 site, i.e. the GST-
C-SH2 accessible site in the interaction with pY515. While the interaction of the C1-SH2 site
with pY515 appears minimal at 25° C, it becomes significant at 35° and 37° C.
Interaction Temp k
a
k
d
K
d
°C M
-1
s
-1
s
-1
M
N-SH2:pY488 5 1.45
×10
6
±1.6×10
5
1.0×10
-1
± 5×10
-3
7.4×10
-8
15 1.72×10
6
±3.6×10
5
2.3×10
-1
±2×10
-2
1.4×10
-7
25 1.83×10
6
±1.6×10
4
3.2×10
-1
±3×10
-3
1.8×10
-7
35 2.00
×10
6
±1.5×10
2
9.9×10
-1
±1×10
-3
5.0×10
-7
37 2.17×10
6
±1.7×10
5
1.5 ±5×10
-2
6.9×10
-7
C1-SH2:pY488 5 1.37×10
4
±9.8×10
2
7.1×10
-4
±6×10
-5
5.2×10
-8
15 9.48×10
3
±1.3×10
3
3.5×10
-4
±3×10
-5
3.7×10
-8
25 1.01×10
4
±0.6×10
1
8.0×10
-4
±1×10
-5
7.9×10
-8
35 2.33
×10
3
±3.6×10
1
5.5×10
-3
±8×10
-5
2.4×10
-6
37 1.39×10
2
±1.8×10
1
3.8×10
-4
±2×10
-4
2.8×10
-6
C2-SH2:pY488 5 1.52×10
5
±5.1×10
4
3.9×10
-2
±5×10
-3
2.6×10
-7
15 1.00×10
5
±4.0×10
3
7.0×10
-2
±1×10
-2
6.5×10
-7
C1-SH2:pY515 5 2.54×10
4
±1.8×10
3
2.9×10
-1
±9×10
-3
1.1×10
-5
15 1.86×10
4
±1.0×10
3
2.6×10
-1
±1×10
-2
1.4×10
-5
25 2.18×10
4
±4.1×10
3
4.2×10
-1
±3×10
-2
2.1×10
-5
35 2.68×10
3
±5.0×10
1
4.2×10
-2
±1×10
-3
1.6×10
-5
37 3.98
×10
3
±6.3×10
1
3.5×10
-2
±6×10
-4
8.8×10
-6
C2-SH2:pY515 5 1.95
×10
3
±1.3×10
2
9.4×10
-5
±4×10
-6
4.8×10
-8
15 2.94×10
3
±1.2×10
2
1.43×10
-4
±3×10
-6
4.9×10
-8
25 3.25×10
3
±6.0×10
2
3.72×10
-4
±3×10
-6
1.2×10
-7
35 1.83
×10
3
±5.0×10
1
9.01×10
-4
± 8×10
-6
4.9×10
-7
37 2.08×10
3
±1.4×10
1
1.58×10
-3
±1×10
-5
7.6×10
-7
Table 1. Kinetic parameters for the interactions between the SHP-1 N,C-(SH2)
2
domain and
CEACAM1-L derived pY488 and pY515 peptides.
Biosensors – Emerging Materials and Applications
50
3.3 Determination of the mechanism and kinetic constants for the interaction of the
N,C-(SH2)
2
domain with the CEACAM1-Lcyt cytoplasmic domain
Finally, we analyzed the interaction at 25˚ C of the tandem N,C-(SH2)
2
domain with the full
size cytoplasmic domain of CEACAM1-L, phosphorylated on both tyrosine residues (Y488
and Y515). According to mass spectrometry analysis c:a 75% of the GST-Lcyt ligand,
produced in the E. coli TKX1 strain, was phosphorylated. Approximately 34% of the
phosphorylated fraction was accounted for by di-phosphorylated GST-Lcyt (pY488, pY515),
63 % was mono-phosphorylated on Y488, and c:a 3 % was mono-phosphorylated on Y515.
The phosphorylated GST-Lcyt ligand (34.2 kDa) was immobilized to give 112 RU. This
provided a theoretical R
Max
of c:a 115 RU with respect to N,C-(SH2)
2
(24.9 kDa) binding,
assuming a binding ratio of 1:1 and 100% ligand access. The N,C-(SH2)
2
domain showed no
detectable interaction with the GST reference surface.
Ligand
CEACAM1-L
cytoplasmic domain
pY-peptide
Parameter Fixed Value
± SD
Value Interaction
k
a1
(M
-1
s
-1
) ● 1.83×10
6
1.83×10
6
N-SH2 to pY488
k
d1
(s
-1
) 2.69×10
-1
3.7×10
-3
3.20×10
-1
N-SH2 off pY488
k
a2
(M
-1
s
-1
) ● 0 Negligible C2-SH2 to pY488
k
d2
(s
-1
) ● 0 Negligible C2-SH2 off pY488
k
a3
(M
-1
s
-1
) ● 1.01×10
4
1.01×10
4
C1-SH2 to pY488
k
d3
(s
-1
) ● 8.00×10
-4
8.00×10
-4
C1-SH2 off pY488
k
a4
(M
-1
s
-1
) ● 3.25×10
3
3.25×10
3
C2-SH2 to pY515
k
d4
(s
-1
) ● 3.72×10
-4
3.72×10
-4
C2-SH2 off pY515
k
a5
(M
-1
s
-1
) ● 2.18×10
4
2.18×10
4
C1-SH2 to pY515
k
d5
(s
-1
) 2.32×10
-2
1.4×10
-3
4.20×10
-1
C1-SH2 off pY515
k
a1*
(s
-1
)
i)
0.35 0.12
N-SH2 to pY488
on C1-SH2:pY515
k
a5*
(s
-1
)
i)
4.81 0.14
C1-SH2 to pY515
on N-SH2:pY488
k
a1*
(s
-1
)
ii)
3.94 2.19
N-SH2 to pY488
on C1-SH2:pY515
k
a5*
(s
-1
)
ii)
0.50 0.02
C1-SH2 to pY515
on N-SH2:pY488
Table 2. Kinetic parameters for the interaction between the SHP-1 N,C-(SH2)
2
domain and
the tyrosine-phosphorylated CEACAM1-L cytoplasmic domain. The experimental data
shown in Figure 4A were analyzed by Model 4. The kinetic parameters are defined in Model
4. The parameters labelled (●) were kept fixed during the curve fitting runs. The parameter
values for the pY-peptide ligand were taken from Table 1.
Determination of Binding Kinetics between Proteins
with Multiple Nonidentical Binding Sites by SPR Flow Cell Biosensor Technology
51
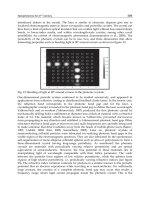
Fig. 4. The interaction of N,C-(SH2)
2
with mono- and di-phosphorylated CEACAM1-L
cytoplasmic domain. The N,C-(SH2)
2
domain of SHP-1 was injected at 25° C for 3 min, at 20
μl/min. Ligand with the composition of 63 % GST-Lcyt-pY488, 3 % GST-Lcyt-pY515 and 34
% GST-Lcyt-[pY488/pY515], according to mass spectrometry analysis, was immobilized
(112 RU) on a low density anti-GST-Ab surface. Reference surface was saturated with GST.
A) Sensorgram showing averaged responses of three runs per concentration (black) of 60,
30, 15, 12, 6, 3, 1.5, 0.75, 0.375 nM, together with a global curve fit (red), based on an
optimized interaction model described in C. The averaged squared residual per data point,
r
2
, was 0.188. The results are tabulated in Table 2. B) Profile analysis showing the
contribution of the different complex forms to the response obtained at [Analyte] = 60 nM.
Complexes are indicated with N-488/C1-515: N-SH2 bound to pY488 and C1-SH2 bound to
pY515 in tandem; N-488: N-SH2 bound to pY488; C1-488: C1-SH2 bound to pY488; C1-515:
C1-SH2 bound to pY515; C2-515: C2-SH2 bound to pY515. The tyrosine-phosphorylation
status of the ligand in a particular complex is indicated by 1P and 2P, for mono- and di-
phosphorylation, respectively. C) A scheme for the interactions predicted by the global fit
results in A. The N-SH2 domain is coloured red, the C-SH2 domain is coloured green, and
the phosphatase domain is coloured yellow. For simplicity reasons the phosphatase domain
(yellow) was omitted from all but two complexes, and the CEACAM1 extracellular domain
(grey) is only shown on the non-complexed molecules. Interactions suggested by the global
fit-results are indicated in black. Interactions excluded by the fit results are indicated in
grey. Red circles are drawn around the most ubiquitous complexes (dashed circle for a
mono-phosphorylated ligand and solid circle for a di-phosphorylated ligand).
Biosensors – Emerging Materials and Applications
52
A special curve fit approach was designed for an interaction model which allowed testing of
all combinations of single and double dockings (model 4). Constraints were introduced to
exclude non-permissible interactions, such as N-SH2 interactions with pY515. Initial values
for confirmed interactions were obtained from Table 1 and the number of fit parameters and
variables were trimmed to a minimum. Despite our efforts to provide various initial values
for the pY488 binding to the C2-site (represented in our model by k
a2
), the fit-routine
consistently repressed this parameter to zero, indicating a non-existant or irrelevant
interaction, in agreement with the results obtained with the mono-phosphorylated pY488
peptide (Table 1). This eliminated two variables (k
a2
and k
d2
) from the model. Likewise, all
forms of double-docked complexes could be eliminated except the N-488/C1-515, which
was mandatory for adequate quality fit results. According to this analysis, a total of five
complexes were formed. Four of these belonged to the single-docked forms, observed earlier
on the mono-phosphorylated peptide surfaces at 25° C. The fifth form was the double-
docked N-488/C1-515 complex. The results from this analysis are shown in Figure 4 and
tabulated in Table 2. Importantly, the primary rate constants diverged minimally from those
obtained with the mono-phosphorylated peptides. However, the results included two
indistinguishable solutions for the secondary rate constants, k
a1*
and k
a5*
, which describe the
second docking event, during the formation of a double-docked complex (Fig. 4C). Both
solutions are listed in Table 2, labelled with superscripts:
i)
k
a1*
< k
a5*
and
ii)
k
a1*
> k
a5*
.
Although the fit approach could not distinguish between these two solutions, it seems
logical that the second alternative, k
a1*
> k
a5*
, is more probable, because the corresponding
primary rate constants showed the relation k
a1
>> k
a5
for all conditions (Table 1). A profile
analysis is provided in Fig. 4B. According to this result the most pronounced complex was
the double-docked form with the N-SH2 site bound to pY488 and the C1-SH2 site bound to
pY515. Complexes with two analyte molecules bound per di-pY-ligand were rejected by all
fit algorithms. Such complexes probably do not form for steric reasons. The interaction
model that satisfied the global curve fit result is schematized in Figure 4C.
3.4 Kinetics of the binding of the N,C-(SH2)
2
domain to mono- and di-phosphorylated
CEACAM1-L
We wanted to determine both the kinetics and the equilibrium of all the types of complexes
that SHP-1 could form with the CEACAM1-L cytoplasmic domain, either mono-
phosphorylated on Y488, or fully di-phosphorylated on both Y488 and Y515. This could not
be done by direct BIAcore experiments because experimental phosphorylation of the
recombinant CEACAM1-L cytoplasmic domain always resulted in a mixture of mono- and
di-phosphorylated protein. Therefore, we applied computational analysis utilizing the rate
constant values from Table 2 for the 25° C condition. At 37° C, a compromise solution was
applied, since experimental data did not exist for k
a1*
and k
a5*
. Primary rate constants from
Table 1 for 37° C were thus applied together with the
ii)
k
a1*
> k
a5*
values of Table 2. The
computation was done for a reaction volume that consists of a shell including the lipid
bilayer contained within a 20 nm thick extracellular layer and a 15 nm thick intracellular
layer (Öbrink et al., 2002). CEACAM1 is anchored in the lipid bilayer, and based on earlier
biochemical data we assumed the concentration of CEACAM1-L in the reaction volume to
be 1.0 µM. An overall cellular concentration of SHP-1 was determined to 1.84 µM in cultured
epithelial cells (unpublished results). This concentration value was kept constant during the
computation, assuming non-limiting diffusion of SHP-1 from the inner bulk cytoplasmic
region to the 15 nm thick cytoplasmic reaction volume. The results are displayed in Figure 5.
Determination of Binding Kinetics between Proteins
with Multiple Nonidentical Binding Sites by SPR Flow Cell Biosensor Technology
53
For CEACAM1-L mono-phosphorylated on Y488 the temperature is an essential factor,
affecting which type of complex will govern the system (Fig. 5A, C). At 25° C, the N-
SH2:pY488 complex (N-488) dominated during the first eight minutes, but thereafter the C1-
SH2:pY488 form (C1-488) became predominant. Equilibrium was reached in 40 minutes,
with 31 % N-488 and 69 % C1-488. At 37° C, the N-488 complex dominated the system at all
times, providing an opposite equilibrium of 80 % N-488 and 20 % C1-488.
The binding kinetics to CEACAM1-L phosphorylated on both Y488 and Y515 were
somewhat more complex (Fig. 5B, D). Immediately after phosphorylation, the binding of the
N-SH2 domain to pY488 accounted for c:a 80 % of total complexes. This complex then
underwent a second docking to provide the double-docked N-488/C1-515 form. At both 25°
and 37° C, the N-488/C1-515 form already dominated from the first minute and to
equilibrium. At equilibrium at 37° C, N-488/C1-515 accounted for 62% of all complexes and
the single-docked C1-515 form accounted for 24 %. The single-docked N-488 and C2-515
forms accounted for c:a 6 % each. These results indicate the N-488 complex and the N-
488/C1-515 complex to be the biologically relevant forms.
4. Discussion
The impetus for this work was to advance our understanding of the signaling by the cell
adhesion molecule CEACAM1-L. Because of the central role of SHP-1 in CEACAM1-L-
mediated signaling, we chose to initiate this line of studies with a thorough analysis of the
binding interactions between SHP-1 and the CEACAM1-L tyrosine-phosphorylated
cytoplasmic domain. We applied a surface plasmon resonance-based technique (the BIAcore
flow cell biosensor) to investigate the key patterns and kinetics of the binding interactions of
SHP-1 with CEACAM1-L. Because CEACAM1-L has two phosphotyrosine binding motifs
and SHP-1 has two SH2 domains, there is potential for several combinations of
simultaneously forming binding complexes. To analyze such a combinatorial system we
applied a classical reductionistic approach, starting by characterizing interactions between
single binding sites. Results from these analyses were then used as building blocks for more
elaborate analyses of the interactions of the tandem N,C-(SH2)
2
domain of SHP-1 with the
CEACAM1-L double-tyrosine-phosphorylated cytoplasmic domain.
Initially, we used GST-fusion proteins of the SHP-1 SH2 domains. An unforeseen
complication with this approach was that the GST moiety blocked some binding sites in
both the GST-C-SH2 and the GST-N,C-(SH2)
2
proteins, which was discovered when the GST
moiety was cleaved from the fusion proteins. However, this blocking effect had a positive
consequence, because it led to the discovery of an additional binding site for
phosphotyrosine motifs in the C-SH2 domain. Thus, there are three binding sites for
tyrosine-phosphorylated CEACAM1-L in the SH2 domains of SHP-1. Finding a third
phosphotyrosine recognition site was not anticipated, but was a consequence of the unique
detectability of the SPR-based approach, which demonstrates one of the advantages of our
strategy and the novel algorithms for binding analysis.
Most SH2 domains are believed to have one binding site for phosphotyrosine motifs,
involving ArgαA2 and ArgβB5 (Waksman et al., 1993). However, our finding of an
additional binding site for phosphotyrosine in the C-SH2 domain of SHP-1 is supported by
the work of Weber et al. (Weber et al., 2000). By detailed NMR analysis of a doubly tyrosine-
phosphorylated peptide (from the polyoma middle T antigen) complexed with the N-SH2
domain of the p85 subunit of phosphoinositide 3-kinase, they found a second site, in which
Biosensors – Emerging Materials and Applications
54
the phosphotyrosine is coordinated by a network of hydrogen bonds with the three amino
acids, E411, S412 and the ε-amino group of K423. Sequence alignment of the p85 N-SH2
domain with the C-SH2 domain of SHP-1 demonstrates that the latter has two lysine
residues, K198 and K199 (Yang et al., 2003), in the positions corresponding to E411 and S412
in the former one. Thus, this region of the SHP-1 C-SH2 domain has two positively charged
amino acids, which could interact with the CEACAM1-L negatively charged
phosphotyrosine residues. Site localization and further characterization of the two
phosphotyrosine binding sites in the SHP-1 C-terminal SH2 domain require structural
analysis of co-crystals of SHP-1 SH2 domains with mono- and double-phosphorylated
CEACAM1-L cytoplasmic domains.
Experiments with single SH2 domains binding to mono-phosphotyrosine peptides showed
that some interactions, e.g. the binding of the N-SH2 domain to the pY488 motif, had very
rapid association and dissociation phases. Because of the relatively small number of reading
points in such phases, the curve fit algorithm could not distinguish between several sets of
solutions for k
a
and k
d
. This called for constraints to be introduced in the curve fitting
procedure. To that end we assumed that the combination of the smallest possible rate
constants, which satisfied the curve fitting, represented the most accurate description of
these fast reactions.
Because single N-SH2 and C-SH2 domains were unstable we performed all detailed kinetic
analyses with the N,C-(SH2)
2
protein. The interactions of N,C-(SH2)
2
with the pY488 and
pY515 peptides followed the binding profiles and patterns predicted by the binding
interactions of the individual N-SH2 and C-SH2 domains (see Figs. 2 and 3). The design and
utilization of appropriate interaction schemes (models 2 and 3) were thus straightforward.
Kinetic analysis at several different temperatures, analyzed by models 2 and 3, confirmed
the existence of two binding sites in the C-SH2 domain, and one binding site in the N-SH2
domain. However, the different binding interactions had different temperature-
dependencies. The interaction of the C2-SH2 site with the pY488 motif, which according to
our analysis was significant at and below 15° C, no longer existed at and above 25° C.
Similarly, the interaction of the C1-SH2 site with the pY488 motif had a fairly slow
dissociation rate at all tested temperatures, but its association rate decreased by two orders
of magnitude, upon temperature change from 5° to 37° C. Thus, at 37° C the contribution of
this interaction was markedly decreased. In contrast, the interaction of the C1-SH2 site with
the pY515 motif, which barely was detectable at 25° C, became significant enough at 37° C to
claim physiological relevance.
The kinetic binding properties of the different complexes between tyrosine-phosphorylated
CEACAM1-L and SHP-1 lead to interesting conclusions about in vivo complex formation
between these signaling proteins. In many cell types CEACAM1-L tyrosine-phosphorylation
is transient, with a peak 5-10 minutes after the triggering event. Thus, binding of SH2
domain-containing tyrosine kinases and phosphatases to CEACAM1-L can only happen
within this time span. Complexes characterized by rapid association, such as N-SH2 binding
to the pY488 site, will dominate early after tyrosine-phosphorylation relative to complexes
with similar equilibrium binding affinities but slower association and dissociation.
Computational analysis of the binding data obtained with the double-tyrosine-
phosphorylated CEACAM1-L cytoplasmic domain and the tandem N,C-(SH2)
2
domain
provided interesting insights into the time-dependent formation of the various CEACAM1-
L:SHP-1 complexes. One finding was that the binding of SHP-1 to CEACAM1-L mono-
phosphorylated on Y488 and to CEACAM1-L phosporylated on both Y488 and Y515, was
Determination of Binding Kinetics between Proteins
with Multiple Nonidentical Binding Sites by SPR Flow Cell Biosensor Technology
55
Fig. 5. Kinetics of the N,C-(SH2)
2
domain binding to mono- and di-phosphorylated
CEACAM1-L. Interactions of CEACAM1-L mono-phosphorylated on Y488 (A,C) or di-
phosphorylated on Y488 and Y515 (B,D), were analyzed computationally for two
temperature conditions, 25° and 37° C, applying the model described in Fig. 4C. The initial
membrane concentration of non-complexed phosphorylated CEACAM1-L was set to 1 μM;
the cytoplasmic concentration of SHP-1 was kept constant, at 1.84 μM. For 25° C, the rate
constants were taken from Table 2. For 37° C, the primary rate constants from Table 1 were
used, together with k
a1*
ii)
and k
a5*
ii)
from Table 2. The notions provided in A are valid also
for C. The notions provided in B are valid also for D. Complexes are indicated with N-488:
N-SH2 bound to pY488; C1-488: C1-SH2 bound to pY488; C2-515: C2-SH2 bound to pY515;
C1-515: C1-SH2 bound to pY515; N-488/C1-515: N-SH2 bound to pY488 and C1-SH2 bound
to pY515 in tandem.