Environmental Management in Practice Part 2 pptx
Bạn đang xem bản rút gọn của tài liệu. Xem và tải ngay bản đầy đủ của tài liệu tại đây (1.1 MB, 30 trang )
2
Environmental Protection
Expenditure in European Union
Elzbieta Broniewicz
Faculty of Management, Technical University of Bialystok
Poland
1. Introduction
Environmental protection expenditure should show the efforts being made to prevent,
reduce and eliminate pollution resulting from the production or consumption of goods and
services. The chapter presents the basic definitions and survey results of environmental
protection expenditure in 25 European Union countries.
Environmental protection expenditure (EPE) is defined as the amount of money spent on all
purposeful activities directly aimed at the prevention, reduction and elimination of
pollution or nuisances resulting from the production processes (or consumption of goods
and services). Data on environmental expenditure are collected from the European countries
through the Joint OECD/Eurostat Questionnaire on Environmental Protection Expenditure
and Revenues (EPER). The data covers five economic variables:
investments for environmental protection:
pollution treatment investments,
pollution prevention investments,
current expenditure for environmental protection,
subsidies/transfers given for environmental protection activities.
The Questionnaire EPER contains also the data concerning household’s expenditure for
environmental protection.
The scope of Environmental Protection is defined according to the Classification of
Environmental Protection Activities (CEPA, 2000), which distinguishes nine different
environmental domains: protection of ambient air and climate, wastewater management,
waste management, protection and remediation of soil, groundwater and surface water,
noise and vibration abatement, protection of biodiversity and landscapes, protection against
radiation, research and development and other environmental protection activities.
The purpose of the chapter is to provide the information, how vary the environmental
protection expenditure in European Union over the years and what are the trends in specific
domains of environmental protection. The comparison between the amount of costs in
different countries of European Union is very interesting.
Environmental protection is an action or activity (which involves the use of equipment,
labour, manufacturing techniques and practices, information networks or products) where
the main purpose is to collect, treat, reduce, prevent, or eliminate pollutants and pollution or
any other degradation of the environment resulting from the operating activity of the
organization.
Environmental Management in Practice
22
Environmental protection expenditure is the sum of capital and current expenditure for the
undertaking of environmental protection activities.
Investment expenditure refers to financial or material costs, which aim at creating new
permanent resources or improving (reconstruction, extension, restoration, adaptation or
modernization) the existing objects of permanent property. It also means costs of so called
first investment equipment. Presented division of investment costs is developed according
to the rules of national accounting system, compliant with the “SNA 1993”
recommendations. Investment expenditure can be divided into permanent resources and
other costs.
Environmental protection current expenditure includes costs of activity operation and
maintenance (technology, process, equipment). Current expenditure is to prevent, reduce,
dispose or eliminate pollution and other environmental losses caused by current activities of
the entity. They include internal costs (including costs of operation and maintenance of
environmental protection installations as well as environmental charges), costs of services
provided by external entities, charges for sewage treatment and waste collection; costs of
control systems, monitoring, laboratory research, management.
Investment and current environmental expenditure have been divided, according to the
property sectors, into:
public sector – government institutions (central public administration, regional and local
governments as well as public organizations and institutions mainly classified in NACE,
Rev. 1 as 75),
- business sector – commercial enterprises, financial and insurance institutions as well as
non-commercial institutions (all activities except NACE 75),
- producers specialized in environmental protection (NACE 37 and 90) whose main
activity is providing services for environment protection, mainly waste collection
disposal and sewage treatment,
- household sector – there is no clear distribution into investment and current
expenditure in this sector; the specificity of household activities combines all the types
of expenditure together (SERIEE, 1994).
The latest part of this chapter concerns Polish surveys of environmental protection
expenditure in households.
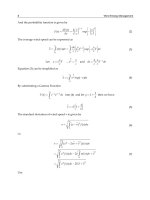
2. Total environmental protection expenditure in UE
Total environmental expenditure in 2007
1
costs European economy around 220 billion
euro
2
. The biggest share was contributed by specialized producers – 41,2% of the total
environmental expenditure, industry – 31,0% and public sector – 27,8% (Fig. 1 and Table
1).
The basic indicators used to analyse the dynamics of environmental expenditure are:
contribution to Gross Domestic Product (GDP),
the investment expenditure per inhabitant.
Environmental expenditure in EU25 in 2007 accounted for 1,8% GDP and in 2002 for 1,7%
GDP (except household expenditure) are presented in Fig. 2.
1
The latest available data.
2
Household’s expenditure are excluded.
Environmental Protection Expenditure in European Union
23
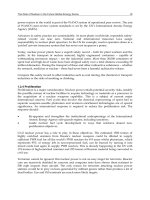
Specification
Time
2007 2006 2005 2004 2003 2002
European Union
(27 countries)
224 235
e)
205 960
e)
192 387
e)
184 629
e)
179 409
e)
173 353
e)
European Union
(25 countries)
219 953
e)
202 686
e)
190 332
e)
182 792
e)
178 206
e)
172 052
e)
European Union
(15 countries)
205 186
e)
189 410
e)
179 624
e)
173 023
e)
169 671
e)
163 963
e)
Belgium
: : 133 6 245 5 963 5 752
Bulgaria
630 546 327 345 297 247
Czech Republic
2 613 2 309 1 449 1 410 1 050 675
Denmark
4 280 3 852 3 860 3 733 3 563 3 652
Estonia
424 399 265 209 121 134
Ireland
: : : : : :
Greece
: : : : 12 15
Spain
21 410
e)
19 988 18 744 17 593 16 610 15 190
France
40 893 36 662 34 548 34 175 31 061 30 201
Italy
55 479 52 409 48 690 46 764 41 608 46 005
Cyprus
286
e)
173 128 166 124 37
Latvia
218 180 92 85 87 102
Lithuania
605 572 293 226 178 188
Luxembourg
279 294 280 262 242 239
Hungary
2 002 1 945 2 027 1 780 1 485 1 358
Malta
: : : : : :
Netherlands
11 493
e)
7 067 11 493 : 8 620 1 919
Austria
9 463 9 880 8 485 8 266 8 379 7 895
Poland
7 056 6 117 5 186 4 748 4 414 4 558
Portugal
1 773
e)
1 862 1 429 1 519 1 392 1 387
Romania
3 652 2 728 1 728 1 492 905 1 054
Slovenia
785 687 657 614 673 557
Slovakia
777 894 611 532 403 479
Finland
2 076 1 834 1 642 1 693 1 601 1 629
Sweden
2 169 1 989 2 055 1 807 1 776 1 677
United Kingdom
18 551
e)
15 903 14 456 13 224 12 454 11 802
: not available
e) estimated
Table 1. Environmental protection expenditure in European Union, million euro (Eurostat
Data Navigation Tree)
Environmental Management in Practice
24
Fig. 1. The structure of environmental expenditure in 25 European Union countries in 2007
(Eurostat Data Navigation Tree)
Fig. 2. Environmental protection expenditure in EU25 as % of GDP in 2002 and 2007 – by
sectors (Eurostat Data Navigation Tree)
Comparing the share of environmental protection expenditures in GDP in particular
countries, it could be noticed, that differences in environmental expenses are huge. Austria
is one of the countries with the highest indicator in European Union (Fig. 3). Moreover, that
expenditure per inhabitant in Austria is very high – in 2007 it was about 820 euro. In other
EU countries this indicator came to 160 – 620 euro per inhabitant (Fig. 4).
Fig. 3. Environmental protection expenditure in selected countries EU as % of GDP, data
from the latest available survey (Eurostat Data Navigation Tree)
Environmental Protection Expenditure in European Union
25
Fig. 4. Environmental protection expenditure in selected countries EU – euro per inhabitant,
data from the latest available survey (Eurostat Data Navigation Tree)
Environmental expenditure, according to Classification of Environmental Protection
Activities (CEPA), are divided into nine environmental domains:
1. Protection of ambient air and climate
2. Wastewater management
3. Waste management
4. Protection and remediation of soil, groundwater and surface water
5. Noise and vibration abatement
6. Biodiversity and landscapes protection
7. Protection against radiation
8. Research and Development
9. Other environmental protection activities (mainly environmental administration and
management, education, training and information, indivisible expenditure and other
expenditure not classified elsewhere).
The business sector consists of:
1. agriculture, hunting, fishing, forestry,
2. industry sector:
- mining and quarrying,
- manufacturing,
- electricity, gas and water supply sector,
3. other business.
However, the environmental protection expenditure occur mainly in the industry sector.
During the period 2002-2007, the manufacturing sector in EU25, spent around 66% of total
environmental protection expenditure, whilst electricity, gas and water supply sector and
mining and quarrying sector 27% and 7% respectively. With reference to current
expenditure this disproportion is bigger – 79%, 18% and 3% respectively (Georgescu, M.A.
& Cabeca J. C., 2010).
In 2007, the leading environmental domain in industry in 25 EU countries was waste
management (25,7%). The other important area of environmental expenditure was the
wastewater management and protection of ambient air and climate, which accounted for
25,7% and 25,4% of total expenditure. The structure of expenditure by the environmental
domains in industry in selected countries in 2007 is shown in Fig. 5.
Environmental Management in Practice
26
0%
20%
40%
60%
80%
100%
Czech
Republic
Spain France Netherlands Poland United
Kingdom
Protection of ambient air and climate Wastewater management
Waste management Non-core domains
Fig. 5. Structure of environmental expenditure in industry of selected countries in 2007
(Eurostat Data Navigation Tree)
Current expenditure for environmental protection in 25 countries of European Union are
higher than investments expenditure. In 2002-2007 current expenditure represented around
81% of total expenditure, whilst investment expenditure – 19% (Fig. 6).
Fig. 6. Investment and current environmental protection expenditure in 25EU in 2002-2007,
in million euro (Eurostat Data Navigation Tree)
2. Investment expenditure
Following the methodology applied in European Union (SERIEE, 1994), the investment
expenditure includes end-of-pipe and integrated investments:
the end-of-pipe investments (pollution treatment) – they do not affect in the production
process itself (the production may be carried out without this kind of investment), but
they reduce and dispose pollutants generated in the production process. The most
Environmental Protection Expenditure in European Union
27
investments in the public sector and in specialised producers – according to the
methodology recommended by the Office of Statistics of the European Communities
EUROSTAT – are entirely rated among end-of-pipe enterprises,
integrated technology (pollution prevention) – they lead to reduction of generated
pollution through the modification of technological processes which makes the
production cleaner and more environmentally friendly. When a new production
process is introduced, the environmental expenditure refer to the expenditure that
outstrip the costs of cheaper and in working order, but less environmentally friendly
equipment.
The share of integrated technology in industry in EU25 exceeded the level of 35% in 2001
and in the year 2006 it increased to 43,0% (Georgescu, M.A. & Cabeca J. C., 2010). In 2007 it
was 39% (Fig. 7). Companies adjust to the requirements of environmental protection by
changing a production technology and implementing the best available productive and
environmental solutions. Further changes in the structure of investment expenditure can be
expected due to the implementation of a directive concerning integrated prevention and
reduction of pollution (a Directive 96/62/EEC on integrated prevention and reduction of
pollution – IPPC). Enforcement of the Directive requires establishing standards of pollution
emission based on a concept of the Best Available Technique – BAT, that guarantees
application of low-waste technologies, economical raw materials and energy use as well as
application of the latest scientific and technical achievements.
Fig. 7. Industry’s environmental protection investments in EU25 in 2002-2007, million euro
(Eurostat Data Navigation Tree)
In the industry sector, the environmental domain, which attracted most of capital
expenditure for both pollution treatment and pollution prevention investments, was
protection of ambient air and climate. The second domain was wastewater management.
This tendency is noticed since 2002 (Fig. 8, Fig. 9).
The public sector and specialized producers sector were dominated by end-of-pipe
investments, what resulted from the specificity of environmental protection activities. Major
expenditure was allocated for building and modernization of wastewater plants, dumping
sites and other waste disposal installations.
Environmental Management in Practice
28
Fig. 8. The structure of industry’s pollution treatment investments in EU25 in 2002-2007 by
the environmental domains (Eurostat Data Navigation Tree)
Fig. 9. The structure of industry’s integrated technlology in EU25 in 2002-2007 by the
environmental domains (Eurostat Data Navigation Tree)
Environmental Protection Expenditure in European Union
29
3. Current environmental expenditure
Total current expenditure is the sum of internal current expenditure and fees/purchases.
Internal current expenditure includes the use of energy, material, maintenance and own
personnel for measures made by the sector to protect the environment. A large part of
internal expenditure is related to operating environmental protection equipment. There are
also other internal expenditure such as general administration, education, information,
environmental management and certification, research and development. Internal current
expenditure includes purchases of connected and adapted non-capital goods
3
such as extra
cost for low sulphur fuels. These are sometimes not part of specific surveys but estimated
based on existing information e.g. on number of units and unit costs.
Fees/Purchases includes all purchases of environmental protection services, both from
public and private producers. These payments are clearly linked with an environmental
protection activity done outside the enterprise and should exclude e.g. fines and penalties.
The payments include:
- Payments to specialised producers (enterprises) for waste and wastewater collection
and treatment and payments to environmental consultants linked e.g. with
environmental management and education.
- Payments to Public sector for waste and wastewater collection and treatment (whatever
the name of the payments – fees, charges etc) as well as permits and surveillance fees.
Subsidies/Transfers (given or received) include all types of transfers financing
Environmental Protection activities in other sectors, including transfers to or from other
countries. These constitute expenditure for the paying sector (public sector), and revenue for
the receiving sector (business sector and specialised producers sector). Payments of general
environmental or green taxes (such as energy taxes) are excluded.
Sometimes Environmental Protection activities produce by-products that have an economic
value. These could either be sold and generate revenues, or be used internally and lead to
reductions in costs. Examples include energy generated or material recovered, as a result of
waste treatment. There should always be a specific Environmental Protection activity (and
expenditure) that these receipts stem from. Receipts from by-products is the sum of the sales
value and the value of the cost-saving (if used internally) related to these by-products.
Public sector and specialised producers receive the payments for environmental protection
services. This is entered as revenues in the respective sector (EPER).
The main environmental domain of current costs in industry sector during the period 2002-
2007 was waste management (about 40%) and wastewater management (about 30%).
Approximately, 10% concern other environmental protection activities, like general
administration, education, information and environmental management – Fig 11.
3
Connected products are products which are used directly and solely for environmental protection (for
example septic tanks, filters, waste bags).
Adapted products are products that are less polluting, at the time of their consumption and/or
scrapping, than equivalent traditional products. In most cases, such products are more costly, and their
production and consumption are usually encouraged by fiscal and other incentives. Products which are
cleaner (and therefore more environmentally friendly) when used or disposed of. These products are
sometimes also called (environmentally) cleaner products. Only the extra-cost is accounted for in the
environmental protection expenditure (Glossary of Environment Statistics, 1997).
Connected products are products which are used directly and solely for environmental protection (for
example septic tanks, filters, waste bags).
Environmental Management in Practice
30
Current expenditure in public and specialized producers sectors was directed largely
towards ensuring a good provision of wastewater treatment and waste management
services (Georgescu, M.A. & Cabeca J. C., 2010).
Internal current expenditure
Related to operating environmental protection equipment
Protection of
ambient air
and climate
Wastewater
management
Waste
management
Protection
and
remediation
of soil,
groundwater
and surface
water
Noise and
vibrations
abatement
Biodiversity
and
landscape
protection
Protection
against
radiation
Research and development
General administration, education, information, environmental management and
certification
(+) plus (-) minus
Fees/purchases
(+) plus or (-) minus
Subsidies/Transfers
(-) minus
Receipts from by-products
= (equals)
Current expenditure
Fig. 10. Classification of current expenditure on the environment in industry sector
Fig. 11. The structure of industry’s current expenditure in EU25 in 2002-2007 by the
environmental domains (Eurostat Data Navigation Tree)
Environmental Protection Expenditure in European Union
31
4. Environmental expenditure in households
Environmental protection expenditure in households contains of 1) purchases of connected
and adapted products and 2) payments and fees for environmental protection services – Fig.
12.
Expenditure (investment and current) - purchases
Protection of
ambient air
and climate
Wastewater
management
Waste
management
Noise and
vibrations
abatement
Biodiversity
and
landscape
protection
Other areas of
environmental
protection
(-) minus
Subsidies
+ (plus)
Payments and fees
collection and treatment of waste
collection and treatment of
wastewater
= (equals)
Environmental protection expenditure
Fig. 12. Classification of households expenditure on the environment
Based on Member Countries experience with the collection of data on private households there
is no need to make a distinction between investments and current expenditure (EPER).
Household purchases are viewed as current, in line with the national accounts. Examples are:
protection of ambient air and climate:
- heat consumption meters and thermo regulators;
- modernization of central heating systems for the entire building and for a single
apartment;
- installation of equipment for the treatment of fuel gases;
- purchase, operation and maintenance of air pollution control devices for motor vehicles
e.g. extra costs for use of more environmentally friendly goods such as unleaded petrol,
or service costs for proper adjustments of engines,
- purchase and installation of energy-saving windows;
- additional insulation for the building protecting against cold;
Environmental Management in Practice
32
wastewater management:
- connection to the public sewer;
- purchase of sewage treatment facilities such as septic tanks,
- construction of individual wastewater treatment plants;
waste management:
- purchase of goods used in connection with waste management such as bins, bags,
composts etc.;
biodiversity and landscape protection:
- tree and bush planting;
- house facade repairs;
noise and vibrations abatement:
- purchase and installation of noise reducing windows;
- fences and live fences, noise and vibrations reducing screens.
Household expenditure for environmental protection includes all payments and fees for
services purchased from municipalities and specialised producers of environmental
protection services. These include mainly:
payments for the collection and treatment of waste,
payments for the collection and treatment of wastewater.
Data of environmental protection expenditures in household is not available in Eurostat.
Only a few EU countries conduct surveys in this sector (e.g. Austria, Hungary, Poland). In
Poland, environmental protection expenditure in private households are examined from
1998. They are the biggest amount of environmental protection expenditures in Polish
economy – during the period 1998-2009 it was approximately the same amount as the sum
of expenditure in three sectors: public, business and specialized producers (Results of
surveys of environmental protection expenditure conducting in 1998-2010. Ministry of the
Environment in Poland).
The surveys are carried out on a representative sample of 1300 Polish households selected
randomly by the Central Statistical Office for the purpose of examinating Polish households
budgets. The survey covered 6 groups selected in accordance with their social and economic
status, namely:
- households of workers – 44,6% of the sample,
- households of farmers with additional source of income – 4,3%,
- households of farmers – 5,7%,
- households of self-employed people – 6,1%,
- households of the retired and pensioners – 35,2%;
- households supported from non-profit sources – 4,1%.
Environmental expenditure of households in 2009 amounted to 5,8 billion euro. The share of
purchases, installations and constructions of appliances as well as connected goods
accounted for 72,6%, while environmental services 27,4%.
Costs of purchase, installation and construction of environmental devices and products
referred mainly to air protection (77,6%), especially purchase and installation of energy-
saving windows, houses heat-insulation and heating installation modernization. The
majority of expenditure concerning bio-diversity and landscape protection was allocated for
renovations of building’s elevations and with regard to protection against noise and
vibrations – purchase and installation of soundproof windows (Fig. 13).
Environmental Protection Expenditure in European Union
33
Among the costs of environmental services, the majority (68,3%) consisted of wastewater
collection, treatment and discharge fees. The rest of 33,7% was constituted of waste
collection charges.
It should be noted, however, that the rates of fees for the environmental services related to
the environmental protection depended on the type of a building. For the purpose of the
survey two main groups were defined: a multi-family apartment house (53% households in
the sample) and a single-family house (43%). Moreover, in the case of 4% households the
delivered information was the total cost of environmental protection products and services
for their house (a single-family house), garage, summer house and bungalow. The average
services fees for different types of buildings are presented in Fig. 14.
Fig. 13. The structure of expenditure for purchasing connected goods to households in 2009
in Poland (Environment 2010. Statistical Information and Elaboration, 2010).
Many owners of single-family houses, mainly in the country, most probably used to discharge
their wastewater directly on the farmland and the most popular way of waste disposal was
burning them or taking it to an unauthorized dumping ground to avoid the costs of utilization.
The amount of charges for the environmental protection services was unrelated to the social
and economic status of the members of the household. However, the highest expenditure on
the purchase and installation of the equipment and products used directly for the purpose
of environmental protection was recorded in households of self-employed people
(excluding farmers) – 397 euro in 2009, whereas the lowest – 38 euro in households
supported from nonprofit sources. The average expenditure on the environment (services
payments excluded) by source of income is presented in Fig. 15.
Environmental Management in Practice
34
Fig. 14. Cost of environmental protection services for different types of building in Poland in
2009 (in euro).
Fig. 15. The amount of expenditure on the purchase and installation of the equipment and
products used directly for the purpose of environmental protection by source of income in
all surveyed Polish households in 2009 (in euro).
Environmental Protection Expenditure in European Union
35
5. Conclusion
Eurostat works towards systematically collecting environmental statistics for all economic
sectors within the EU. These statistics are used to assess the effectiveness of new legislation
and policies and to analyse the links between environmental pressures and the structure of
the economy.
For many years, European statistical services have collected data on air pollution, energy,
water consumption, wastewater, solid waste, and their management. The links between
these data and environmental data of an economic nature, such as environmental
expenditure enable policymakers to consider the environmental impacts of economic
activities, for example on resource consumption, air or water pollution, and waste
production, and to assess actions (such as investment and current expenditure) that may be
carried out to limit the causes and risks of pollution.
The analysis of spending on environmental protection has a strategic interest and allows an
evaluation of environmental policies already in place. A low level of expenditure does not
necessarily mean that a country is not effectively protecting its environment. Indeed,
information on expenditure tends to emphasise clean-up costs at the expense of cost
reductions which may have resulted from lower emissions or more effective protection
measures (Georgescu, M.A. & Cabeca J. C., 2010).
6. References
Broniewicz, E. (2001). Expenditure on the Environment by Polish Households in the
Year 2000, Economics and Environment, ed. by Poskrobko, B., pp. 117-132,
Foundation of Environmental and Resource Economists, ISSN 0867-8898,
Bialystok, Poland
Broniewicz, E. (2004). Environmental protection expenditure in Poland in comparison with
European Union countries, Proceedings of Business strategy and the environment, pp.
58-66, Leeds, UK, September 2004
CEPA 2000 – Classification of Environmental Protection Activities and Expenditure
Commission Recommendation of 30 May 2001 on the recognition, measurement and
disclosure of environmental issues in the annual accounts and annual reports of
companies (2001/453/EC). Official Journal of the European Communities
Council Regulation No 58/97 of 20.12.1996 concerning structural business statistics
Environment 2010. Statistical Information and Elaboration (2010). Central Statistical Office, ISSN
0867-3217, Poland, 01-15.03.2011. Available from
EPER – Environmental Protection Expenditure And Revenues. Joint OECD/Eurostat
Questionnaire, 2002-2010
Eurostat Data Navigation Tree, 02.01-20.03.2011. Available from
Georgescu, M.A. & Cabeca J. C. (2010). Environmental Protection Expenditure and
Revenues in the EU, EFTA and candidate countries 2001-2006, In: Eurostat. Statistics
in Focus, 31/2010, 12.01.2011. Available from
Glossary of Environment Statistics (1997). Studies in Methods, Series F, No. 67, United
Nations, New York, 10.03.2011. Available from
Environmental Management in Practice
36
Regulation NO 2056/2002 of 5 November 2002 amending Council Regulation NO58/97
concerning Structural Business Statistics
Results of surveys of environmental protection expenditure conducting in 1998-2010.
Ministry of the Environment in Poland
SERIEE – European System for the Collection of Economic Information on the Environment,
Manual, Luxemburg 1994
3
Community Ecology and Capacity: Advancing
Environmental Communication Strategies
among Diverse Stakeholders
Rosemary M. Caron, Michael E. Rezaee and Danielle Dionne
University of New Hampshire
United States
1. Introduction
Many socioeconomically and geographically diverse communities in the United States have
been challenged by occurrences of environmental contamination and the related complex
public health issues. The investigations associated with such concerns have traditionally
been the responsibility of governmental agencies. Communities facing potential
environmental exposures often believe that government-based environmental agencies are
not adequately addressing their concerns regarding risk, thus resulting in their
misunderstanding and distrust of the regulatory process. A schism develops whereby the
community perceives that government is either not doing enough to address their concerns
and/or are being influenced by the relevant industry. The governmental agencies involved
perceive that the community possesses an inaccurate or irrational perception of the potential
risks. As a result, a stressful relationship often arises.
Recommendations for effective risk communication have been developed and published
(Covello & Sandman, 2001; Hance et al., 1989; Sandman, 1989). Research has also
demonstrated the importance of developing relationships among stakeholders and its
impact on information delivery and reception (ATSDR, 2004). Given that stakeholder
groups perceive risk differently, it is imperative for each group to appreciate the viewpoints
of all involved to engage in effective dialog (Park et al., 2001; Tinker et al., 2001).
Cox (2006) defines environmental communication as “…the pragmatic and constitutive
vehicle for our understanding of the environment as well as our relationships to the natural
world; it is the symbolic medium that we use in constructing environmental problems and
negotiating society’s different responses to them.” Although opportunities for public
participation in environmental assessments have greatly increased, the environmental
communication process among key stakeholders needs further evaluation (Charnley &
Engelbert, 2005; McKinney & Harmon, 2002). The purpose of this chapter is to describe an
evaluative process to develop and propose recommendations that could improve the
environmental communication that occurs among diverse stakeholders, such as an
environmental regulation and protection agency, waste disposal and energy producing
facilities, community activists and the general public. Two case studies will be presented;
the first describes the management of environmental permitting decisions in several
disparate communities; and the second describes the management and perception of health
risks from a single-owner waste-to-energy facility in two distinct communities. To
Environmental Management in Practice
38
accomplish this goal, this chapter will: 1.) examine how a state environmental agency and
waste disposal and energy producing facilities describe their environmental communication
experiences regarding various permitting operations and the risk perceptions of the
impacted communities; 2.) identify effective communication methods; 3.) discuss the
strengths and limitations of these activities; and 4.) propose recommendations for
practitioners to advance environmental communication strategies among these key
stakeholders.
1.1 Community ecology and capacity
Communities are important determinants in environmental health-related problems for
populations. A community’s ecology (i.e., its social, cultural, economic, and political
composition) can affect how a persistent and/or perceived environmental health problem is
addressed. For example, the primary stakeholders in a refugee resettlement community’s
childhood lead poisoning problem include the residents/resettled refugees in poor quality
housing, refugee resettlement agencies, social service agencies, the local city health
department, housing agencies, city building inspectors, realtors, property
owners/managers, child care providers, health care community, etc. Some stakeholders
view the childhood lead poisoning problem in the community as indicative of a larger issue,
namely a community that is undergoing growth and diversification due to its refugee and
immigrant resettlement status. Hence, others believe they are not able to solve the problem
due to its enormity and complexity. As a result, this persistent environmental public health
issue propagates in the community with varied efforts (Caron & Serrell, 2009; Wehrly, 2006).
Childhood lead poisoning has been described as a wicked persistent environmental public
health problem that is multi-factorial in nature and possesses no clear resolution due to the
involvement of numerous stakeholders who define the problem differently and who pose
uncoordinated solutions. Since wicked problems often possess no definitive solutions,
remediation must focus on how to best manage them (Caron & Serrell, 2009). As part of a
management practice for complex environmental public health issues, we propose that the
community’s ecology – its political, ethnic and socioeconomic factors, including zoning
laws, housing policies, cultural behavior, and language barriers - is a key determinant in
shaping a population’s perception of risk and in developing effective communication
strategies. In addition, understanding a community’s ecology can contribute to building the
community’s capacity to affect the local management and communication of persistent
and/or perceived environmental public health issues.
2. Case study: managing environmental permitting decisions in dissimilar
communities
The stakeholders considered in this work include a state environmental agency, facility
managers of Title V operating facilities and community residents living near the facilities.
Specifically, the New Hampshire Department of Environmental Services, Air Resources
Division (NHDES ARD) is responsible for monitoring and regulating air quality that is
protective of public health and the natural environment in the State of New Hampshire
(ARD, 2010). NHDES ARD accomplishes this goal via numerous programs including a
statewide permitting program to assure compliance with the Title V federal mandate. The
purpose of the Title V permitting process is to ensure that facilities will not emit hazardous
pollutants to a degree which could negatively affect human health. Specifically, the Title V
mandate states that facilities which emit over 100 tons of any regulated pollutant, such as
Community Ecology and Capacity: Advancing
Environmental Communication Strategies among Diverse Stakeholders
39
carbon monoxide and sulfur oxides; or emit over 50 tons of nitrous oxides; or emit 10 tons of
any of the federally regulated hazardous air pollutants need to apply to the state
environmental agency for a Title V permit (ARD, 2008).
Table 1 outlines the Title V operating facilities examined in this study: Turnkey Recycling
and Environmental Enterprises, a solid waste management facility in operation since 1979 in
Rochester, New Hampshire (NH); Mt. Carberry Landfill, historically used as a landfill for
pulp and paper byproducts and a solid waste disposal site since 1989 in Berlin, NH; Four
Hills Landfill, a solid waste disposal site since 1970 in Nashua, NH; Indeck Energy Services,
Inc., a biomass electric generating facility in operation since 1987 in Alexandria, NH; Schiller
Station, historically a coal burning facility from 1950 through 2006 and now a woodchip
burning operation in Portsmouth, NH; and Wheelabrator Technologies, Inc., a solid waste
energy plant in operation since 1987 in Claremont, NH.
Facility Name Type of Industry In Operation Since
Location
Population of
Community
1
Turnkey Recycling
and Environmental
Enterprises
Landfill 1979 Rochester, NH 30,527
Mt. Carberry Landfill 1989 Berlin, NH 10,109
Four Hills Landfill 1970 Nashua, NH 86,837
Indeck Energy
Services, Inc.
Electricity 1987 Alexandria, NH 1,521
Schiller Station Electricity 1950 Portsmouth, NH 20,495
Wheelabrator
Technologies, Inc.
Incinerator 1987 Claremont, NH 13,097
Table 1. Facility stakeholders involved in the environmental communication of permitting
decisions.
The community members living in the midst of these Title V operating facilities represent
the final stakeholder group. The demographics of these communities are diverse with three
communities considered rural and the remaining considered urban.
3. Methods
Data collection and analysis of the interactions among key stakeholders were conducted
using collective case study methodology (Cottrell & McKenzie, 2005). Data was collected
from publicly available New Hampshire Department of Environmental Services (NHDES)
documents concerning specific Title V operating facilities in the State of New Hampshire.
These documents were in the form of written or e-mail correspondence, phone logs and
1
U.S. Census Bureau. Population Finder. (
Environmental Management in Practice
40
public hearing audio tapes and written testimonies. A structured questionnaire was applied
to each occurrence of communication. Each document was reviewed and information
abstracted regarding the date and type of communication; origin of concern; responder;
general summary of concern; action requested; response time; total number of complaints
per facility; method of ongoing communication; whether feelings of distrust or doubt were
expressed by the community with respect to facility operations; the type of organization(s)
the community member contacted prior/following to communicating with the state agency
or facility; and non-verbal communication (e.g., body language) at public hearings.
Abstracted information was first organized in chronological order by facility; duplicate
records were removed; and a search for potentially missed documents was conducted. A
document summarizing record review information for each site was constructed.
Additionally, public inquiries/concerns received about each facility were reviewed and
classified into thematic areas.
Semi-structured interviews were conducted, following Institutional Review Board approval
from the University of New Hampshire, with NHDES employees involved in the Title V
permitting process and Title V operating facility managers. Respondents were asked
questions about the public’s perception of their work and whether the facility’s operations
were considered to be contentious or non-contentious; the health and environmental
concerns of the impacted community; and who they considered the major stakeholders.
Respondents were asked if they had experience conducting and/or attending a public
hearing about their facility. Information pertaining to the type and number of concerns
communicated by the public was collected, as well as how these issues were addressed.
With respect to the environmental management of concerns, the respondents were queried
as to whether or not they believed they were proactive in involving the community and if
there was a professional at their respective organizations who was responsible for handling
the public’s concerns. The last series of questions posed to the respondents inquired about
whether they thought improving environmental communication among all stakeholders
would enhance working relationships; whether an appointed liaison would assist with
environmental communication; and what specific recommendations they have to improve
the communication of environmental permitting decisions among stakeholders.
The interviews were transcribed and a content analysis, using QSR NVivo (a computer-
assisted qualitative data analysis program), was conducted of the structured interview
responses to extract and code recurring themes.
4. Results
4.1 Structured questionnaires
Tables 2A-F summarize the correspondence information among stakeholders regarding
each facility. In general, public inquiries were fielded by NHDES ARD staff and/or the
NHDES Complaint Manager. Inquiries were typically answered in two days or less. The
concerns expressed ranged from health concerns (e.g., cancer, respiratory illness) to
nuisance complaints (e.g., odor, noise, traffic). The actions most often requested involved
scheduling a public hearing, extending the public comment period, conducting air and
water quality testing, and initiating an independent investigation of NHDES’
administration. In some instances, the community members present at the public hearing
called for the closure of the facility. Distrust of NHDES and/or the facility was expressed
for the majority of sites. One exception to this sentiment was the Mt. Carberry Landfill.
Community Ecology and Capacity: Advancing
Environmental Communication Strategies among Diverse Stakeholders
41
Common frustrations voiced by citizens included the inability to locate the appropriate
representative, either at NHDES or the facility, to communicate their concern(s) and
dissatisfaction with the response to their inquiry, thus leading them to contact the
Environmental Protection Agency (EPA) or a local official to relay their concerns. Figures 1-
6 represent photographs of each facility examined.
Turnkey Recycling
and Environmental
Enterprises
Correspondence
Content
Phone E-mail Public Hearing
Written
Time period of
Correspondence
2004, 2005 2003, 2004, 2005
2004 2004
Total Number 59 7 7 7
Responder NHDES
ARD;
NHDES
Complaint
Manager
NHDES ARD;
Title V Program
Manager
NHDES ARD;
Title V
Permitting
Engineer;
Facility
Manager
None
Summary of
Concern
Odor Odor Health
(cancer);
Odor;
Air quality;
Water quality
Health (colitis);
Odor;
Air quality;
Water quality
Response Time Same day Same day Same day Not applicable
Action Requested
None Public hearing Air and water
quality
testing;
Deny permit;
Close facility
Air and water
quality testing;
Deny permit;
Close facility;
Investigate
NHDES
Perception of
Distrust
Yes Yes Yes Yes
Ongoing
Communication
None None None None
Other
Organizations
Contacted
None Director of Waste
Management
Services
None Director of Waste
Management
Services
Table 2A. Correspondence among stakeholders involved in the environmental
communication of permitting decisions for a landfill facility.
Environmental Management in Practice
42
Mt. Carberry
Landfill
Correspondence
Content
Phone E-mail Public Hearing Written
Time period of
Correspondence
2006
No e-mail
correspondence
2007 2007
Total Number 16 1 4
Responder
NHDES
ARD
NHDES ARD and
Facility Manager
NHDES and
Director of
NHDES
Summary of Concern
Odor
None – in support
of facility
Title V permitting
process
Response Time Same day
Same day Two days
Action Requested None
Extension of public
comment period
Public hearing
Perception of Distrust
No No No
Ongoing
Communication
NHDES
Follow-up
None None
Other Organizations
Contacted
No No No
Table 2B. Correspondence among stakeholders involved in the environmental
communication of permitting decisions for a landfill facility.
Fig. 1. Turnkey Recycling and Environmental Enterprises, Rochester, New Hampshire.
Source: />landfill-gas-as-primary-fuel-source/#more-3818
Community Ecology and Capacity: Advancing
Environmental Communication Strategies among Diverse Stakeholders
43
Fig. 2A. Mt. Carberry Landfill, Berlin, NH.
Fig. 2B. Flare at Mt. Carberry Landfill, Berlin,
NH.
Source for both photos:
Fig. 3. Four Hills Landfill in Nashua, NH.
Source: />ste/tabid/135/Default.aspx
Environmental Management in Practice
44
Four Hills
Landfill
Correspondence
Content
Phone E-mail
Public
Hearing
Written
Time period of
Correspondence
2007, 2008, 2009 2008
No public
hearing
No written
correspondence
Total Number 9 1
Responder
NHDES ARD;
NHDES Complaint
Manager
NHDES
Complaint
Manager
Summary of Concern
Odor;
Noise
Odor
Response Time 1-2 days Same day
Action Requested None None
Perception of
Distrust
No No
Ongoing
Communication
None Yes (via e-mail)
Other Organizations
Contacted
EPA; Mayor’s office;
local health
department
No
Table 2C. Correspondence among stakeholders involved in the environmental
communication of permitting decisions for a landfill facility.
Fig. 4. Indeck Energy Services, Inc., Alexandria, NH.
Source:
Community Ecology and Capacity: Advancing
Environmental Communication Strategies among Diverse Stakeholders
45
Indeck
Energy
Services,
Inc.
Correspondence
Content
Phone E-mail Public Hearing Written
Time period of
Correspondence
1986, 1991,
2008, 2009
No e-mail
correspondence
2000, 2007 1986, 1999, 2007
Total Number 5 21 7
Responder
NHDES
Complaint
Manager
NHDES ARD and
Facility Manager
NHDES ARD and
NHDES Director
Summary of
Concern
Air quality;
Noise
Air quality, In
support of permit
for economic
reasons
Odor; Noise; Traffic;
Air quality
Response Time Same day Same day Two days
Action Requested
Air quality
testing
Air quality testing;
more information
on facility
operations
Information on
facility operations
and plans; Request a
public hearing
Perception of
Distrust
Yes Yes Yes
Ongoing
Communication
None None None
Other
Organizations
Contacted
No No No
Table 2D. Correspondence among stakeholders involved in the environmental
communication of permitting decisions for an energy (electricity) facility.