Environmental Management in Practice Part 4 pot
Bạn đang xem bản rút gọn của tài liệu. Xem và tải ngay bản đầy đủ của tài liệu tại đây (4.41 MB, 30 trang )
Regional Issues in Environmental Management
81
for trans-boundary acid deposition and marine pollution mainly fall into a), b), or c)-type of
modalities.
Acid Deposition Monitoring Network in East Asia (EANET)
Starin
g
y
ear: 2001
Area: East Asia: 13 countries
Issues: Acid Depositio
n
Secretariat: UNE
P
Modalit
y
: Joint monitorin
g
and assessment
Northwest Pacific Action Plan (NOWPAP)
Starin
g
y
ear: 199
4
Area: Northeast Asia: China, Japan, Korea (South), and Russia
Issues: Marine Pollutio
n
Secretariat: UNE
P
Modalit
y
: Joint monitorin
g
and assessment
ASEAN A
g
reement on Transboundar
y
Haze Pollutio
n
Staring year: 2002
Area: ASEAN
Issues: Haze Pollution
Secretariat: ASEAN
Modalit
y
: Le
g
al a
g
reement
Tripartite Environmental Ministers Meetin
g
(TEMM)
Starin
g
y
ear: 199
9
Area: China, Japan, and South Korea
Issues: Comprehensive
Secretariat: Rotation
Modalit
y
: Polic
y
dialo
g
ue
North-east Asian Subre
g
ional Pro
g
ramme of Environmental Coo
p
eration
(
NEASPEC
)
Starin
g
y
ear: 1993
Area: Northeast Asia: China, Japan, Korea (North), Korea (South), Mon
g
olia, and Russia
Issues: Comprehensive
Secretariat: UN/ESCAP (Inte rim)
Modalit
y
: Pro
j
ect-based activitie
s
Table 2. Regional frameworks for environmental cooperation
3.3 Discussion on non-binding approach in East Asia
The modality of regional frameworks for environmental cooperation has recently been
discussed in terms of binding and non-binding approaches (e.g. Yoon; 2007, Köppel; 2009).
Yoon (2007) argued that the environmental cooperation in Northeast Asia has evolved
through non-binding agreements which do not contain official commitments on compliance
or legal restrictions for non-compliance, whereas that in Europe has followed binding
agreements by concluding with conventions and working through a series of protocols for
solid compliance. This view is consistent with our comparative analysis on the modalities
for environmental cooperation between in East Asia and Europe in the previous section.
Then, why East Asia has taken the non-binding approach for environmental cooperation is
the question in this section.
Köppel (2009) explained theoretically the advantages of both binding and nonbinding
agreements as follows. A nonbinding agreement is easier and faster to achieve, allows states
to tackle a problem collectively at a time they otherwise might not due to economic or
Environmental Management in Practice
82
political reasons, and enables governments to formulate their commitments in a more
precise and ambitious form than they would be possible in a binding treaty. Seeking deeper
cooperation like a smaller club of “like-minded enthusiasts”, and facilitating learning
processes or learning by doing, can be further benefits of nonbinding agreements. On the
other hand, binding agreements strengthen the credibility of a commitment, increase
compliance with the commitment, and reduce intergovernmental transaction costs.
Considering this theoretical viewpoint, we can interpret East Asian choice of non-binding
approach in such a way that East Asia is getting or trying to get the non-binding advantages
whereas facing the difficulties for getting the binding advantages. In fact, the progress in the
trans-boundary on-going projects under the frameworks of EANET, NOWPAP, NEASPEC,
etc., appears to be reflecting East Asian stances to pursue the “easier”, “faster” and “deeper”
advantages of non-binding approach. On the other hand, the difficulties for binding
approach in East Asia seem to come from the following economical, political and historical
backgrounds. First, a lack of economic and political homogeneity is making it difficult for
East Asia to reach binding agreements. As mentioned in Introduction, East Asian countries
are composed of a variety of countries with different stages of development and with
different political system. In addition, there is no regional organizations equivalent to the
EU in East Asia except for ASEAN. The typical contrast can be shown in the LRTAP
Convention, which was created by homogenous advanced European nations and has well
been maintained by strong links to EU policies and aid programs. Second, the
environmental cooperation in East Asian region is too immature to lead to legal agreements.
It was only after the Rio Earth Summit in 1992 that East Asian countries initiated
environmental cooperation as an official diplomatic issue as shown in Table 2. We can also
see a contrast in monitoring trans-boundary acid deposition: East Asian started its system in
2001 as the EANET, while Europe inaugurated it about thirty years earlier, in 1972. Finally,
more importantly, political sentiments among East Asian nations are placing obstacles on
the road toward binding agreements (see Yoon; 2007). The historical experiences of World
War Two are making East Asian nations suspicious of Japanese initiatives on regional
affairs. And China tends to prefer bilateral cooperation to supranational institutions,
because bilateral negotiations do not place the country in the diplomatically unfavourable
situation of being the main source of regional, trans-boundary pollution. The bilateral
environmental cooperation promoted by Japan through official development assistant
(ODA) may also have attenuated the need for binding agreements at multilateral level.
To sum up, considering the region-specific properties in economical, political, and historical
terms, non-binding approach as regional framework of environmental cooperation may be
an optimal choice for East Asia, in the sense that it provides the “easier”, “faster” and
“deeper” framework regardless of economical, political, and historical constraints.
5. References
Arellano, M. & Bond, S.R. (1991). Some tests of specification of panel data: Monte Carlo
evidence and an application to employment equations. Review of Economic Studies,
Vol.58, No.2, (April 1991), pp. 277–297, ISSN: 00346527
Borghesi, S. (1999). The Environmental Kuznets Curve: a survey of the literature. FEEM
(Fondazione ENi Enrico Mattei) Working Paper, No. 85–99
Regional Issues in Environmental Management
83
Dasgupta, S.; Laplante, B.; Wang, H. & Wheeler, D. (2002). Confronting the Environmental
Kuznets Curve. Journal of Economic Perspectives, Vol.16, No.1, (Winter 2002), pp. 147-
168, ISSN 08953309
De Bruyn, S.M.; Van den Bergh, J.C.J.M. & Opschoor, J.B. (1998). Economic Growth and
Emissions: Reconsidering the Empirical Basis of 166 Journal of Economic
Perspectives Environmental Kuznets Curves. Ecological Economics, Vol.25, No.2,
(May 1998), pp. 161-175, ISSN 09218009
Grossman, G. & Krueger, A. (1993). Environmental Impacts of the North American Free
Trade Agreement, In: The U.S Mexico Free Trade Agreement, P. Garber, (Ed.), 13-56,
MIT Press, ISBN 0-262-07152-5, Cambridge
Grossman, G. & Krueger, A. (1995). Economic Growth and the Environment. Quarterly
Journal of Economics, Vol.112, No.2, (May 1995), pp. 353–377, ISSN 00335533
Halkos, G.E. (2003). Environmental Kuznets Curve for sulfur: evidence using GMM
estimation and random coefficient panel data models. Environment and Development
Economics, Vol.8, No.4, (October 2003), pp. 581-601, ISSN 1355770X
Institute for Global Environmental Strategies (IGES) (2001). Regional/Subregional
Environmental Cooperation in Asia, IGES, Japan
Kawai, M. (2009). International exchange and monetary system in East Asia. Financial
Review, Vol.93, No.1, (March 2009), pp. 176-194, ISBN 978-4-9904174-4-4 (Japanese)
Köppel, M. (2009). Explaining the Effectiveness of Binding and Nonbinding Agreements:
Tentative Lessons from Transboundary Water Pollution. Paper prepared for the 2009
Amsterdam Conference on the Human Dimensions of Global Environmental Change, 2-4
Dec 2009, Available from
Panayotou, T. (1997). Demystifying the Environmental Kuznets Curve: Turning a Black Box
into a Policy Tool. Environment and Development Economics, Vol.2, No.4, (October
1997), pp. 465-484, ISSN 1355770X
Nahman, A. & Antrobus, G. (2005). The Environmental Kuznets Curve: A Literature Survey.
South African Journal of Economics, Vol.73, No.1, (March 2005), pp.105–120, ISSN
00382280
Selden, T.M. & Song, D. (1994). Environmental Quality and Development: Is There a
Kuznets Curve for Air Pollution Emissions? Journal of Environmental Economics and
Management, Vol. 27, No.2, (September 1994), pp. 147-162, ISSN 00950696
Shafik, N. (1994). Economic Development and Environmental Quality: An Econometric
Analysis. Oxford Economic Papers, Vol.46, (Supplement, October 1994), pp. 757-773,
ISSN 00307653
Takahashi, W. (2003). Historical Development of Regional Cooperative Framworks on
Environment of Europe. Paper Series of Utsunomiya University, No.17, (March
2003), pp.13-31, (Japanese)
Taguchi, H. & Murofushi, H. (2009). Environmental Latecomer’s Effects in Developing
Countries – The Case of SO2 and CO2 Emissions. Journal of Developing Areas, Vol.44,
No.2, (Spring 2011), pp. 143-164, ISSN 0022-037X
UNEP (2010). Air Pollution : promoting regional cooperation, UNEP, ISBN 978-92-807-3093-7
Yaguchi, Y. ; Sonobe, T. & Otsuka, K. (2007). Beyond the Environmental Kuznets Curve: A
Comparative Study of SO2 and CO2 Emissions Between Japan and China.
Environmental Management in Practice
84
Environment and Development Economics, Vol.12, No.3, (June 2007), pp. 445-470, ISSN
1355770X
Yoon, E. (2007). Cooperation for Transboundary Pollution in Northeast Asia: Non-binding
Agreements and Regional Countries’ Policy Interests. Pacific Focus, Vol. XXII, No. 2
(Fall 2007), pp. 77-112, ISSN 1976-5118
5
Geo-environmental Terrain Assessments
Based on Remote Sensing Tools: A Review of
Applications to Hazard Mapping and Control
Paulo Cesar Fernandes
1
da Silva and John Canning Cripps
2
1
Geological Institute - São Paulo State Secretariat of Environment,
2
Department of Civil and Structural Engineering,
University of Sheffield,
1
Brazil
2
United Kingdom
1. Introduction
The responses of public authorities to natural or induced geological hazards, such as land
instability and flooding, vary according to different factors including frequency of
occurrence, severity of damage, magnitude of hazardous processes, awareness,
predictability, political willingness and availability of financial and technological resources.
The responses will also depend upon whether the hazard is 1) known to be already present
thus giving rise to risk situations involving people and/or economic loss; or 2) there is a
latent or potential hazard that is not yet present so that development and land uses need to
be controlled in order to avoid creating risk situations. In this regard, geo-environmental
management can take the form of either planning responses and mid- to long-term public
policy based territorial zoning tools, or immediate interventions that may involve a number
of approaches including preventative and mitigation works, civil defence actions such as
hazard warnings, community preparedness, and implementation of contingency and
emergency programmes.
In most of cases, regional- and local-scale terrain assessments and classification
accompanied by susceptibility and/or hazard maps delineating potential problem areas will
be used as practical instruments in efforts to tackle problems and their consequences. In
terms of planning, such assessments usually provide advice about the types of development
that would be acceptable in certain areas but should be precluded in others. Standards for
new construction and the upgrading of existing buildings may also be implemented
through legally enforceable building codes based on the risks associated with the particular
terrain assessment or classification.
The response of public authorities also varies depending upon the information available to
make decisions. In some areas sufficient geological information and knowledge about the
causes of a hazard may be available to enable an area likely to be susceptible to hazardous
processes to be predicted with reasonable certainty. In other places a lack of suitable data
may result in considerable uncertainty.
Environmental Management in Practice
86
In this chapter, a number of case studies are presented to demonstrate the methodological as
well as the predictive and preventative aspects of geo-environmental management, with a
particular view to regional- and semi-detailed scale, satellite image based terrain
classification. If available, information on the geology, geomorphology, covering material
characteristics and land uses may be used with remotely sensed data to enhance these
terrain classification outputs. In addition, examples provided in this chapter demonstrate
the identification and delineation of zones or terrain units in terms of the likelihood and
consequences of land instability and flooding hazards in different situations. Further
applications of these methods include the ranking of abandoned and/or derelict mined sites
and other despoiled areas in support of land reclamation and socio-economic regeneration
policies.
The discussion extends into policy formulation, implementation of environmental
management strategies and enforcement regulations.
2. Use of remote densing tools for terrain assessments and territorial zoning
Engineering and geo-environmental terrain assessments began to play an important role in
the planning process as a consequence of changing demands for larger urban areas and
related infra-structure, especially housing, industrial development and the services network.
In this regard, the inadequacy of conventional agriculturally-orientated land mapping
methods prompted the development of terrain classification systems completely based on
the properties and characteristics of the land that provide data useful to engineers and
urban planners. Such schemes were then adopted and widely used to provide territorial
zoning for general and specific purposes.
The process of dividing a country or region into area parcels or zones, is generally called
land or terrain classification. Such a scheme is illustrated in Table 1. The zones should
possess a certain homogeneity of characteristics, properties, and in some cases, conditions
and expected behaviour in response to human activities. What is meant by homogeneous
will depend on the purpose of the exercise, but generally each zone will contain a mixture of
environmental elements such as rocks, soils, relief, vegetation, and other features. The
feasibility and practicability of delineating land areas with similar attributes have been
demonstrated throughout the world over a long period of time (e.g. Bowman, 1911; Bourne,
1931; Christian, 1958; Mabbutt, 1968; amongst others), and encompass a wide range of
specialisms such as earth, biological and agricultural sciences; hydrology and water
resources management; military activities; urban and rural planning; civil engineering;
nature and wildlife conservation; and even archaeology.
According to Cendrero et al. (1979) and Bennett and Doyle (1997), there are two main
approaches to geo-environmental terrain assessments and territorial zoning, as follows. 1)
The analytical or parametric approach deals with environmental features or components
individually. The terrain units usually result from the intersection or cartographic
summation of several layers of information [thus expressing the probability limits of
findings] and their extent may not corresponding directly with ground features. Examples
of the parametric approach for urban planning, hazard mapping and engineering purposes
are given by Kiefer (1967), Porcher & Guillope (1979), Alonso Herrero et al. (1990), and Dai
et al. (2001). 2) In the synthetic approach, also termed integrated, landscape or
physiographic approach, the form and spatial distribution of ground features are analysed
in an integrated manner relating recurrent landscape patterns expressed by an interaction of
Geo-environmental Terrain Assessments Based on Remote
Sensing Tools: A Review of Applications to Hazard Mapping and Control
87
Terrain unit Definition Soil unit Vegetation
unit
Mapping scale
(approx.)
Remote sensing
platform
Land zone Major climatic region Order - < 1:50,000,000
Land division Gross continental
structure
Suborder Plant
panformation
Ecological
zone
1:20,000,000
to
1:50,000,000
Meteorological
satellites
Land province Second-order structure
or large lithological
association
Great group - 1:20,000,000
to
1:50,000,000
Land region Lithological unit or
association having
undergone comparable
geomorphic evolution
Subgroup Sub-province
1:1,000,000
to
1:5,000,000
Landsat
SPOT
ERS
Land system * Recurrent pattern of
genetically linked land
facets
Family Ecological
region
1: 200,000
to
1:1,000,000
Landsat
SPOT, ERS, and
small scale
aerial
photographs
Land catena Major repetitive
component of a land
system
Association Ecological
sector
1:80,000
to
1:200,000
Land facet Reasonably
homogeneous tract of
landscape distinct from
surrounding areas and
containing a practical
grouping of land
elements
Series Sub-
formation;
Ecological
station
1:10,000
to
1: 80,000
Medium scale
aerial
photographs,
Landsat, and
SPOT in some
cases
Land clump A patterned repetition of
two or more land
elements too contrasting
to be a land facet
Complex Sub-
formation;
Ecological
station
1:10,000
to
1: 80,000
Land subfacet Constituent part of a
land facet where the
main formative processes
give material or form
subdivisions
Type - Not mapped
Large-scale
aerial
photographs
Land element Simplest homogeneous
part of the landscape,
indivisible in form
Pedon Ecological
station
element
Table 1. Hierarchical classification of terrain, soil and ecological units [after Mitchell, 1991]
environmental components thus allowing the partitioning of the land into units. Since the
advent of airborne and orbital sensors, the integrated analysis is based in the first instance,
on the interpretation of remotely sensed images and/or aerial photography. In most cases,
the content and spatial boundaries of terrain units would directly correspond with ground
features. Assumptions that units possessing similar recurrent landscape patterns may be
expected to be similar in character are required for valid predictions to be made by
extrapolation from known areas. Thus, terrain classification schemes offer rational means
of correlating known and unknown areas so that the ground conditions and potential uses
Environmental Management in Practice
88
of unknown areas can be reasonably predicted (Finlayson, 1984; Bell, 1993). Examples of the
applications of the landscape or physiographic approach include ones given by Christian &
Stewart (1952, 1968), Vinogradov et al. (1962), Beckett & Webster (1969); Meijerink (1988),
and Miliaresis (2001).
Griffiths and Edwards (2001) refer to Land Surface Evaluation as a procedure of providing
data relevant to the assessment of the sites of proposed engineering work. The sources of
data include remotely sensed data and data acquired by the mapping of geomorphological
features. Although originally viewed as a process usually undertaken at the reconnaissance
or feasibility stages of projects, the authors point out its utility at the constructional and
post-construction stages of certain projects and also that it is commonly applied during the
planning of engineering development. They also explain that although more reliance on this
methodology for deriving the conceptual or predictive ground model on which engineering
design and construction are based, was anticipated in the early 1980s, in fact the use of the
methods has been more limited.
Geo-environmental terrain assessments and territorial zoning generally involve three main
stages (IG/SMA 2003; Fernandes da Silva et al. 2005b, 2010): 1) delimitation of terrain units;
2) characterisation of units (e.g. in bio-geographical, engineering geological or geotechnical
terms); and 3) evaluation and classification of units. The delimitation stage consists of
dividing the territory into zones according to a set of pre-determined physical and
environmental characteristics and properties. Regions, zones or units are regarded as
distinguishable entities depending upon their internal homogeneity or the internal
interrelationships of their parts. The characterisation stage consists of attributing
appropriate properties and characteristics to terrain components. Such properties and
characterisitics are designed to reflect the ground conditions relevant to the particular
application. The characterisation of the units can be achieved either directly or indirectly,
for instance by means of: (a) ground observations and measurements, including in-situ tests
(e.g. boring, sampling, infiltration tests etc); (b) laboratory tests (e.g. grain size, strength,
porosity, permeability etc); (c) inferences derived from existing correlations between
relevant parameters and other data such as those obtained from previous mapping, remote
sensing, geophysical surveys and geochemical records. The final stage (evaluation and
classification) consists of evaluating and classifying the terrain units in a manner relevant to
the purposes of the particular application (e.g. regional planning, transportation, hazard
mapping). This is based on the analysis and interpretation of properties and characteristics
of terrain - identified as relevant - and their potential effects in terms of ground behaviour,
particularly in response to human activities.
A key issue to be considered is sourcing suitable data on which to base the characterisation,
as in many cases derivation by standard mapping techniques may not be feasible. The large
size of areas and lack of accessibility, in particular, may pose major technical, operational,
and economic constraints. Furthermore, as indicated by Nedovic-Budic (2000), data
collection and integration into useful databases are liable to be costly and time-consuming
operations. Such problems are particularly prevalent in developing countries in which
suitably trained staff, and scarce organizational resources can inhibit public authorities from
properly benefiting from geo-environmental terrain assessment outputs in planning and
environmental management instruments. In this regard, consideration has been given to
increased reliance on remote sensing tools, particularly satellite imagery. The advantages
include: (a) the generation of new data in areas where existing data are sparse,
discontinuous or non-existent, and (b) the economical coverage of large areas, availability of
a variety of spatial resolutions, relatively frequent and periodic updating of images
Geo-environmental Terrain Assessments Based on Remote
Sensing Tools: A Review of Applications to Hazard Mapping and Control
89
(Lillesand and Kiefer 2000; Latifovic et al. 2005; Akiwumi and Butler 2008). It has also been
proposed that developing countries should ensure that options for using low-cost
technology, methods and products that fit their specific needs and capabilities are properly
considered (Barton et al. 2002, Câmara and Fonseca 2007). Some examples are provided here
to demonstrate the feasibility of a low-cost technique based on the analysis of texture of
satellite imagery that can be used for delimitation of terrain units. The delimited units may
be further analysed for different purposes such as regional and urban planning, hazard
mapping, and land reclamation.
The physiographic compartmentalisation technique (Vedovello 1993, 2000) utilises the
spatial information contained in images and the principles of convergence of evidence (see
Sabins 1987) in a systematic deductive process of image interpretation. The technique
evolved from engineering applications of the synthetic land classification approach (e.g.
Grant, 1968, 1974, 1975; TRRL 1978), by incorporating and advancing the logic and
procedures of geological-geomorphological photo-interpretation (see Guy 1966, Howard
1967, Soares and Fiori 1976), which were then converted to monoscopic imagery (as
elucidated by Beaumont and Beaven 1977; Verstappen 1977; Soares et al. 1981; Beaumont,
1985; and others). Image interpretation is performed by identifying and delineating textural
zones on images according to properties that take into account coarseness, roughness,
direction and regularity of texture elements (Table 2). The key assumption proposed by
Vedovello (1993, 2000) is that zones with relatively homogeneous textural characteristics in
satellite images (or air-photos) correspond with specific combinations of geo-environmental
components (such as bedrock, topography and landforms, soils and covering materials)
which share a common tectonic history and land surface evolution. The particular
combinations of geo-environmental components are expected to be associated with specific
ground responses to engineering and other land-use actions. The process of image
interpretation (whether or not supported by additional information) leads to a cartographic
product in which textural zones constitute comprehensive terrain units delimited by fixed
spatial boundaries. The latter correspond with ground features. The units are referred to as
physiographic compartments or basic compartmentalisation units (BCUs), which are the
smallest units for analysis of geo-environmental components at the chosen cartographic
scale (Vedovello and Mattos 1998). The spatial resolution of the satellite image or air-photos
being used for the analysis and interpretation is assumed to govern the correlation between
image texture and terrain characteristics. This correlation is expressed at different scales and
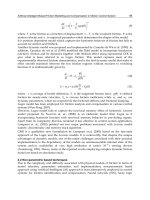
levels of compartmentalisation. Figure 1 presents an example of the identification of basic
compartmentalisation units (BCUs) based on textural differences on Landsat TM5 images. In
this case the features on images are expressions of differences in the distribution and spatial
organisation of textural elements related to drainage network and relief. The example shows
the contrast between drainage networks of areas consisting of crystalline rocks with those
formed on areas of sedimentary rocks, and the resulting BCUs.
3. Terrain susceptibility maps: applications to regional and urban planning
Terrain susceptibility maps are designed to depict ground characteristics (e.g. slope
steepness, landforms) and observed and potential geodynamic phenomena, such as erosion,
instability and flooding, which may entail hazard and potential damage. These maps are
useful for a number of applications including development and land use planning,
environmental protection, watershed management as well as in initial stages of hazard
mapping applications.
Environmental Management in Practice
90
Textural
entities and
properties
Description
Image
texture
element
The smallest continuous and uniform surface liable to be distinguishable in
terms of shape and dimensions, and likely to be repetitive throughout an
image. Usual types of image texture elements taken for analysis include:
segments of drainage or relief (e.g. crestlines, slope breaks) and grey tones.
Texture
density
The quantity of textural elements occurring within an area on image. Texture
density is defined as the inverse of the mean distance between texture
elements. Although it reflects a quantitative property, textural density is
frequently described in qualitative and relative terms such as high, moderate,
low etc. Size of texture elements combined with texture density determine
features such as coarseness and roughness.
Textural
arrangement
The form (ordered or not) by which textural elements occur and are spatiall
y
distributed on an ima
g
e. Texture elements of similar characteristics
may be contiguous thus defining alignments or linear features on the image.
The spatial distribution may be repetitive and it is usually expressed by ‘patterns’
that tend to be recurrent (regularity). For example, forms defined by texture
elements due to drainage expressed in rectangular, dendritic, or radial patterns.
Structuring
(Degree of
spatial
organisation)
The greater or lesser organisation underlying the spatial distribution of textural
elements and defined by repetition of texture elements within a certain rule of
placement. Such organisation is usually expressed in terms of regular or
systematic spatial relations, such as length, angularit
y
, as
y
mmetr
y
, and especiall
y
prevailing orientations (tropy or directionality).
Tropy reflects the anisotropic (existence of one, two, or three preferred
directions), or the isotropic (multi-directional or no predominant direction)
character of
textural features. Asymmetry refers to length and angularity of linear features
(rows of contiguous texture elements) in relation to a main feature identified on
ima
g
e. The de
g
ree of or
g
anisation can also be expressed b
y
qualitative terms such
as high, moderate, low, or yet as well- or poorly-defined.
Structuring
order
Complexity in the organisation of textural elements, mainly reflecting
superposition of ima
g
e structurin
g
. For example, a re
g
ional directional trend of
textural elements that can be extremely pervasive, distinctive and
superimposed on other orientations also observed on imagery. Another
example is drainage networks that display different orders with respect to
main stream lines and tributaries (1st, 2nd, 3rd orders)
Table 2. Description of elements and properties used for recognition and delineation of
distinctive textural zones on satellite imagery [after Vedovello 1993, 2000].
Early multipurpose and comprehensive terrain susceptibility maps include examples by
Dearman & Matula, (1977), Matula (1979), and Matula & Letko (1980). These authors
described the application of engineering geology zoning methods to the urban planning
process in the former Republic of Czechoslovakia. The studies in this and other countries
focused on engineering geology problems related to geomorphology and geodynamic
processes, seismicity, hydrogeology, and foundation conditions.
Geo-environmental Terrain Assessments Based on Remote
Sensing Tools: A Review of Applications to Hazard Mapping and Control
91
Culshaw and Price (2011) point out that in the UK, a major initiative on urban geology
began in the mid-1970s with obtaining geological information relevant to aggregates and
other industrial minerals together with investigations relating to the planning of the
proposed 3rd London Airport. In the latter case, a very wide range of map types was
produced, including one that could be viewed in 3D, using green and red anaglyph
spectacles. Of particular interest was the summary ‘‘Engineering Planning Map which
showed areas that were generally suitable for different types of construction and, also,
detailed suggested site investigation procedures (Culshaw and Northmore 2002).
As Griffiths and Hearn (2001) explain, subsequently about 50 experimental ‘environmental
geological mapping, ‘thematic’geological mapping’ and ‘applied geological mapping’
projects were carried out between 1980 and 1996. Culshaw and Price (2011) explain that
this was to investigate the best means of collecting, collating, interpreting and presenting
geological data that would be of direct applicability in land-use planning (Brook and Marker
1987). Maps of a variety of geological and terrain types, including industrially despoiled and
potentially unstable areas, with mapping at scales between 1:2500 and 1:25000 were
produced. The derivation and potential applications of these sets of maps and reports are
described by Culshaw et al. (1990) who explain that they include basic data maps, derived
maps and environmental potential maps. Typically such thematic map reports comprise a
series of maps showing the bedrock and superficial geology, thickness of superficial
deposits, groundwater conditions and areas of mining, fill, compressible, or other forms of
potentially unstable ground. Maps showing factual information include the positions of
boreholes or the positions of known mine workings. Derived maps include areas in which
geological and / or environmental information has been deduced, and therefore is subject to
some uncertainty. The thematic sets include planning advice maps showing the constraints
on, and potential for, development and mineral extraction. Culshaw et al. (1990) also
explained that these thematic maps were intended to assist with the formulation of both
local (town or city), regional (metropolis or county) structure plans and policies, provide a
context for the consideration of development proposals and facilitate access to relevant
geological data by engineers and geologists. It was also recognised that these is a need for
national (or state) policies and planning to be properly informed about geological
conditions, not least to provide a sound basis for planning legislation and the issuing of
advice and circulars. Examples of such advice include planning guidance notes concerning
the granting of planning permission for development on potentially unstable land which
were published (DOE, 1990, 1995) by the UK government. A further series of reports which
were intended to assist planners and promote the consideration of geological information in
land-use planning decision making were compiled between 1994 and 1998 by consultants on
behalf of the UK government. Griffiths (2001) provides details of a selection of land
evaluation techniques and relevant case studies. These covered the following themes:
Environmental Geology in Land Use Planning: Advice for planners and developers
(Thompson et al., 1998a)
Environmental Geology in Land Use Planning: A guide to good practice (Thompson et
al., 1998b)
Environmental Geology in Land Use Planning: Emerging issues (Thompson et al.,
1998c)
Environmental Geology in Land Use Planning: Guide to the sources of earth science
information for planning and development (Ellsion and Smith, 1998)
Environmental Management in Practice
92
For an extensive review of world-wide examples of geological data outputs intended to
assist with urban geology interpretation, land-use planning and utilisation and geological
hazard avoidance, reference should be made to Culshaw and Price (2001).
Three examples of terrain susceptibility mapping are briefly described and presented in this
Section. The physiographic compartmentalisation technique for regional terrain evaluation
was explored in these cases, and then terrain units were further characterised in geo-
environmental terms.
Fig. 1. Identification of basic compartmentalisation units (BCUs) based on textural
differences on image. The image for crystalline rocks with rugged topography contrasts
with sedimentary rocks with rolling topography. Top: Drainage network. Mid Row:
Drainage network and delineated BCUs. Bottom: Composite Landsat TM5 image and
delineated BCUs [after Fernandes da Silva et al. 2005b, 2010]
Crystalline rocks +
rugged topography
Sedimentary rocks +
rolling topography
Geo-environmental Terrain Assessments Based on Remote
Sensing Tools: A Review of Applications to Hazard Mapping and Control
93
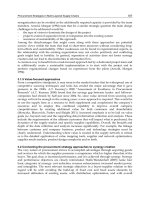
3.1 Multipurpose planning
The first example concerns the production of a geohazard prevention map for the City of
São Sebastião (IG/SMA 1996), where urban and industrial expansion in the mountainous
coastal zone of São Paulo State, Southeast Brazil (Figure 2) led to conflicts in land use as well
as to high risks to life and property. Particular land use conflicts arose from the
combinations of landscape and economic characteristics of the region, in which a large
nature and wildlife park co-exists with popular tourist and leisure encroached bays and
beaches, a busy harbour with major oil storage facilities and associated pipelines that cross
the area. Physiographic compartmentalisation was utilised to provide a regional terrain
classification of the area, and then interpretations were applied in two ways: (i) to provide a
territorial zoning based on terrain susceptibility in order to enable mid- to long-term land
use planning; and (ii) to identify areas for semi-detailed hazard mapping and risk
assessment (Fernandes da Silva et al. 1997a, Vedovello et al., 1997; Cripps et al., 2002).
Figure 2 presents the main stages of the study undertaken in response to regional and urban
planning needs of local authorities.
In the Land Susceptibility Map, the units were qualitatively ranked in terms of ground
evidence and estimated susceptibility to geodynamic processes including gravitational mass
movements, erosion, and flooding.
Criteria for terrain unit classification in relation to erosion and mass movements (landslides,
creep, slab failure, rock fall, block tilt and glide, mud and debris flow) were the following: a)
soil weathering profile (thickness, textural and mineral constituency); b) hillslope profile; c)
slope steepness; and d) bedrock structures (fracturing and discontinuities in general).
Criteria in relation to flooding included: a) type of sediments; b) slope steepness; and c)
hydrography (density and morphology of water courses). The resulting classes of terrain
susceptibility can be summarised as follows:
Low susceptibility: Areas where mass movements are unlikely. Low restrictions to
excavations and man-made cuttings. Some units may not be suitable for deep foundations
or other engineering works due to possible high soil compressibility and presence of
geological structures. In flat areas, such as coastal plains, flooding and river erosion are
unlikely.
Moderate susceptibility: Areas of moderate to high steep slope (10 to 30%) with little evidence
of land instability (small-scale erosional processes may be present) but with potential for
occurrence of mass movements. In lowland areas, reported flooding events were associated
with the main drainage stream in relevant zones. Terrain units would possess moderate
restrictions for land-use with minor engineering solutions and protection measures needed
to reduce or avoid potential risks.
High susceptibility: Areas of moderate (10 to 20%) and high steep slope (20 to 30%) situated in
escarpment and footslope sectors, respectively, with evidence of one or more active land
instability phenomena (e.g. erosion + rock falls + landslide) of moderate magnitude.
Unfavourable zones for construction work wherein engineering projects would require
accurate studies of structural stability, and consequently higher costs. In lowland sectors,
recurrent flooding events were reported at intervals of 5 to 10 yrs, associated with main
drainage streams and tributaries. Most zones then in use required immediate remedial
action including major engineering solutions and protection measures.
Environmental Management in Practice
94
Very high susceptibility: Areas of steeper slopes (> 30%) situated in the escarpment and
footslope sectors that mainly comprised colluvium and talus deposits. There was evidence
of one or more land instability phenomena of significant magnitude requiring full restriction
on construction work. In lowland sectors, widespread and frequent flooding events at
intervals of less than 5 years were reported and most land-used needed to be avoided in
these zones.
Units or areas identified as having a moderate to high susceptibility to geodynamic
phenomena, and potential conflicts in land use, were selected for detailed engineering
geological mapping in a subsequent stage of the study. The outcomes of the further stage of
hazard mapping are described and discussed in Section 4.
Geolo
g
ical
Information
G
eomorphological
a
nd Soil Information
REGIONAL
PHYSI OGRAPHIC
COMPARTMENTALISATION
RS imagery MA P
LAND
SUSCEPTIBILITY
CLASS MAP
RE GION A L
RA IN FALL
EVA LUATI ON
1:5 0.000
1:5 0.000
TIME*SPACE ANALYSIS
INVE NTO RY
1:5 0.0 00
1
:10.000
1
:1 0.0 00
DETAILED SCALE
GEOTECHNICAL CARTOGRAPH
Y
REGIONAL EVALUATION
L
ANDSLIDES
M
ASS MOVEMENTS
SE LE CT E D
A
REAS
L
AND USE MAP
L
ANDSLIDE
E
O
CC UR R EN CE
INVE NTORY
MIN E RA L
EXPL OITA TION
INVEN TORY
HAZARD
M
APPING
1
:10.000
Remotely
sensed data
A) B)
Fig. 2. A) Location map for the City of São Sebastião, north shore of São Paulo State,
Southeast Brazil. B) Schematic flow diagram for the derivation of the geohazard prevention
chart and structural plan (after IG/SMA, 1996).
3.2 Watershed planning and waste disposal
The physiographic compartmentalisation technique was also applied in combination with
GIS tools in support of watershed planning in the Metropolitan District of Campinas,
central-eastern São Paulo State (Figure 3). This regional screening study was performed at
1:50,000 scale to indicate fragilities, restrictions and potentialities of the area for siting waste
disposal facilities (IG/SMA, 1999). A set of common characteristics and properties (also
referred to as attributes) facilitated the assessment of each BCU (or terrain unit) in terms of
Location Map at South America
Brazil
Geo-environmental Terrain Assessments Based on Remote
Sensing Tools: A Review of Applications to Hazard Mapping and Control
95
susceptibility to the occurrence of geodynamic phenomena (soil erosion and land instability)
and the potential for soil and groundwater contamination.
As described by Brollo et al. (2000), the terrain units were mostly derived on the basis of
qualitative and semi-quantitative inferences from satellite and air-photo images in
conjunction with existing information (maps and well logs – digital and papers records) and
field checks. The set of attributes included: (1) bedrock lithology; (2) density of lineaments
(surrogate expression of underlying fractures and terrain discontinuities); (3) angular
relation between rock structures and hillslope; (4) geometry and shape of hillslope (plan
view and profile); (5) soil and covering material: type, thickness, profile; (6) water table
depth; and (7) estimated permeability. These attributes were cross-referenced with other
specific factors, including hydrogeological (groundwater production, number of wells per
unit area), climatic (rainfall, prevailing winds), and socio-political data (land use,
environmental restrictions). These data were considered to be significant in terms of the
selection of potential sites for waste disposal.
Fig. 3. Location map of the Metropolitan District of Campinas (MDC), central-eastern São
Paulo State, Southeast Brazil (see Section 3.2). Detail map depicts Test Areas T1 and T2
within the MDC (see Section 3.3). Scale bar applies to detail map.
Figure 4 displays the study area in detail together with BCUs, and an example of a pop-up
window (text box) containing key attribute information, as follows: 1st row - BCU code
(COC1), 2nd - bedrock lithology, 3rd - relief (landforms), 4th – textural soil profile
constituency, 5th - soil thickness, 6th - water table depth (not show in the example), 7th -
bedrock structures in terms of density of fracturing and directionality), 8th - morphometry
(degree of dissection of terrain). The BCU coding scheme expresses three levels of
0 18 36 km
0 18 36 54 km
Environmental Management in Practice
96
compartmentalisation, as follows: 1st letter – major physiographic or landscape domain,
2nd– predominant bedrock lithology, 3rd - predominant landforms, 4th– differential
characteristics of the unit such as estimated soil profile and underlying structures. Using the
example given in Figure 4, COC1 means: C = crystalline rock basement, O = equigranular
gneiss, C = undulating and rolling hills, 1 = estimated soil profile (3 textural horizons and
thickness of 5 to 10 m), underlying structures (low to moderate degree of fracturing, multi-
directional). In terms of general interpretations for the intended purposes of the study,
certain ground characteristics, such as broad valleys filled with alluvial sediments
potentially indicate the presence water table level at less than 5 m below ground surface.
Flood plains or concave hillside slopes that may indicate convergent surface water flows
leading to potentially high susceptibility to erosion, were considered as restrictive factors for
the siting of waste disposal facilities (Vedovello et al. 1998).
Fig. 4. Basic compartmentalisation units (BCUs) and pop-up window showing key attribute
information relevant to BCUs. See text for details. [Not to scale] [after IG/SMA, 1999]
3.3 Regional development planning
The third example is a territorial zoning exercise, in which terrain units delimited through
physiographic compartmentalisation were further assessed in terms of susceptibility to land
instability processes and groundwater vulnerability (Fernandes da Silva et al. 2005b). The
study was conducted in two test areas situated in the Metropolitan District of Campinas
(Figure 3) in order to assist State of São Paulo authorities in the formulation of regional
development policies. It incorporated procedures for inferring the presence and
characteristics of underlying geological structures, such as fractures and other
discontinuities, then evaluating potential implications to ground stability and the flow of
groundwater.
Geo-environmental Terrain Assessments Based on Remote
Sensing Tools: A Review of Applications to Hazard Mapping and Control
97
Details of image interpretation procedures for the delimitation of BCUs are described by
Fernandes da Silva et al. (2010). The main image properties and image feature characteristics
considered were as follows: (a) density of texture elements related to drainage and relief
lines; (b) spatial arrangement of drainage and relief lines in terms of form and degree of
organisation (direction, regularity and pattern); (c) length of lines and their angular
relationships, (d) linearity of mainstream channel and asymmetry of tributaries, (e) density
of interfluves, (f) hillside length, and (g) slope forms. These factors were mostly derived by
visual interpretation of images, but external ancillary data were also used to assist with the
determination of relief-related characteristics, such as slope forms and interfluve
dimensions. The example given in Figure 1 shows sub-set images (Landsat TM5) and the
basic compartmentalisation units (BCUs) delineated for Test Areas T1 and T2.
Based on the principle that image texture correlates with properties and characteristics of
the imaged target, deductions can be made about geotechnical-engineering aspects of the
terrain (Beaumont and Beaven 1977, Beaumont 1985). The following attributes were firstly
considered in the geo-environmental characterisation of BCUs: (a) bedrock lithology and
respective weathered materials, (b) tectonic discontinuities (generically referred to as
fracturing), (c) soil profile (thickness, texture and mineralogy), (d) slope steepness (as an
expression of local topography), and (e) water table depth (estimated). Terrain attributes
such as degree of fracturing, bedrock lithology and presence and type of weathered
materials were also investigated as indicators of ground properties. For instance, the
mineralogy, grain size and fabric of the bedrock and related weathered materials would
control properties such as shear strength, pore water suction, infiltration capacity and
natural attenuation of contaminants (Vrba and Civita 1994, Hudec 1998, Hill and
Rosenbaum 1998, Thornton et al. 2001, Fernandes 2003). Geological structures, such as faults
and joints within the rock mass, as well as relict structures in saprolitic soils, are also liable
to exert significant influences on shear strength and hydraulic properties of geomaterials
(Aydin 2002, Pine and Harrison 2003). In this particular case study, analysis of lineaments
extracted from satellite images combined with tectonic modelling underpinned inferences
about major and small-scale faults and joints. The approach followed studies by Fernandes
and Rudolph (2001) and Fernandes da Silva et al. (2005b) who asserted that empirical
models of tectonic history, based on outcrop scale palaeostress regime determinations, can
be integrated with lineament analysis to identify areas: i) of greater density and
interconnectivity of fractures; and ii) greater probability of open fractures; also to iii) deduce
angular relationships between rock structures (strike and dip) and between these and hill
slope directions. These procedures facilitated 3-dimensional interpretations and up-scaling
from regional up to semi-detailed assessments which were particularly useful for
assessments of local ground stability and groundwater flow.
The BCUs were then classified into four classes (very high, high, moderate, and low) in
terms of susceptibility to land instability and groundwater vulnerability according to
qualitative and semi-quantitative rules devised from a mixture of empirical knowledge and
statistical approaches. A spreadsheet-based approach that used nominal, interval and
numerical average values assigned in attribute tables was used for this. A two-step
procedure was adopted to produce the required estimates where, at stage one, selected
attributes were analysed and grouped into three score categories (A - high, M - moderate, B
- low B) according to their potential influence on groundwater vulnerability and land
Environmental Management in Practice
98
instability processes. In the second step, all attributes were considered to have the same
relative influence and the final classification for each BCU was the sum of the scores A, B, M.
The possible combinations of these are illustrated in Table 3. Figure 5 shows overall terrain
classifications for susceptibility to land instability.
Combinations of scores Classification
AAAA Very high
AAAM, AAAB, AAMM High
AAMB, AABB, AMMM, AMMB,
MMMM
Medium
AMBB, ABBB, MMMB, MMBB,
MBBB, BBBB
Low
Table 3. Possible combinations of scores “A” (high), “M” (moderate), and “B” (low)
respective to the four attributes (bedrock lithology and weathered materials, fracturing, soil
type, and slope steepness) used for classification of units (BCUs) in terms of susceptibility to
land instability and groundwater vulnerability.
Fig. 5. Maps of susceptibility to land instability processes. Test Areas T1 and T2. UTM
projection and coordinates [After Fernandes da Silva et al., 2010].
Geo-environmental Terrain Assessments Based on Remote
Sensing Tools: A Review of Applications to Hazard Mapping and Control
99
4. Hazard mapping: Land instability and flooding
In order to prevent damage to structures and facilities, disruption to production, injury and
loss of life, public authorities have a responsibility to assess hazard mitigation and controls
that may require remedial engineering work, or emergency and contingency actions. In
order to accommodate these different demands, information about the nature of the hazard,
and the consequences and likelihood of occurrence, are needed. Hazard maps aim to reduce
adverse environmental impacts, prevent disasters, as well as to reconcile conflicting
influences on land use. The examples given in this Section demonstrate the identification
and zonation in terms of the likelihood and consequences of land instability and flooding
hazards. There are several reasons for undertaking such work, for instance to provide public
authorities with data on which to base structural plans and building codes as well as civil
defence and emergency response programmes.
4.1 Application to local structural plans
As indicated in Section 3.1, the BCUs (terrain units) classified as having a moderate to high
susceptibility to geodynamic processes (mass movements and flood) were selected for
further detailed engineering geological mapping. This was to provide data and supporting
information to the structure plan of the City of São Sebastião. The attributes of the selected
units were cross-referenced with other data sets, such as regional rainfall distribution, land-
use inventory, and mineral exploitation records to estimate the magnitude and frequency of
hazards and adverse impacts. Risk assessment was based on the estimated probability of
failure occurrence and the potential damage thus caused (security of life, destruction of
property, disruption of production). Both the triggering and the predisposing factors were
investigated, and, so far as was possible, identified. It is worth noting the great need to
consider socio-economic factors in hazard mapping and risk analysis. For instance, areas of
consolidated housing and building according to construction patterns and reasonable
economic standards were distinguished from areas of unconsolidated/expanding urban
occupation. Temporal analysis of imagery and aerial photos, such as densities of vegetation
and exposed soil in non-built-up areas, were utilised to supplement the land use inventory.
The mineral exploration inventory included the locations of active and abandoned mineral
exploitation sites (quarries and open pit mining for aggregates) and certain geotechnical
conditions. Besides slope steepness and inappropriate occupancy and land use, the presence
of major and minor geological structures was considered to be one of the main predisposing
factors to land instability in the region studied.
Figure 6 depicts a detail of the hazard map for the City of São Sebastião. Zones of land
instability were delimited and identified by code letters that correspond with geodynamic
processes as follows: A - landslides, B - creep, C - block tilt/glide, and D - slab failure/rock
fall. Within these zones, landsliding and other mass movement hazards were further
differentiated according to structural geological predisposing factors as follows:
r – occurrence of major tectonic features such as regional faults or brittle-ductile shear zones;
f – coincidence of spatial orientations between rock foliation, hillslope, and man-made
cuttings; t – high density of fracturing (particularly jointing) in combination with
coincidence of spatial orientations between fracture and foliation planes, hillslope, and man-
made cuttings (Moura-Fujimoto et al., 1996; Fernandes da Silva et al. 1997b).
Environmental Management in Practice
100
Fig. 6. Example of hazard map from the City of São Sebastião, north shore of São Paulo
State, Southeast Brazil. Key for unit classification: Light red = very high susceptibility; Blue
= high susceptibility; Light orange = moderate susceptibility; Yellow = low susceptibility.
See Section 4.1 for code letters on geodynamic processes and predisposing factors. [after
Fernandes da Silva et al. 1997b] (not to scale).
4.2 Application to civil defence and emergency response programmes
Methods of hazard mapping can be grouped into three main approaches: empirical,
probabilistic, and deterministic (Savage et al. 2004, as cited in Tominaga, 2009b ). Empirical
approaches are based on terrain characteristics and previous occurrence of geodynamic
phenomena in order to estimate both the potential for, and the spatial and temporal
distribution of, future phenomena and their effects. Probabilistic approaches employ
statistical methods to reduce subjectivity of interpretations. However, the outcomes depend
very much on measured patterns defined through site tests and observations, but it is not
always feasible to perform this acquisition of data in developing regions and countries.
Deterministic approaches focus on mathematical modelling that aims quantitatively to
describe certain parameters and rules thought to control physical processes such as slope
Geo-environmental Terrain Assessments Based on Remote
Sensing Tools: A Review of Applications to Hazard Mapping and Control
101
stability and surface water flow. Their application tends to be restricted to small areas and
detailed studies.
In the State of Sao Paulo (Southeast Brazil), high rates of population influx and poorly
planned land occupation have led to concentration of dwellings in unsuitable areas, thus
leading to increasing exposure of the community to risk and impact of hazard events. In
addition, over the last 20 years, landsliding and flooding events have been affecting an
increasingly large geographical area, so bringing about damage to people and properties
(Tominaga et al. 2009a). To deal with this situation, Civil Defence actions including
preventive, mitigation, contingency (preparedness), and emergency response programmes
have been implemented. The assessment of the potential for the occurrence of landslides,
floods and other geodynamic processes, besides the identification and management of
associated risks in urban areas has played a key role in Civil Defence programmes. To date,
systematic hazard mapping has covered 61 cities in the State of São Paulo, and nine other
cities are currently being mapped (Pressinotti et al., 2009).
Examples that mix empirical and probabilistic approaches are briefly presented in this
Section. The concepts of hazard mapping and risk analysis adopted for these studies
followed definitions provided in Varnes (1984) and UN-ISDR (2004), who described risk as
an interaction between natural or human induced hazards and vulnerable conditions.
According to Tominaga (2009b), a semi-quantitative assessment of risk, R, can be derived
from the product R = [H x (V x D)], where: H is the estimated hazard or likelihood of
occurrence of a geodynamic and potentially hazardous phenomenon; V is the vulnerability
determined by a number of physical, environmental, and socio-economic factors that expose
a community and/or facilities to adverse impacts; and D is the potential damage that
includes people, properties, and economic activities to be affected. The resulting risk, R,
attempts to rate the damage to structures and facilities, injury and loss of lives, and
disruption to production.
The first example relates to hazard mapping and risk zoning applied to housing urban areas
in the City of Diadema (Marchiori-Faria et al. 2006), a densely populated region (around
12,000 inhab. per km
2
) of only 31.8 km
2
, situated within the Metropolitan Region of the State
Capital – São Paulo (Figure 7). The approach combined the use of high-resolution satellite
imagery (Ikonos sensor) and ortho-rectified aerial photographs with ground checks. The
aim was to provide civil defence authorities and decision-makers with information about
land occupation and ground conditions as well as technical advice on the potential
magnitude of instability and flooding, severity of damage, likelihood of hazard, and
possible mitigating and remedial measures. Driving factors included the need to produce
outcomes in an updateable and reliable manner, and in suitable formats to be conveyed to
non-specialists. The outcomes needed to meet preventive and contingency requirements,
including terrain accessibility, linear infrastructure conditions (roads and railways in
particular), as well as estimations of the number of people who would need to be removed
from risk areas and logistics for these actions. Risk zones were firstly identified through
field work guided by local authorities. Site observations concentrated on relevant terrain
characteristics and ground conditions that included: slope steepness and hillslope geometry,
type of slope (natural, cut or fill), soil weathering profile, groundwater and surface water
conditions, and land instability features (e.g. erosion rills, landslide scars, river
Environmental Management in Practice
102
undercutting). In addition, information about periodicity, magnitude, and effects of
previous landsliding and flooding events as well as perceptions of potential and future
problems were gathered through interviewing of residents. Satellite images were further
used to assist with the identification of buildings and houses liable to be affected and the
delineation of risk zone boundaries. Risk assessment was based on a qualitative ranking
scheme with four levels of risk: R1 (low); R2 (moderate); R3 (high); R4 (very-high). Low risk
(R1) zones, for example, comprised only predisposing factors to instability (e.g. informal
housing and cuttings in steep slope areas) or to flooding (e.g. informal housing in lowland
areas and close to watercourses but no reported flood within the last 5 years). Very-high risk
(R4) zones were characterized by significant evidence of land instability (e.g. presence of
cracks in soil and walls, subsidence steps, leaning of trees and electricity poles, erosion rills
and ravines, landslide scars) or flooding hazards (e.g. flooding height marks on walls,
riverbank erosion, proximity of dwellings to river channel, severe floods reported within the
last 5 years).
The outcomes, including basic and derived data and interpretations, were integrated and
then presented on a geo-referenced computational system designed to respond the needs of
data displaying and information management of the State of São Paulo Civil Defence
authorities (CEDEC). As described by Pressinotti et al. (2007), such system and database,
called Map-Risk, includes cartographic data, interpretative maps (risk zoning), imagery, and
layers of cadastral information (e.g. urban street network). The system also enabled
generation and manipulation of outputs in a varied set of text (reports), tabular (tables), and
graphic information including photographic inventories for risk zones. The system was fully
conceived and implemented at low cost, utilizing commercial software available that were
customized in this visualisation system through target-script programming designed to
achieve user functionalities (e.g. ESRI/MapObjects, Delphi, Visual Basic, OCX MapObjects).
Examples of delineated risk zones for the City of Diadema and a display of the Map-Risk
functionalities are presented in Figure 7.
The second example refers to a flooding hazard mapping performed at regional and local
scales in the Paraiba do Sul River Watershed, Eastern São Paulo State (Figure 8), in order to
provide a rapid and comprehensive understanding of hazard phenomena and their impacts,
as well as to enable application of procedures of data integration and mapping in different
socio-economic contexts (Andrade et al. 2010). The information was systematised and
processed to allow the build-up of a geo-referenced database capable of providing
information for both environmental regional planning (economic-ecological zoning) and
local scale hazard mapping for civil defence purposes. The regional evaluation covered all
the 34 municipalities located in the watershed, and comprised the following stages of work:
1) survey of previous flooding events reported in newspaper and historical archives; 2) data
systematisation and consolidation to translate gathered news into useful pieces of technical
information; 3) identification of flooding occurrence locations using Google Earth tools; 4)
cartographic auditing, geo-referencing and spatial data analysis using a freeware GIS
package called SPRING (see Section 5); 5) exploratory statistical analysis of data; 6)
preliminary flooding hazard classification on the basis of statistical results. Such preliminary
classification used geopolitical (municipality) and hydrographical sub-basin boundaries as
units for the analysis.
Geo-environmental Terrain Assessments Based on Remote
Sensing Tools: A Review of Applications to Hazard Mapping and Control
103
A)
B)
Fig. 7. A) Location of the City of Diadema in the Metropolitan District of São Paulo (State
capital), Southeast Brazil and example of delineated risk zones over a high-resolution
satellite image (Ikonos). B) Example of Map-Risk system display. See Section 4.2 for details.
[after Marchiori-Faria et al., 2006; Pressinotti et al., 2007]
Environmental Management in Practice
104
Fig. 8. Location of Paraiba do Sul River Watershed in Eastern São Paulo State and
distribution of flooding occurrences. Internal sub-divisions correspond to geopolitical
boundaries (municipalities). [After Andrade et al., 2010]
The regional evaluation was followed-up with detailed flooding hazard mapping (1:3,000
scale) in 7 municipalities, which included: a) ground observations - where previous
occurrence was reported – to measure and record information on flooding height marks,
land occupation, and local terrain, riverbank and water course characteristics; b) geo-
referencing and spatial data analysis, with generation of interpolated numerical grids on
flooding heights and local topography; c) data interpretation and delimitation of flooding
hazard zones; d) cross-referencing of hazard zones with land use and economic information
leading to delimitation of flooding risk zones. Numerical scoring schemes were devised for
ranking hazard and risk zones, thus allowing relative comparisons between different areas.
Hazard zone scores were based on intervals of flooding height (observed and interpolated)
and temporal recurrence of flooding events. Flooding risk scores were quantified as follows:
R = [H x (V x D)], in which potential damage and vulnerability were considered (housing
areas, urban infrastructure, facilities and services to be affected) on the basis of image
interpretation and cross-referencing with land use maps and information. A detail map (yet
unpublished) showing the interpolated grid of flooding heights and delineated hazard
zones is presented in Figure 9.
Geo-environmental Terrain Assessments Based on Remote
Sensing Tools: A Review of Applications to Hazard Mapping and Control
105
A)
B)
Fig. 9. A) Measurement of maximum flood height for recent flooding event. B) Numerical
interpolated grid of flooding heights and delineated flooding hazard zones. Green = Low
probability of occurrence, Estimated flooding heights (Efh) < 0.40 m. Yellow = Moderate
probability, 0.40 < Efh < 0.80 m. Light Brown = High probability, 0.80 < Efh < 1.20 m.
Red = Very high probability, Efh > 1.20 m. Ground observations and measurements: cross
and rectangle. Continuous lines: black = topographic contour lines, blue = main river
channel boundaries. Not to scale.
5. Geo-environmental assessment: applications to land reclamation policies
Land reclamation of sites of previous mineral exploitation frequently involve actions to
minimize environmental damage and aim at re-establish conditions for natural balance and
sustainability so reconciling former mined/quarried sites with their surroundings (Brollo et
al., 2002). Strategies and programmes for land reclamation need to consider physical and