Environmental Management in Practice Part 11 docx
Bạn đang xem bản rút gọn của tài liệu. Xem và tải ngay bản đầy đủ của tài liệu tại đây (709.08 KB, 30 trang )
Assessing the SMEs’ Competitive Strategies on the Impact
of Environmental Factors:A Quantitative SWOT Analysis Application
291
Criteria 1
st
2
nd
3
rd
4
th
Weights
Strengths 4 8 4 2 0.264
Opportunities 7 4 7 0 0.299
Weaknesses 2 0 7 9 0.174
Threats
5 6 0 7 0.263
* The weights are normalized and totally equal to one.
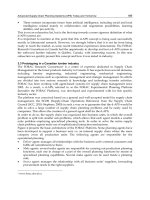
Table 2. Priority votes of four criteria
3.3 Step 3: calculate the weights of criteria and sub- criteria in SWOT
The votes on Table 2 are used to calculate the weights of the four criteria by model (2), R=4,
S=4, n=18 and the lowest weights of the fourth place are
1
180
(u
r4
2/ [n*S(S+1)] =2/ [18*4(5)
=0.0056]). The weights for strength, weakness, opportunity and threat at the second level are
0.884, 1.000, 0.581 and 0.882, respectively. After normalizing these data, the weights of
outcome are 0.264, 0.299, 0.174 and 0.263, as it is illustrated in column 6 of Table 2, respectively.
For “Strengths” in the Table 3, there are variables R=3, S=3, n=18 and the lowest weights of the
third place are 1/108 (u
r3
2/ [n*S(S+1)] =2/ [18*3(4) =0.0093]). Similarly, the votes within
Table 3 are using the same procedure in order to determine the weights of the sub-criteria. The
results of the weight of sub-criteria are listed in columns 5 and 10 of Table 3.
Criteria
Votes
Weights
Votes
Weights
1
st
2
nd
3
rd
1
st
2
nd
3
rd
Strengths
Opportunities
S1 13
4 1 0.465
O1 15
2 1 0.495
S2 0 9 9 0.227
O2 0 15 3 0.258
S3 5 5 8 0.308
O3 3 1 14 0.247
Total 18
18 18
Total 18
18 18
Weaknesses
Threats
W1 11
7 0 0.439
T1 5 5 8 0.304
W2 3 3 12
0.258
T2 5 9 4 0.336
W3 4 8 6 0.303
T3 8 4 6 0.360
Total 18
18 18
Total 18
18 18
* The weights are normalized and totally equal to one.
Table 3. Priority votes and weights of twelve sub-criteria
3.4 Step 4: scores of competitive strategies in SWOT
The competitive strategies, OS-1, OS-2, OW-1, TS-1 and TW-1 are subjective indices that
could be translated into numerical ratings using different methods, such as questionnaire,
AHP or vote-ranking and so much more. TF may ask their colleagues to answer these
questionnaires in order to rate the competitive strategies of sub-criteria of each SWOT. A
major problem was thus, to ensure the consistency between managers and to avoid any bias
creeping in. A set of standard guidelines was placed after discussions with the TF (voters). It
is mainly agreed that all performance scores would be based on a nine points grade scale.
Environmental Management in Practice
292
Each grade would have an adjective descriptor and an associated point score or range of
point scores. The TF makes their judgment on the qualitative scale of adjectival descriptors.
Table 4 lists the example for rating the strength and opportunity indices, where the lower and
upper scores are predetermined from 1-9. The strength and opportunity indices should be
maximized, the least-favorable candidate is assigned the smallest value and the most-favorable
candidate is assigned the largest value. On the other hand, the weakness and threat indices
need to be minimized, where the least-favorable candidate is assigned the largest value and
the most-favorable candidate is assigned the smallest value. The overcoming range of
subjective indices is set between 1 and 9 illustrated in Table 5. Therefore, each of the
competitive strategy can be awarded a ‘score’ from 1 to 9 on each sub-criterion.
Scores Rules
9
Greatl
y
conformin
g
to market and sub-criteria of requirement, successful
p
robabilit
y
more than 90%
7
Better conformin
g
to market and sub-criteria of requirement, successful probabilit
y
about 70%
5
Conformin
g
to market and sub-criteria of requirement, successful probabilit
y
about
50%
3
Sli
g
htl
y
conformin
g
to market and sub-criteria of requirement, successful
p
robabilit
y
about 30%
1
Not conformin
g
to market and sub-criteria of requirement, successful probabilit
y
about 10%
Table 4. Grading different strategy scores in strength and opportunity indexes
Scores Rules
9
Greatl
y
overcomin
g
sub-criteria requirement, successful probabilit
y
more than
90%
7 Better overcomin
g
sub-criteria re
q
uirement, successful
p
robabilit
y
about 70%
5 Exactl
y
overcomin
g
sub-criteria re
q
uirement, successful
p
robabilit
y
about 50%
3 Sli
g
htl
y
overcomin
g
sub-criteria re
q
uirement, successful
p
robabilit
y
about 30%
1 Not overcomin
g
sub-criteria re
q
uirement, successful
p
robabilit
y
about 10%
Table 5. Grading different strategy scores in weakness and threat indexes
The five competitive strategies, OS-1, OS-2, OW-1, TS-1 and TW-1, by means of the highest
rating were regarded as the best competitive strategies, with the rest being ranked
accordingly. The competitive strategies will earn the average scores of questionnaires within
Table 4 and Table 5 by TF. The average of collected scores is listed in the columns 5-9 of
Table 6.
3.5 Step 5: total weighted scores of competitive strategies
This step requires the TF to assess the performance of all the competitive strategies within the
twelve sub-criteria of SWOT identified as important for competitive strategies rating. Simple
score sheets were provided to assist the manager to record the scores for each strategy on each
of the twelve sub-criteria. An example of this strategy is shown in Table 6. In the first row of
Table 6, the number 0.123 is equal to the product of the “Strength” criterion score 0.264
multiply with the S1 given value of “0.465”. Moreover, the same method is applied to obtain
Assessing the SMEs’ Competitive Strategies on the Impact
of Environmental Factors:A Quantitative SWOT Analysis Application
293
other results. Once the weights for sub-criteria have been determined, it is relatively easy to
calculate the resulting competitive strategies rating scores.
Mathematically, the rating is equivalent to the sum of the product of each sub-criterion
weight and the competitive strategy performance score. The rating value of competitive
strategies is obtained by summing the products of the respective elements. The competitive
strategies rating value for strategy OS-1 is obtained by summing up the products of the
respective elements in columns 4 and 5 for each row; given in the final column 10, the over
all total weighted scores of the row is “6.859”. The rating method used in strategy OS-1, can
be used to find the total scores of the other four strategies stated in columns 11-14 of Table 6.
The rating value for each competitive strategy is obtained by summing the products of the
respective elements in the matrix; given in the final score, the values of over all competitive
strategies of OS-1, OS-2, OW-1, TS-1 and TW-1 respectively is, 6.859, 8.357, 7.532, 7.298 and 8.274
stated within the last row of Table 6. This gave a rating score for each competitive strategy,
whereas the higher the rating, the better the overall performance for competitive strategy.
3.6 Step 6: assessment of competitive strategies
In the last row of Table 6, the rating value for each strategy is obtained; the final score and
the ranking of competitive strategies for OS-2, TW-1, OW-1, TS-1 and OS-1 is first, second,
third, fourth and fifth respectively. Even though the score of OS-2 is only higher by 0.083
than TW-1 and the score of OW-1 is higher by 0.234 than TS-1, however for both of the
competitive strategies, the difference of scores will definitely change the overall final rank.
These results will be regarded as sensitivity analysis for five competitive strategies.
Criteria
(A)
Sub-criteria
(B)
Weights
(C= A×B)
Grade Strategies Scores
Weighted Strategies Scores
OS-1 OS-2
OW-1
TS-1 TW-1
OS-1
OS-2
OW-1 TS-1 TW-1
Strengths S1
0.465
0.123
6.833
8.889
8.056
6.944
8.722
0.839
1.091
0.989 0.853 1.071
0.264
S2 0.227
0.060 6.944
8.944
7.611
7.278
8.500
0.416
0.536
0.456 0.436 0.509
S3 0.308
0.081 7.056
8.833
7.556
8.611
8.611
0.574
0.718
0.614 0.700 0.700
Opportunities O1
0.495
0.148 6.833
7.778
7.389
7.278
8.167
1.011
1.151
1.094 1.077 1.209
0.299 O2
0.258
0.077 6.944
8.000
7.611
7.389
8.000
0.536
0.617
0.587 0.570 0.617
O3
0.247
0.074 6.778
8.111
7.778
7.500
7.944
0.501
0.599
0.574 0.554 0.587
Weaknesses W1
0.439
0.076 6.611
7.778
7.222
6.944
7.833
0.505
0.594
0.552 0.530 0.598
0.174 W2
0.258
0.045 6.500
7.833
7.278
7.056
7.778
0.292
0.352
0.327 0.317 0.349
W3
0.303
0.053 6.667
7.944
7.500
7.278
7.722
0.351
0.419
0.395 0.384 0.407
Threats T1 0.304
0.080 7.056
8.611
7.278
7.000
8.444
0.564
0.688
0.582 0.560 0.675
0.263 T2 0.336
0.088 7.111
8.722
7.556
7.167
8.389
0.628
0.771
0.668 0.633 0.741
T3 0.360
0.095 6.778
8.667
7.333
7.222
8.556
0.642
0.821
0.694 0.684 0.810
Total Weighted Scores
6.859
8.357
7.532 7.298 8.274
Table 6. The SWOT analysis of different strategies
4. Discussion
First of all, considering that the strategy OS-1 has the lowest score within the strategy
analysis, most of the SMEs supposed that this strategy is quite acceptable even though there
Environmental Management in Practice
294
are still have some doubts present, especially on whether or not by obtaining the EMS
related international standard authentication, such as ISO14000, it will certainly create a
high value-added market. From a present market condition which is quite unfeasible to
reflect the practical demand, frequently as a final result it is invested in fund or
modification. Even though most of the customers are quite optimistic and agreed to this way
of doing, however when everything is fully involved within EMS in the future, it will
certainly has some affect on its capital or product selling price. Which means that at the
present moment, the demand on this particular product is lacking, furthermore, it might
resulted in the incapability to agree on these certain analysis by some SMEs.
Moreover, from the strategy analysis OW-1and TS-1 point of view, direct changes in
manufacture preferences to create products of high environmental requirement standard
has a bigger risk toward the SMEs in term of direct investment. Generally, average
companies do not have certain investment planning until it has reached a deal, order
placement or customer’s promise in advance. Additionally, an increasingly strict
government or industry environmental in carrying out this phase is facing difficulty, where
presently the government mostly is using counseling method or fund assistance to
encourage and urge the industry to increase its EMS ability in order to reach the low price
product strategy and high level of product diversification.
Lastly, the strategy OS-2 imposes a similar way of thinking with strategy TW-1. Taiwanese
SMEs apperceive the significance of EMS and also recognize the importance to survive
within the diversified competing market environment, whereas they need to build up its
environmental management that has to suit the EMS specification and attention. However,
the investment within environmental protection for its resources and facilities requires a
great amount of expenditures. Under this major investment, if the expected outcomes are
unpredictable, therefore the willingness on investing within the environmental management
will suffer an enormous drawback. These SMEs certainly would hope that government will
work together with country resources, providing some assistance in procuring EMS needed
facilities and equipments or even any related training within the environmental
management scope, moreover guidance or counselling in obtaining different kinds of ISO
authentic certificate will also be valuable resource.
Obviously, most people are familiar with the conflicts between environmental protection
and economic development. Those who are convinced of the consequences of global
warming will remain convinced, while those suspicious will remain suspicious. After all,
economic development means bread, while the mankind cannot immediately appreciate the
deep implications of its damage to the great nature. Therefore, politicians should be aware
of the environmental implications of legal provisions and regulations. Likewise, the
industry authorities, when developing new products, should consider the intangible social
cost of pollution as a part of the overall cost and deal with the issue of pollution as a part of
life cycle management, so that such considerations and practices will benefit our earth. In
EMS, this will further our understanding of the potential poisonous substances to be
produced in production, deployment and replacement stages, and will help us minimize
pollution and thus contribute to environmental protection.
5. Conclusions
With the continuing development of human civilization and technology, the life cycle of any
products, from production, consumption to final waste, it is involving more and more
external adverse factors which bring about direct or indirect impact on the environment.
Assessing the SMEs’ Competitive Strategies on the Impact
of Environmental Factors:A Quantitative SWOT Analysis Application
295
Economists said that we should stop aggravation of global warming now; and there is only
one earth; therefore, be environmentally friendly.
Lastly, the competitive strategies OS-2 and TW-1 will be provided to Taiwanese SME
department and industry union. The main contributions of this study are as follows:
1. The selection procedure of competitive strategies in SWOT can assist the audience to
think in a very comprehensive and detailed manner, while allowing them to categorize
various issues.
2. In this field, many researchers have sought to improve the different capabilities of
quantitative SWOT, such as AHP, ANP or fully rank decision-making units. In this case,
the vote-ranking methodology incorporated with SWOT is applied and as a result, it
became the easiest and most convenient method compared to others.
The vote-ranking is presented as an approach to the problem of ranking candidates in a
preferential election. The future researches had suggested that the cross-evaluation method
is better off to be applied to assess candidates through peer-group, whereas one can attain a
more balanced view of the weight-setting. The cross evaluation can be used to overcome the
problem of maverick decision-makers. The proposed methodology can be utilized to issues
of SWOT, such as AHP or ANP within this study.
6. References
Ahsen, A.V. ; Funck, D. (2001). Integrated management systems - opportunities and risks for
corporate environmental protection. Corporate Environmental Strategy 8(2), pp. 165-
176.
Chang, H.H. ; Huang, W.C. (2006). Application of a quantification SWOT analytical method.
Mathematical and Computer Modelling 43, pp. 158-169.
Charnes, A. ; Cooper, W.W. & Rhodes, E. (1978). Measuring the efficiency of decision-
making units. European Journal of Operational Research 2, pp. 429-444.
Cook, W.D. ; Kress, M. (1990). A data envelopment model for aggregating preference
rankings. Management Science 36(11), pp. 1302-1310.
Cook, W.D. ; Kress, M. (1992). Ordinal information and preference structure: decision models and
applications. Prentice Hall, New Jersey.
Dyson, R.G. (2004). Strategic development and SWOT analysis at University of Warwick.
European Journal of Operational Research 152, pp. 631-640.
Foroughi, A.A. & Tamiz, T. (2005). An effective total ranking model for a ranked voting
system. OMEGA 33, pp. 491-496.
Fryxell, G.E. & Szteo, A. (2002). The influence of motivations for seeking ISO 14001
certification an empirical study of ISO 14001 certified facilities in Hong Kong.
Journal of Environmental Management 65, pp. 223-238.
Gernuks, M. ; Buchgeister, J. & Schebek, L. (2007). Assessment of environmental aspects and
determination of environmental targets within environmental management
systems (EMS) – development of a procedure for Volkswagen. Journal of Cleaner
Production 15, pp. 1063-1075.
Green, R.H. ; Doyle, J.R. & Cook, W.D. (1996). Preference voting and project ranking using
DEA and cross-evaluation. European Journal of Operational Research 90, pp. 461-472.
Hashimoto, A. (1997). A ranked voting system using a DEA/ AR exclusion model: a note.
Journal of the Operational Research 97, 600-604.
Hashimoto, A. & Ishikawa,H. (1993). Using DEA to evaluate the state of society as measured
by multiple social indicators. Socio-Economic Planning Sciences 27(4), pp. 257-268.
Environmental Management in Practice
296
Jasch, C. (2003). The use of environment management accounting (EMA) for identifying
environmental costs. Journal of Cleaner Production 11, pp. 667-676.
Kajanus, M. ; Kangas, M. & Kuttila, M., (2004). The use of value focused thinking and the
A’WOT hybrid method in tourism management. Tourism Management 25, pp. 499-506.
Kuttila, M. ; Pesonen, M. ; Kangas, J. & Kajanus, M. (2000). Utilizing the analysis hierarchy
process (AHP) in SWOT analysis – a hybrid method and its application to a forest-
certification case. Forest Policy and Economics 1, pp. 41-45.
Leskinen, L.A. ; Leskinen, P. ; Kuttila, M. ; Kangas, M. & Kajanus, M. (2006). Adapting
modern strategic decision support tools in the participatory strategy process- a case
study of a forest research station. Forest Policy and Economics 8, pp. 206-216.
Liu, F.H.F. & Hai, H.L. (2005). The voting analytic hierarchy process method for selecting
suppliers. The International Journal of Production Economics 97, pp. 308-317.
Lozano, M. & Vallés, J. (2007). An analysis of the implementation of an environmental
management system in a local public administration. Journal of Environmental
Management 82, 495-511.
Mbohwa, C. & Fukada, S. (2002). ISO 14001 certification in Zimbabwe experiences, problems
and prospects. Corporate Environmental Strategy 9(4), pp. 427-436.
Melnyk, S.A. ; Sroufe, R.P. & Calantone, R. (2003). Assessing the impact of environmental
management systems on corporate and environmental performance. Journal of
Operations Management 21, pp. 329-351.
Noguchi, H. ; Ogawa, M. & Ishii, H. (2002). The appropriate total ranking method using
DEA for multiple categorized purposes. Journal of Computational and Applied
Mathematics 146, pp. 155-166.
Obata, T. & Ishii, H. (2003). A method for discriminating efficient candidates with ranked
voting data. European Journal of Operational Research 151, pp. 233-237.
Paliwal, R. (2006). EIA practice in India and its evaluation using SWOT analysis.
Environmental Impact Assessment Review 26, pp. 492-510.
Pan, J.N. (2003). A comparative study on motivation for and experience with ISO9000 and
ISO14000 certification among Far Eastern countries. Industrial Management & Data
Systems 103(8), 564-578.
Rao, P. ; Casttillo, O. ; Intal Tr, P.S. & Sajid, A. (2006). Environmental indicators for small
and medium enterprises in the Philippines: An empirical research. Journal of Cleaner
Production 14, pp. 505-515.
Rennings, K. ; Ziegler, A. ; Ankele, K. & Hoffmann, E. (2006). The influence of different
characteristics of the EU environmental management and auditing scheme on technical
environmental innovations and economic performance. Ecological Economics 57, pp. 45-59.
Tan, B. ; Lin, C. & Hung, H.C. (2003). An ISO 9001: 2000 quality information system in e-
commerce environment. Industrial Management & Data Systems 103(9), pp. 666-676.
Terrados, J. ; Almonacid, G. & Hontoria, L. (2007). Regional energy planning through SWOT
analysis and strategic planning tools: impact on renewable development. Renewable
& Sustainable Energy Reviews 11, pp. 1275-1287.
Yüksel, Ì. & Dağdeviren, M. (2007). Using the analytic network process (ANP) in a SWOT
analysis – a case study for a textile firm.
Information Sciences 177, pp. 3364-3382.
Zobel, T. ; Almroth, C. ; Bresky, J. & Burman, J-O. (2002). Identification and assessment of
environmental aspects in an EMS context an approach to a new reproducible
method based on LCA methodology. Journal of Cleaner Production 10, pp. 381-396.
15
Implementation of ISO 14000 in Luggage
Manufacturing Industry: A Case Study
S. B. Jaju
G. H. Raisoni College of Engineering,
Department of Mechanical Engineering, Nagpur
India
1. Introduction
Definitions of EMS as provided by three separate documents on environmental
management systems are as given below
ISO 14001: "the organizational structure, responsibilities, practices, procedures, processes
and resources for implementing and maintaining environmental management"
BS 7750: "the organizational structure, responsibilities, procedures, processes and resources
for implementing environmental management"
Eco-Management and Audit Scheme (EMAS): "that part of the overall management system
which includes the organizational structure, responsibilities, practices, procedures,
processes and resources for determining and implementing the environmental policy"
2. Development of the ISO 14000 series
The ISO 14000 family includes the ISO 14001 standard, which represents the set of standards
used by various types of organizations for designing and implementing an effective
environmental management system. The major objective of the ISO 14000 series of norms is
"to promote more effective and efficient environmental management in organizations and to
provide useful and usable tools - ones that are cost effective, system-based, and flexible and
reflect the best organizations and the best organizational practices available for gathering,
interpreting and communicating environmentally relevant information".
Unlike previous environmental regulations, which began with command and control
approaches, later replaced with ones based on market mechanisms, ISO 14000 was based on
a voluntary approach to environmental regulation. The series includes the ISO 14001
standard, which provides guidelines for the establishment or improvement of an EMS. The
standard shares many common traits with its predecessor ISO 9000, the international
standard of quality management, which served as a model for its internal structure and both
can be implemented side by side. As with ISO 9000, ISO 14000 acts both as an internal
management tool and as a way of demonstrating a company’s environmental commitment
to its customers and clients.
Prior to the development of the ISO 14000 series, organizations voluntarily constructed their
own EMS systems, but this made comparisons of environmental effects between companies
difficult and therefore the universal ISO 14000 series was developed. An EMS is defined by
Environmental Management in Practice
298
ISO as: “part of the overall management system, that includes organisational structure,
planning activities, responsibilities, practices, procedures, processes and resources for
developing, implementing, achieving and maintaining the environmental policy’.
3. Driving forces
Environmental concerns
For a number of years preceding the introduction of a formal EMS, there was a genuine
concern about its various environmental impacts. Some typical examples of impacts are:
energy and resource usage (electricity, gas , water)
raw material usage (paper, plates, inks, packaging, chemicals, film)
general waste (domestic)
recyclable waste (paper, timber, aluminum, silver, plastics)
hazardous waste (chemical wastes, liquid effluent, air emissions)
nuisances (noise, litter, dust, odors)
contracted activities (transport, subcontracted printing work)
product end use and disposal
Legal obligations
Over recent years, there have been considerable changes in environmental legislation. Every
organisation wants to address its legal obligations, such as compliance with effluent
discharge license parameters, or local authority planning requirements. Integrated Pollution
Control licensing, for instance, will eventually oblige most industries to comply with stricter
industry guidelines on pollution control, with the threat of heavy financial penalties
resulting from non-compliance.
Customer pressure
Lot of pressure is from customer end that is the basic aim of any organisation. Ultimately
customer should have faith in the industry that the said industry is having compliance for
environmental parameters.
4. Basic principles and methodology
The fundamental principle and overall goal of the ISO 14001 standard, is the concept of
continual improvement. ISO 14001 is based on the Plan-Do-Check-Act methodology,
grouped into five phases that relate to Plan-Do-Check-Act; Environmental Policy, Planning,
Implementation & Operation, Checking & Corrective Action and lastly Management
Review.
Plan – establish objectives and processes required
Prior to implementing ISO 14001, an initial review or gap analysis of the organisation’s
processes and products is recommended, to assist in identifying all elements of the current
operation and if possible future operations, that may interact with the environment, termed
environmental aspects. Environmental aspects can include both direct, such as those used
during manufacturing and indirect, such as raw materials (Martin 1998). This review assists
the organisation in establishing their environmental objectives, goals and targets, which
should ideally be measurable; helps with the development of control and management
Implementation of ISO 14000 in
Luggage Manufacturing Industry: A Case Study
299
procedures and processes and serves to highlight any relevant legal requirements, which
can then be built into the policy.
Do – implement the processes
During this stage the organisation identifies the resources required and works out those
members of the organisation responsible for the EMS’ implementation and control. This
includes documentation of all procedures and processes; including operational and
documentation control, the establishment of emergency procedures and responses, and the
education of employees, to ensure they can competently implement the necessary processes
and record results. Communication and participation across all levels of the organisation,
especially top management is a vital part of the implementation phase, with the
effectiveness of the EMS being dependant on active involvement from all employees.
Check – measure and monitor the processes and report results
During the check stage, performance is monitored and periodically measured to ensure that
the organisation’s environmental targets and objectives are being met (Martin 1998). In
addition, internal audits are regularly conducted to ascertain whether the EMS itself is being
implemented properly and whether the processes and procedures are being adequately
maintained and monitored.
Act – take action to improve performance of EMS based on results
After the checking stage, a regular planned management review is conducted to ensure that
the objectives of the EMS are being met, the extent to which they are being met, that
communications are being appropriately managed and to evaluate changing circumstances,
such as legal requirements, in order to make recommendations for further improvement of
the system. These recommendations are then fed back into the planning stage to be
implemented into the EMS moving forward.
5. Role of EMS
1. An assessment of the existing practices and situation of an organization.
2. A register of all environmental effects associated with the company's activities,
established through an initial environmental review.
3. A list of all legislation relevant and applicable to the environmental aspects of the
activities, products and services of the organization.
4. Development of a corporate environmental policy and environmental management
plan
5. The setting of environmental performance objectives and targets for both current and
future activities.
6. Development of environmental performance evaluation procedures.
7. Establishment of an effective environmental training program for all employees within
the organization, which will raise awareness, enhance skills for dealing with
environmental issues and stress compliance with relevant legislation.
8. Implementation of a system, which reliably manages the performance of the
organization, for both current and future activities.
9. Documentation of the system communicated to all employees and distributed to all
interested parties, especially to the public.
10. Establishment of non-conformance and corrective and preventive action procedures.
Environmental Management in Practice
300
11. Regular checking, reviewing and auditing of company practices and management
commitment to reflect changing conditions with a focus on continual improvement.
6. Benefits of EMS implementation
6.1 Natural
1. Clean Air, Water, Soil.
2. Prevention and/or significant reduction of pollution and waste Generation.
3. Improved health and safety of interested parties.
4. Reduction in the use of non-renewable resources.
5. Improved conservation and efficient use of natural resources.
6.2 Corporate
1. Reduced financial costs through reduction in consumption of resources and through
waste minimization.
2. Reduction and/or avoidance of potential emergency situations.
3. Avoidance of incidence of non-compliance with legislation and reduction in fines and
cleanup costs.
4. Reduction in the cost of gaining capital, financial backing, insurance and valuation by
becoming an "environmentally friendly" organization.
5. Improved marketing advantage as a "green" operation.
6. Increased staff morale and occupational safety and health standards.
7. Improved customer, client and community relations.
8. Increased documentation, communication and feedback of environmental policies and
initiatives.
7. Major requirements of ISO 14000
Following are some of the requirements of ISO 14000:
1. Environmental protection as one of the highest corporate priorities with clear
assignment of responsibilities and accountabilities to all employees.
2. Compliance with all environmental laws and regulations applicable to the company's
activities, products and services.
3. Ongoing communications on environmental commitment and performance with all
shareholders.
4. Strategic planning that sets forth environmental performance objectives and targets,
implemented through a disciplined management process.
5. Periodic performance measurement (as well as systems audits and management
reviews) to achieve continual improvement wherever possible.
6. Full integration with health and safety, quality, finance, business planning and other
essential management processes.
7. Focus on EMS and looks for attributes that would sustain sound environmental
decision making and performance.
8. Top management commitment.
9. Third-party registration, through ISO 14001, or self-declaration for companies that meet
the ISO 14000 standards. ISO 14001 includes discrete elements of environmental
aspects, legal requirements, objectives and targets, environmental management
program, communications, and emergency preparedness and response.
Implementation of ISO 14000 in
Luggage Manufacturing Industry: A Case Study
301
8. Stage by stage implementation of ISO 14001
First stage: commitment and policy
i. Environmental policy
Second stage: Planning
i. Environmental aspects
ii. Legal and other requirements
iii. Objectives and targets
iv. Environmental management program
Third stage: Implementation
i. Structure and responsibility
ii. Training, awareness and competence
iii. Communication
iv. Environmental documentation
v. Document control
Fourth stage: Operational control measurement and evaluation
i. Monitoring and measurement
ii. Non-conformance and corrective and preventive action
iii. Records
iv. Environmental management system audit
Fifth stage: Review and improvement
i. Management review
9. Benefits of developing ISO 14000 series
1. Having a single, global set of environmental management system guidance standards.
2. The development of a common, global approach to voluntary and self-directed
environmental management.
3. Enhancement of the ability to measure levels of sustainability and environmental
performance through auditing methods.
4. Harmonization of non-uniform standards for a range of environmental impact issues.
10. Implelementation OF ISO 14000 in luggage manufacturing industry:
The study is done for Canteen and Tools and Mould repairing.
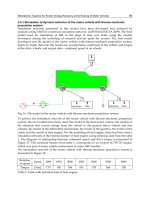
CANTEEN: Firstly the various input to canteen are identified viz. Vegetables, spices, oil,
food grains, water, LPG gas, Electricity. Output of the canteen is Food products.
The various effects of the canteen on the environment as a whole are identified
1. Used water discharged to drainage.
2. Fire in L. P. G. (Emergency).
3. Solid waste non biodegradable (Carboys, drums, containers, empty milk bags).
4. Solid waste biodegradable (spent food and vegetables).
5. Fume generation.
6. Heat loss to atmosphere.
Environmental Management in Practice
302
7. Noise generation.
The complete canteen as process showing input and output as well its effects on
environment are tabulated in aspect register as shown in Table I.
Each aspect is studied carefully for the following category of aspects:
1. Normal aspects: Effects of aspects are negligible.
2. Abnormal Aspects: Severe effect on environment.
3. Emergency Aspects: Nature of Aspect is emergency. Emergency prepared plan has to
be there. Proper training to be given to the people for handling the emergency
situations. They should be equipped with safety devices to tackle the emergency. For
example: Suppose if there is a fire hazard. Whether the fire fighting equipment is there
or not. If it is there then whether the people are trained to operate it and so on.
Emergency preparedness plan for every department, which will consist of the following few
points:
1. Fire equipments are available or not that too in proper place.
2. Are the people trained to handle the situations?
3. Security people should be trained.
4. First aid training is to be given to all.
5. Fire equipments layout, number of fire equipments, is to be planned.
6. Emergency siren should start immediately after the fire.
7. All people should assemble at one place.
Factor rating is applied to each aspect depending on various factors. The various ratings
used are
A: Occurrence
Continuous (8hours & above)/day 5
Less than 8 hours/day 4
Less than 8 hours/week 3
Less than 8 hours/month 2
Less than 8 hours/year 1
C: Significance of Impact
Causing death to human being on site/ offsite, damage
to flora fauna, air, water, land (offsite).
5
Damage to flora fauna, air, water, land or
hospitilisation to human being on site.
4
Damage to flora fauna, air, water, land or first aid to
human being on shop
3
Damage to flora fauna, air, water, land and or first aid
to human being on shop
2
Negligible impact 1
Implementation of ISO 14000 in
Luggage Manufacturing Industry: A Case Study
303
D: Controls
Controls absent 5
Controls present 4
Controls present but needs human intervention 3
Controls present no human intervention 2
Closed loop control 1
E: Frequency of Detection
Once in a year & above 5
Once in six months 4
Once in one to three months 3
Once in a week 2
Once in a day 1
F: Category of waste
Hazardous waste 5
Non-hazardous waste (High) 4
Non-hazardous waste (Low) 3
100% recycled in house or recycled from outside party
for inside use
2
Negligible waste generation 1
The factor rating of impacts for each aspect is shown in Table II.
After categorisation of aspects, their impact has to be ascertained. Then whether they can be
measured or not. If measured, what is the present status? Then the frequency of occurrence
is to be known. Further what is the treatment given to nullify the bad effects of aspects on
environment? All these analysis is depicted in Table III.
After rating and critical analysis of each aspect one should have the action plan for the
aspect, which is affecting severely on environment. Meetings should be conducted to take
reviews on the improvement after the implementation of action plan. The improved status
to be maintained and periodic review are done to ascertain.
In the similar way study is carried out for process of TOOL AND MOULD REPAIR and the
reports are shown in Table IV, V and VI.
11. Conclusion
With the implementation of EMS, communications concerning environmental practices were
streamlined. It was possible to identify areas where utility savings existed. EMS defined
roles and responsibilities towards each aspect of the process and their impacts on the
environment. A systematic approach is understood to handle environmental issues in place
and the overall plant cost savings coming from tracking resources and accounting for them.
The EMS also provides the more intangible benefit of employee taking pride of working in
the plant that is a good environmental neighbour.
Environmental Management in Practice
304
Table No. I
LUGGAGE INDUSTRIES LTD.
ASPECT REGISTER
DOC No. : ASP – 27
SHEET No. : 1 of 3
Dept. : Pers & Admn
ISSUE DATE : 1-08-2003
REV No. : 00
Process :- Canteen REV. DATE : 00
Prepared by : Approved By :
CANTEEN
Noise Generation Heat loss to atmosphere
Fume Generation
Food products
Solid waste biodegradable
(spent food and Vegetable)
Solid waste non biodegradable
(carboys, drums, containers, empty milk bags)
Fire in L.P.G. (Emergency)
Used water discharged to drainage
Vegetables, spices,
Electricity
Water Consumption
L.P.G. Gas
Implementation of ISO 14000 in
Luggage Manufacturing Industry: A Case Study
305
Table No. II
LUGGAGE
INDUSTRIES LTD.
ASPECT REGISTER
DOC No. : ASP – 27
SHEET No. : 3 of 3
Dept. : Pers & Admn
ISSUE DATE : 1-08-2003
REV No. : 00
Process :- Canteen REV. DATE : 00
Sr.
No.
ASPECT
FACTOR RATING
TOTAL
RATING
IS IT
SIGNIFICANT
A B C D E F
NORMAL ASPECTS
01
Fume
Generation
5 1 1 2 5 1 15 No
02 Heat loss 5 1 1 2 5 1 15 No
03
Noise
generation
S T A T U T O R Y YES
04
Discharge of
used water
5 3 1 3 3 3 18 YES
05
Solid waste
biode
g
radable
spent food
vegetable
5 3 1 3 3 3 18 YES
06
Solid waste
non
biode
g
radable
corbo
y
s drums
containers etc.
2 1 1 3 3 3 13 No
ABNORMAL ASPECTS
07 Nil Nil Nil Nil Nil Nil Nil Nil No
EMERGENCY ASPECTS
08
Fire in L.P.G.
Storage area
YES
Prepared by : Approved By :
Environmental Management in Practice
306
Table No. III
LUGGAGE INDUSTRIES LTD.
ASPECT REGISTER
DOC No. : ASP – 27
SHEET No. : 2 of 3
Dept. : Pers & Admn
ISSUE DATE : 1-08-2003
REV No. : 00
Process :- Canteen REV. DATE : 00
Sr.
No.
Aspect Impact Measur.
Indicator
Present
status
Frequency of Present
treatment
Type of
control
Remarks
reference
Occur
Meas
NORMAL ASPECTS
01 Fume
generation
Air Pollution
Not
measured
Not
measured
Cont.
Not
Measured
Nil Nil Nil
02 Heat
loss
Ambient
warming
Deg.
Celsius
Not
measurable
Cont.
Not
measurable
Nil Nil Nil
03 Noise
generation
Noise
pollution
dB 72 dB Cont.
Negligible
Nil Statutory Noise level
report
04 Solid waste
biode
g
radable
spent food
and vegetable
Land
Contamination
Kgs/Day 45 –50 kgs
Cont.
Once in a
day
Disposed
to animal
feeder
Self EMP-P&A01
05 Discharge of
used water to
drainage
Water
pollution
K Ltrs. Not
measured
Daily
Not
measured
Disposed
to sewage
Self EMP-P&A02
06 Solid waste
non-
biode
g
radable
carboys,
drums,
containers
Land
contamination
Nos./month
18 Tins
20 Gunny
bags
900 milk
bags
Cont.
Once in a
month
Disposed
to
recyclers
Self Nil
ABNORMAL ASPECTS
07 Nil Nil Nil Nil Nil Nil Nil Nil Nil
EMERGENCY ASPECTS
08 Fire in L.P.G.
storage area
Damage to
flora fauna, air,
land, human
being & assets
- No incident
so far
- - - - Emergency
preparedness
& response
plan
Prepared by : Approved By :
Implementation of ISO 14000 in
Luggage Manufacturing Industry: A Case Study
307
Table No. IV
LUGGAGE INDUSTRIES LTD
ASPECT REGISTER
DOC No. : ASP – 13
SHEET No. : 1 of 3
Dept. : Tool Room ISSUE DATE : 1-08-2003
REV No. : 01
Process :- Tool / Mould Repairing
REV. DATE : 18/01/2004
Prepared by : Approved By :
TOOLS & MOULD REPAIRING
Heat loss to atmosphere
Dust generation
Noise generation
Finished /
Semifinished Tools
& Moulds
Chips generation
Coolant / Oil leakage
Cotton waste
M.S. Plate, Steel round,
Copper plate / round,
Graphite blocks, Water for
machine coolant, machine
oil
Environmental Management in Practice
308
Table No. V
LUGGAGE INDUSTRIES
LTD
ASPECT REGISTER
DOC No. : ASP – 13
SHEET No. : 3 of 3
Dept. : Tool Room
ISSUE DATE : 1-08-2003
REV No. : 01
Process :- Tool/ Mould
Repairing
REV. DATE : 18/01/2004
Sr. No.
ASPECT
FACTOR RATING
TOTAL
RATING
IS IT
SIGNIFICANT
A B C D E F
NORMAL ASPECTS
01 Noise generation S T A T U T O R Y YES
02
Heat loss to
atmosphere
5 1 1 3 5 1 16 NO
03 Dust generation 3 1 1 5 5 1 16 NO
04
Cotton waste
generation
5 1 1 3 3 3 16 NO
05 Metal scrap 5 1 1 3 3 1 14 NO
06 Spent coolant S T A T U T O R Y YES
ABNORMAL ASPECTS
07 Oil leakage S T A T U T O R Y YES
EMERGENCY ASPECTS
08 Nil Nil
Nil
Nil
Nil Nil
Nil
Nil nil
Prepared by : Approved By :
Implementation of ISO 14000 in
Luggage Manufacturing Industry: A Case Study
309
Table No. VI
LUGGAGE INDUSTRIES LTD.
ASPECT REGISTER
DOC No. : ASP – 13
SHEET No. : 2 of 3
Dept. : Tool Room
ISSUE DATE : 1-08-2003
REV No. : 01
Process :- Tool / Mould
Repairing
REV. DATE : 18/01/2004
Sr.
No.
Aspect Impact
Measur.
Indicator
Present
status
Frequency of
Present
treatment
Type of
control
Remarks
reference
Occur
Meas
NORMAL ASPECTS
01
Noise
generation
Noise
pollution
dB 80 Cont.
Once in 6
months
Nil Statutory
Measurement
of noise level
report
02
Dust
generation
(By
Grinding)
Air
Pollution
Mg./Nm
3
Negligible Cont.
Not
measured
Nil Nil Nil
03
Heat loss to
atmosphere
Ambient
warming
Cent.
Max. 5C
above
ambient
te
perature
Cont.
Not
Measured
Nil Nil Nil
04
Cotton
waste
generation
Land
Contamination
Kgs
Approx. 60
Kgs/Month
Cont.
Monthly
Disposed to
recyclers
Nil
Monthl
y
issue
from store
05
Metal
scrap
Land
Contamination
Kgs.
Appr
x. 30
Kgs/Month
Cont.
Monthly
Disposed to
recyclers
Nil Scrap ticket
06
Spent
coolant
Water
pollution
Ltrs.
Approx. 30
Ltr./Month
Cont.
Monthly
Effluent
treatment
plant
Statutory
Register for
spent coolant
to powder
coating
ABNORMAL ASPECTS
07 Oil leakage
Land
Contamination
Ltrs. Negligible Rare
Not
Measured
Secondary
containment
Statutory Nil
EMERGENCY ASPECTS
08 Nil Nil Nil Nil Nil Nil Nil Nil nil
Prepared by : Approved By :
Environmental Management in Practice
310
12. References
[1] Ambika Zutshi and Amrik S. Sohal, (2000), Environmental management systems auditing:
auditors’ experiences in Australia, Int. J. Environment and Sustainable Development,
Vol. 1, No. 1, pp 73-87.
[2] Subhash Babu, A., Madhu, K. and Sahani, N. (1998), Positioning ISO 14000 standards an
investigative study covering selected Indian Industries, Proc. ISME Conference, Dec
1998, IIT Delhi, pp 286-291.
[3] Fabio Orecchini, (2000), The ISO 14001 certification of a machine process, Journal of Cleaner
Production, Vol. 8, Issue 1, February 2000, pp 61-68.
[4] Martin, R 1998, ISO 14001 Guidance Manual, National Centre for environmental
decision-making research: Technical report, viewed 23 August 2010
[5] Company manual.
Part 3
Technical Aspects of
Environmental Management
16
The Statistical Distributions of Industrial
Wastes: an Analysis of the Japanese
Establishment Linked Input-output Data
Hitoshi Hayami
1
and Masao Nakamura
2
1
Faculty of Business and Commerce, Keio University
2
Sauder School of Business, University of British Columbia
1
Japan
2
Canada
1. Introduction
Both waste management policies and the economic theories underlying them model the
behaviour of a representative company or establishment using. For example, toxic wastes
such as dioxin are regulated by the mean emission volume standard measured per Nm
3
,
where the mean is estimated using data. As we will show, most establishments (particularly
combustion plants) satisfy the required emission standard, while only a few exceed the
regulation limit and must be checked by the authorities until regulation standards are met.
But regulators must monitor all establishments incurring unnecessary costs.
Fullerton and Kinnaman 1995, among other theoretical contributions, show that taxing
downstream establishments can achieve the second best policy. (See also Walls & Palmer
1998, who discuss more general market conditions.) Recent research shows that regulating
downstream establishments promotes research and development by firms in upstream
stages of a supply chain under certain market conditions (Calcott & Walls, 2000; Greaker &
Rosendahl, 2006). These theoretical implications are important for policy making about how
to design a tax system, but these theories also assume a typical producer and the regulation
standard with respect to their mean emissions of waste materials. In practice, however,
even though the coefficients of variation for the distributions of heavy metals in fly ash
found in municipal solid waste are known to reach 50% (Nakamura et al., 1997), little
statistical evidence in the published literature exists on the variation in industrial
establishments’ waste generation and reuse-recycling per unit production, which is basic
information required for economic and ecological design and general policy decisions.
In this paper we fill this gap in the literature and show the distributions of generation rates
for various types of wastes and by-products in the production processes of establishments in
Japanese manufacturing industries. We use the METI survey data (Survey on the Industrial
Waste and By-Products, Japanese Ministry of Economy, Trade and Industry, 2005 and 2006).
This survey gives the amounts of 37 types of industrial wastes generated for four different
levels of the production processes (generation, intermediate reduction, reuse-recycle, and
disposal to landfill) at 5048 establishments.
1
1
See the Clean Japan Center (2005 and 2006) for details of this survey data.
Environmental Management in Practice
314
We have linked the METI survey data with the Japanese Input-Output (I-O) table. Using this
linked data and the data on energy/CO
2
requirements in industrial waste treatment, we are
able to calculate the induced amounts of industrial wastes.
2
For example, waste oil and
waste plastic are generated in large quantities at 3080 and 3694 establishments, respectively.
Estimated amounts of waste oil and waste plastic generated range, respectively, between 0
and 2.50 and between 0 and 2.11 (metric) tonnes per million yen of output. On the other
hand, waste ferroalloy slag is produced at only 11 establishments, and its quantity ranges
from 5.8 to 64.6 tonnes per million yen of output. We estimate that production of every car
with a 2000cc engine or its equivalent induces, for example, 0.051 tonnes of all types of
wastes combined in hot rolling processes and 0.677 tonnes of all types of wastes combined
in iron steel making in upstream production activities. We estimate that a 2000cc equivalent
automobile production generates 1.49 tonnes of all types of wastes combined. We believe
that these averages and the distributions for waste generation rates along a production
supply chain provide (currently unused) useful information for policy makers for further
reductions in the generation of waste materials.
2. Using the input-output analysis for evaluating waste management policies
2.1 Economic input-output-LCA: the theoretical background
The input-output analysis is a powerful tool to evaluate environmental impacts within an
interdependent economic system (Leontief 1970, Baumol and Wolff 1994). When production
of a final product requires intermediate goods (e.g. parts), inter-industry effects along a
supply chain generate various wastes in stages of the life cycle of the final product.
The input-output (I-O) table is like a recipe of all economic activities for a national economy.
Each column describes all the inputs used for an immediate economic activity, such as
producing an automobile, supplying services such as education. It covers all economic
activities and I-O relations are described in monetary terms. Recently publicly available I-O
tables have been applied to the Economic Input-Output Life Cycle Assessment (EIO-LCA)
(Hendrickson et al., 2006; Suh, 2010). Eiolca.net summarizes limitations of EIO-LCA
compared to Process-Based LCA.
One such limitation that EIO-LCA is difficult to apply to an open economy is overcome by
using the methods given by us (Hayami & Nakamura, 2007). The most apparent
disadvantage of EIO-LCA is that product assessments contain aggregate data containing
uncertainty as Eiolca.net describes. Assume there are n commodities (including services) in
an economy, each of which is an input for production of other commodities. A typical
producer k produces output x
j
(k)
of j-th commodity, which requires as inputs X
ij
(k)
, where
i=1,2, ,n. Governments provide the official I-O table with aggregate figures for all
producers of j-th commodity x
j
=∑
k=1
mj
x
i
(k)
, where m
j
is the number of producers of the j-th
commodity. The same aggregation procedure is applied to inputs as follows: X
ij
=∑
k=1
mj
X
ij
(k)
. EIO-LCA assumes that matrix of input coefficients A
ij
defined below is stable and
represents a typical producer’s activity.
() ()
11
mm
kk
ij ij j ij j
kk
jj
AXx X x
,1,2,,ij n
(1)
2
Induced amounts of output mean the amounts of output generated by upper (supplier) stages of a
production supply chain in response to the production activities undertaken at downstream
establishments.
The Statistical Distributions of Industrial Wastes:
an Analysis of theJapanese Establishment Linked Input-output Data
315
But these input coefficients A
ij
are different from producer k’s input coefficients A
ij
() () ()kkk
i
j
i
jj
AXx
,1,2,,ij n
and 1,2, ,
j
km
(2)
Similarly, by applying EIO-LCA to waste management with the same assumptions made
above, we get the amount of waste
i generated in producing output x
j
(we consider 37 waste
materials as defined below):
() ()
11
mm
kk
i
j
i
jj
i
jj
kk
jj
WWastex W x
1,2, ,37i
1,2, ,jn
(3)
Similarly, producer (k) generates i-th waste producing the j-th product:
() () ()kkk
i
j
i
jj
WWastex
1,2, ,37i
,
1,2, ,jn
and 1,2, ,
j
km
(4)
Japan Ministry of Economy, Trade and Industry (METI) conducts an annual survey that
reports the amounts of 37 types of wastes observed in 4 stages: amounts generated by final
production, W
ij
(k)
; amounts of reduction in intermediate steps of production, V
ij
(k)
; amounts
recycled, U
ij
(k)
; and amounts sent for landfill, T
ij
(k)
.
3
The most important assumption in our I-
O analysis is that input coefficients and waste coefficient per output remain constant over
time. If we can show empirically that these coefficients have narrow bell shape
distributions, then the relative stability of these coefficients follows. In this paper, we will
show using our data how the coefficients of waste generation W
ij
(k)
distribute.
Using input coefficients, A
ij
, we can calculate the demand for goods made in stages of
upstream sectors of a supply chain. Unit production of j-th sector output induces
production of i-th sector whose output is given by A
ij
. Similarly production of A
ij
induces
production of A
ki
A
ij
in k-th sector. Repeating this, we can obtain output induced for any
stage in upstream portions of a supply chain. Formally, multiplication of the I-O coefficients
matrix A from left gives us induced output for all relevant goods and services in the
immediate upstream stage of a supply chain.
2
,, ,fAfAf (5)
where
f
is a vector of demands for final goods and services
By multiplying production output for final production (downstream) stage and subsequent
upstream stages (f, Af, ) by waste generation matrix W, we obtain the amounts of waste
generated in the corresponding stages of a supply chain: Wf, WAf, WA
2
f,
2.2 Construction of a linked data set
We briefly describe the procedure we used to link the Wastes and By-products Survey
(WBS) data to the I-O table. We first note that the definition of a sector is different between
the two data sets. WBS is based on the Japan Standard Industry Classification (JSIC) system,
3
V
ij
(k)
is defined as: V
ij
(k)
=Intermediate Reduction/Waste Generated (Waste
ij
(k)
); and U
ij
(k)
and T
ij
(k)
are similarly
defined. The denominator is the amount of waste generated, rather than production output. The waste
generated is measured at the gate of an industrial process. Generated wastes are reduced (sludge
dewatering), recycled/reused, and finally disposed of (mainly by landfill). Waste reduction is often
undertaken in production processes, for example, for reducing the failure rate (or increasing yields) for
the processes.