Environmental Management in Practice Part 12 docx
Bạn đang xem bản rút gọn của tài liệu. Xem và tải ngay bản đầy đủ của tài liệu tại đây (839.08 KB, 30 trang )
The Statistical Distributions of Industrial Wastes:
an Analysis of theJapanese Establishment Linked Input-output Data
321
rate W/x.
4
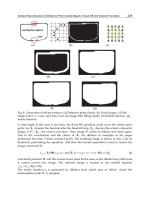
We find that six out of seven wastes show the same statistical characteristics:
(1)the median is smaller than the mean; and (2)the distributions have a long tail. But iron-
steel slag (193 observations) has a nearly symmetric distribution as shown in Figure 4a.
According to the central limit theorem, the distribution of a sample mean with a finite
variance converges to the normal distribution. But our statistical test of the goodness of fit
does not support gamma or normal distributions. The convergence in distribution to the
normal distribution is not seen for distributions of other wastes either as shown in Figure
4b. The distribution for a positive random variable becomes exponential at the maximum
entropy; in the present case a statistical test rejects the exponential distribution also.
2.50% 5% Median
95% 97.50% Mean
Inorganic sludge
0.0073 0.0089 0.0343 0.2271 0.5347 0.0887
Sludge of polishing sand
0.0055 0.0071 0.0396 1.0490 1.1367 0.1888
Waste plastics
0.0062 0.0074 0.0227 0.0822 0.1100 0.0322
Waste paper
0.0024 0.0029 0.0156 0.4156 0.5044 0.0714
Scrap iron
0.0097 0.0119 0.0431 0.1666 0.2272 0.0623
Scrap glass
0.0001 0.0001 0.0007 0.0292 0.0822 0.0110
Iron-steel slag
1.4132 1.4787 1.9442 2.6046 2.7613 1.9810
Table 3. Simulated confidence intervals and the mean for unit waste generation rate W/x
Results for the distributions of the recycling rate using the same procedure as before are
given in Table 4 and Figures 5a and 5b. Compared to distributions for the waste generation
rates, distributions for the recycling rates are nearly symmetric. And the figures are clearly
different from those given in Figure 2 for population the distributions (histograms) of the
waste generation rate. This difference arises because, in case of distributions for recycling
rates, there is the effect of aggregation of recycling rates. The sample mean is almost the
same value as the sample median in Table 4. We can conclude that, for the distributions for
recycling rates,
U/W, for all sectors, observed values are close to both the mean and median
of the simulated value and their confidence intervals are symmetric.
These results on the distributions of unit waste generation rate
W/x and recycling rate U/W
imply that the potential problems in policy making from assuming the representative
(average) waste management activity come mostly from the distributions for unit waste
generation rates
W/x. The mean assumed in theory does not always reflect the typical
intensity of waste generation. It also means that regulations based on the mean of a
representative establishment does not always give effective regulations to the majority of
establishments. Most of the establishments can clear the regulation standard, because the
standard is based on the mean of the distribution. But as we have shown, the mean does not
capture the essential property of the distributions underlying the waste generation rate.
4
This is because
()
() () ()
()
() ()
k
kk k
ij
jij j
k
k
ij ij
kk
kk
jjj j
k
Waste
xWaste x
WW
xxx x
, generating Wij(k) from the
empirical distribution of Wij(k) and taking the weighted average gives Wij, which the Input-Output
calculation uses.
Environmental Management in Practice
322
a)
b)
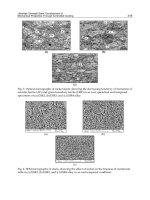
Fig. 4. a) Distributions for unit waste generation rates,
W/x, (bootstrapped weighted mean):
Scrap Iron (left) and Iron-Steel Slag (right) b) Distributions for unit waste generation rates,
W/x, (bootstrapped weighted mean): Waste plastics (left) and Wastepaper (right)
2.50% 5% Median
95% 97.50% Mean
Inorganic sludge
0.398 0.414 0.513 0.609 0.626 0.513
Sludge of polishing sand
0.158 0.212 0.513 0.825 0.861 0.513
Waste plastics
0.546 0.552 0.584 0.616 0.622 0.584
Waste paper
0.730 0.741 0.791 0.831 0.837 0.789
Scrap iron
0.894 0.905 0.953 0.974 0.977 0.949
Scrap glass
0.436 0.480 0.677 0.858 0.886 0.679
Iron-steel slag
0.798 0.822 0.920 0.979 0.984 0.913
Table 4. Simulated confidence interval and mean of the recycling rate U/ W
The Statistical Distributions of Industrial Wastes:
an Analysis of theJapanese Establishment Linked Input-output Data
323
Iron-Steel Slag
Frequency
0.5 0.6 0.7 0.8 0.9 1.0
0 50 100 150 200
a)
Waste Plastics
Frequency
0.5 0.6 0.7 0.8 0.9 1.0
0 20406080100
Wastepaper
Frequency
0.5 0.6 0.7 0.8 0.9 1.0
0 50 100 150
B)
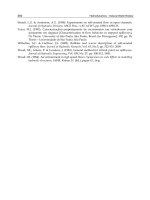
Fig. 5 a. Distribution of recycling rate
U/W (bootstrapped weighted mean): Scrap Iron (left),
and Iron-Steel Slag (right)b. Distribution of recycling rate
U/W (bootstrapped weighted
mean): Waste plastics (left), and Wastepaper (right)
3.2 Upstream waste generation: Calculation from the input-output analysis
The second objective of this paper is to estimate the amounts of waste generated in various
stages of production along a supply chain, starting from downstream production the final
product to upstream production of supplies. We us the I-O table linked to the WBS data set
explained in Section 2.1 above. Tables 5a and 5b, respectively, describe the total amounts of
wastes generated average production supply chains for cellular phones and passenger car
production in Japan in 2000. In both cases, pig iron is the most significant contributor of
industrial waste. This is because production of pig iron generates heavy wastes such as
iron-steel slag. The second most significant contributor is electricity for cell phones and
passenger car final assembly for passenger cars. The total amounts of wastes generated are
about 410 thousand tonnes for cellular phones and over 9 million tonnes for passenger car
production. The cellular phone assembly sector generates relatively small amounts of
wastes but the passenger car assembly sector generates large amounts of wastes.
Environmental Management in Practice
324
One of the most important wastes generated in producing pig iron is iron-steel slag, whose
unit generation rate distributes in a rather narrow range, has a symmetric distribution as
shown in Figure 4a and its variance is smaller compared to other wastes generated in any
other sectors. Unit waste generation rate for iron and steel slag lies between 1.4132 and
2.7613 at a 95% level (Table 3).
Cellular phone production supply chain in Japan, 2000:
final assembly and associated indirect (induced) stages of
production by upstream suppliers
Total amounts of wastes
and by-products
generated in stages of a
supply chain (in tonnes)
Pig iron 44,620
Electricity
42,440
Other electronic components
35,617
Copper
26,882
Plastic products
22,913
Crude steel (converters) 18,306
Paper 17,331
Cellular phone
f
inal assembl
y
(direct sta
g
e)
13,434
Printing, plate making and book binding
13,367
Cyclic intermediates
12,002
Thermoplastics resins
9,258
Reuse and recycling 8,043
Aliphatic intermediates 7,925
Crude steel (electric furnaces)
7,782
Paperboard
6,832
Hot rolled steel
6,731
Cold-finished steel
6,151
Corrugated card board boxes 5,437
Petrochemical basic products 5,092
Lead and zinc (inc. regenerated lead)
4,490
Pulp
3,768
Other non-ferrous metals
3,696
Ferro alloys
3,621
Liquid crystal element 3,344
Integrated circuits 3,297
Other industrial inorganic chemicals
2,922
Iron and steel shearing and slitting
2,891
Electric wires and cables
2,802
Corrugated cardboard
2,791
Other metal products 2,601
D
irect (
f
inal assembl
y
o
f
cell phones)
13,433
Total (all sta
g
es o
f
p
roduction
suppl
y
chain combined)
410,713
Table 5a. Generated wastes and by-products induced by cellular phone production
The Statistical Distributions of Industrial Wastes:
an Analysis of theJapanese Establishment Linked Input-output Data
325
Passenger car production supply chain in Japan, 2000: final
assembly and associated indirect (induced) stages of production
by upstream suppliers
Total amounts of
wastes and by-
products generated in
stages of a supply
chain (in tonnes)
Pig iron 1,822,777
Passenger car final assembly (direct stage)
1,486,409
Crude steel (converters) 835,245
Motor vehicle parts and accessories 766,708
Electricity 422,843
Crude steel (electric furnaces) 365,982
Hot rolled steel 307,681
Internal combustion engines for motor vehicles and parts 276,001
Motor vehicle bodies 235,853
Cold-finished steel 200,976
Cast and forged materials (iron) 198,766
Ferro alloys 173,293
Coated steel 147,778
Reuse and recycling 132,619
Plastic products 120,871
Sheet glass and safety glass 108,440
Paper 89,860
Copper 84,560
Cyclic intermediates 81,456
Printing, plate making and book binding 70,531
Aliphatic intermediates 57,100
Thermoplastics resins 55,511
Synthetic rubber 46,305
Non-ferrous metal castings and forgings 44,044
Paperboard 39,111
Petrochemical basic products 37,843
Iron and steel shearing and slitting 37,178
Other metal products 37,135
Electrical equipment for internal combustion engines 36,679
Steel pipes and tubes 33,723
Direct (final assembly of passenger cars)
1,486,409
Total (all stages of production supply chain combined)
9,090,400
Table 5b. Generated wastes and by-products by Passenger Car production
Environmental Management in Practice
326
Electricity sector also generates a significant amount of waste material, fly ash. The
distribution for its unit waste generation rate is shown in Figure 6, with its 95% confidence
interval (0.040, 0.110). Another waste, ferroalloy slag is generated by production supply
chain stages for both cell phones and passenger cars. Its unit waste generation rate has a
rather irregular distribution as shown in Figure 6, with its 95% confidence interval being
very wide and given by (2.47, 34.96). This suggests that waste management policies based
on point estimates for the unit waste generation rate for ferroalloy waste may lead to quite
erroneous implications in practice.
We have shown that unit waste generation rates for various wastes generated by production
supply chains distribute in different manners, sometimes with large variances and
asymmetric ways. This means serious limitations about the accuracy of policy decision
making relying on point estimates for the waste generation by production supply chains as
we do in EIO-LCA and other types of life cycle analyses.
Given this limitation in mind, we may still be able to use information on waste generation in
upstream production stages. Table 6 shows the total amounts of all wastes combined and
amounts of CO
2
emissions in the final (direct) assembly stage, a few upstream stages and all
stages combined of the average production supply chain for passenger cars with 2000cc
engines. Table 6 gives information about the stages which generate more waste than others.
Generally waste materials tend to be generated evenly along stages of a supply chain while
CO
2
emissions tend to be generated more unevenly and fluctuate widely along stages of a
supply chain. From policy perspectives, we conclude that application of production process
LCA is more difficult for CO
2
emissions than for generation of the 37 waste materials.
Soot and Dust Fly Ash
Frequency
0.04 0.06 0.08 0.10 0.12 0.14 0.16
0 20 40 60 80 100 120 140
Ferroalloy Slag
Frequency
0 1020304050
0 50 100 150 200
Fig. 6. Distribution of the unit waste generation rate
W/x (bootstrapped weighted mean): Fly
ash (left) and ferroalloy slag (right)
The Statistical Distributions of Industrial Wastes:
an Analysis of theJapanese Establishment Linked Input-output Data
327
All wastes combined
(summed in weight)
Each Stage Cumulative
(in tonnes) (in tonnes) Ratio
direct stage (final assembly) 0.244 0.244 0.164
1st indirect stage
0.263 0.507 0.340
2nd indirect
0.226 0.733 0.491
3rd indirect
0.255 0.988 0.662
4th indirect
0.232 1.219 0.817
…… …… …… …
Total (all stages combined) 1.493 1
CO
2
emissions
Each Stage Cumulative
(in tonnes) (in tonnes) Ratio
Direct 0.108 0.108 0.020
1st Indirect 0.707 0.814 0.155
2nd Indirect 1.206 2.020 0.384
3rd Indirect 1.152 3.172 0.602
4th Indirect 0.897 4.069 0.773
…… … … …
Total 5.266 1
Table 6. Total wastes combines and CO
2
generated by stages of the average production
supply chain in Japan: passenger cars with 2000cc engines
4. Conclusion
Using the datasets that recently became available, we have obtained empirical distributions
for generation, recycling and landfill rates for the 37 types of waste materials that are
generated in the production processes of Japanese manufacturing establishments. Some of
the statistics reported are for the total amounts of all the wastes combined to save space.
Many empirical distributions obtained are not symmetric and have a long tail with the mean
much larger than the median, making it inappropriate for policy decision making based on
the mean generation rates. For example, if the regulation level is set at the industry mean, it
is likely that most establishments satisfy the regulation level without efforts while a few
large violators exceed the level by a big margin. In such a case it is more cost effective to set
the regulation standard at a level much higher than the mean, thus saving the monitoring
costs at most establishments while spending efforts to identify the few violators.
In the second part of the paper we have shown how to estimate the amounts of wastes
generated along stages of the average production supply chain and then given estimates for
production processes of cellular phones and passenger cars. We have repeated this for
emissions of carbon dioxide. In this supply chain analysis, we have shown that, given the
large amounts of wastes generated in stages of upstream production supply chains, it is
misleading to formulate waste management policies based only on the wastes generated in the
final demand stages of supply chains. Our estimation results suggest that, in setting waste
management policies, policy makers need to consider (1)not only the wastes generated from
the final assembly stage but also the wastes generated from upstream stages of production
supply chains and (2)such policies need to have different regulation standards for upstream
stages depending on the final sector product and also the waste being considered to be
Environmental Management in Practice
328
regulated. For example, we have found that the amounts of CO
2
emissions vary significantly
from one stage to another of the Japanese production supply chain for passenger cars.
5. Acknowledgments
This research was in part supported by the Keio University Fukuzawa Fund and the Social
Sciences and Humanities Research Council of Canada.
6. Endnotes
An earlier version of this paper was presented at the 18
th
International Input-Output
Association Conference held at the University of Sydney in Australia, June 20-25, 2010.
Preparation of the datasets used was done using Programming Language Pyhon 2.7 and
statistical analyses were done using R 2.12.1. Further details are available by e-mailing:
7. References
Baumol, W.J. & Wolff, E.N. (1994) A Key Role for Input-Output Analysis in Policy Design,
Vol.24, 93-113.
Calcott, P. & Walls, M. (2000) Can Downstream Waste Disposal Policies Encourage
Upstream „Design for Environment“? American Economic Review, Vol.90, 233-237.
The Clean Japan Center (2005 and 2006) CJC-0708 and CJC-0809. Available from
Eiocla.net www.eiocla.nt, Carnegie Mellon.
Fullerton, D. & Kinnaman, T.C. (1995) Garbage, Recycling, and Illicit Burning or Dumping,
Journal of Environmental Economics and Management, Vol.29, 78-91.
Greaker, M. & Rosendahl, K.E. (2008) Environmental Policy with Upstream Pollution Abatement
Technology Firms,
Journal of Environmental Economics and Management, Vol.56,246-259.
Hayami, H. & Nakamura, M. (2007) Greenhouse gas emissions in Canada and Japan: Sector-
specific estimates and managerial and economic implications.
Journal of
Environmental Management
, Vol. 85, 371-392.
Hendrickson, C. T.; Lave, L. B. & Matthews, H. S. (2006).
Environmental Life Cycle Assessment
of Goods and Services: An Input-Output Approach
, Resources for the Future Press,
ISBN-13 978-1933115245, Washington DC, USA.
Japan Ministry of Economy, Trade and Industry (METI) (2005 and 2006) the Waste and By-
Products Surveys on Establishments („Haikibutsu-Fukusanbutsu Hasseijoukyo-tou
no Chosa“).
Japan Ministry of Internal Affairs and Communications (2000 and 2005)
The Input Output
Tables.
Available from
Leontief, W. (1970) Environmental Repercussions and the Economic Structure: An Input-
Output Approach,
Review of Economics and Statistics, Vol.52, No.3, 262-271.
Nakamura, K.; Kinoshita, S. & Takatsuki, H. (1996) The Origin and Behavior of Lead, Cadmiun,
and Antimony in MSW Incinerator,
Waste Management, Vol.16 No.5/6, 509-517.
Suh, S., editor (2010)
Handbook of Input-Output Economics in Industrial Ecology, Springer,
ISBN-13 978-1402061547, New York, USA.
Walls, M. & Palmer, K. (2001) Upstream Pollution, Downstream Waste Disposal, and the
Design of Comprehensive Environmental Policies,
Journal of Environmental
Economics and Management
, Vol. 41, 94-108.
17
The Effects of Paper Recycling
and its Environmental Impact
Iveta Čabalová, František Kačík, Anton Geffert and Danica Kačíková
Technical University in Zvolen, Faculty of Wood Sciences and Technology
Slovakia
1. Introduction
It is well known the paper production (likewise the other brands of industry) has enormous
effects on the environment. The using and processing of raw materials has a variety of
negative effects on the environment.
At the other hand there are technologies which can moderate the negative impacts on the
environment and they also have a positive economical effect. One of these processes is the
recycling, which is not only the next use of the wastes. The main benefit of the recycling is a
double decrease of the environment loading, known as an environmental impact reducing.
From the first view point, the natural resources conserves at side of the manufacturing
process inputs, from the second view point, the harmful compounds amount leaking to the
environment decreases at side of the manufacturing process outputs.
The paper production from the recycled fibers consumes less energy; conserves the natural
resources viz. wood and decreases the environmental pollution. The conflict between
economic optimization and environmental protection has received wide attention in recent
research programs for waste management system planning. This has also resulted in a set of
new waste management goals in reverse logistics system planning. Pati et al. (2008) have
proposed a mixed integer goal programming (MIGP) model to capture the inter-
relationships among the paper recycling network system. Use of this model can bring
indirectly benefit to the environment as well as improve the quality of waste paper reaching
the recycling unit.
In 2005, the total production of paper in Europe was 99.3 million tonnes which generated 11
million tonnes of waste, representing about 11% in relation to the total paper production.
The production of recycled paper, during the same period, was 47.3 million tonnes
generating 7.7 million tonnes of solid waste (about 70% of total generated waste in
papermaking) which represents 16% of the total production from this raw material (CEPI
2006).
The consumption of recovered paper has been in continuous growth during the past
decades. According to the Confederation of European Paper Industries (CEPI), the use of
recovered paper was almost even with the use of virgin fiber in 2005. This development has
been boosted by technological progress and the good price competitiveness of recycled
fiber, but also by environmental awareness – at both the producer and consumer ends – and
regulation that has influenced the demand for recovered paper. The European paper
industry suffered a very difficult year in 2009 during which the industry encountered more
Environmental Management in Practice
330
down-time and capacity closures as a result of the weakened global economy. Recovered
paper utilisation in Europe decreased in 2009, but exports of recovered paper to countries
outside CEPI continued to rise, especially to Asian markets (96.3%). However, recycling rate
expressed as “volume of paper recycling/volume of paper consumption” resulted in a
record high 72.2% recycling rate after having reached 66.7% the year before (Fig. 1) (Hujala
et al. 2010; CEPI 2006; European Declaration on Paper Recycling 2010; Huhtala &
Samakovlis 2002; CEPI Annual Statistic 2010).
Fig. 1. European paper recycling 1995-2009 in million tonnes (European Declaration on
Paper Recycling 2006 – 2010, Monitoring Report 2009 (2010) (www.erpa.info)
Recycling is not a new technology. It has become a commercial proposition since Matthias
Koops established the Neckinger mill, in 1826, which produced white paper from printed
waste paper. However, there were very few investigations into the effect of recycling on
sheet properties until late 1960's. From then until the late 1970's, a considerable amount of
work was carried out to identify the effects of recycling on pulp properties and the cause of
these effects (Nazhad 2005; Nazhad & Paszner 1994). In the late 1980's and early 1990's,
recycling issues have emerged stronger than before due to the higher cost of landfills in
developed countries and an evolution in human awareness. The findings of the early 70's on
recycling effects have since been confirmed, although attempts to trace the cause of these
effects are still not resolved (Howard & Bichard 1992).
Recycling has been thought to reduce the fibre swelling capability, and thus the flexibility of
fibres. The restricted swelling of recycled fibres has been ascribed to hornification, which
has been introduced as a main cause of poor quality of recycled paper (Scallan & Tydeman
1992). Since 1950's, fibre flexibility among the papermakers has been recognized as a main
source of paper strength. Therefore, it is not surprising to see that, for over half a century,
papermakers have supported and rationalized hornification as a main source of tensile loss
due to drying, even though it has never been fully understood (Sutjipto et al. 2008).
Recycled paper has been increasingly produced in various grades in the paper industry.
However, there are still technical problems including reduction in mechanical strength for
The Effects of Paper Recycling and its Environmental Impact
331
recycled paper. Especially, chemical pulp-origin paper, that is, fine paper requires a certain
level of strength. Howard & Bichard (1992) reported that beaten bleached kraft pulp
produced handsheets which were bulky and weak in tensile and burst strengths by
handsheet recycling. This behaviour could be explained by the reduction in re-swelling
capability or the reduction in flexibility of rewetted pulp fibers due to fiber hornification
and, possibly, by fines loss during recycling processes, which decrease both total bonding
area and the strength of paper (Howard 1995; Nazhad & Paszner 1994; Nazhad et al. 1995;
Khantayanuwong et al. 2002; Kim et al. 2000).
Paper recycling is increasingly important for the sustainable development of the paper
industry as an environmentally friendly sound. The research related to paper recycling is
therefore increasingly crucial for the need of the industry. Even though there are a number
of researches ascertained the effect of recycling treatment on properties of softwood pulp
fibres (Cao et al. 1999; Horn 1975; Howard & Bichard 1992; Jang et al. 1995), however, it is
likely that hardwood pulp fibres have rarely been used in the research operated with
recycling treatment. Changes in some morphological properties of hardwood pulp fibres,
such as curl, kink, and length of fibre, due to recycling effects also have not been determined
considerably. This is possibly because most of the researches were conducted in the
countries where softwood pulp fibres are commercial extensively (Khantayanuwong 2003).
Therefore, it is the purpose of the present research to crucially determine the effect of
recycling treatment on some important properties of softwood pulp fibres.
2. Alterations of pulp fibres properties at recycling
The goal of a recycled paper or board manufacturer is to make a product that meets
customers΄ specification and requirements. At the present utilization rate, using recycled
fibres in commodity grades such as newsprint and packaging paper and board has not
caused noticeable deterioration in product quality and performance (Čabalová et al. 2009).
The expected increase in recovery rates of used paper products will require a considerable
consumption increase of recycled fibres in higher quality grades such as office paper and
magazine paper. To promote expanded use of recovered paper, understanding the
fundamental nature of recycled fibres and the differences from virgin fibres is necessary.
Essentially, recycled fibres are contaminated, used fibres. Recycled pulp quality is, therefore,
directly affected by the history of the fibres, i.e. by the origins, processes and treatments
which these fibres have experienced.
McKinney (1995) classified the history into five periods:
1. fibre furnish and pulp history
2. paper making process history
3. printing and converting history
4. consumer and collection history
5. recycling process history.
To identity changes in fibre properties, many recycling studies have occurred at laboratory.
Realistically repeating all the stages of the recycling chain is difficult especially when
including printing and deinking. Some insight into changes in fibre structure, cell wall
properties, and bonding ability is possible from investigations using various recycling
procedures, testing methods, and furnishes.
Mechanical pulp is chemically and physically different from chemical pulp then recycling
effect on those furnishes is also different. When chemical fibres undergo repeated drying
Environmental Management in Practice
332
and rewetting, they are hornified and can significantly lose their originally high bonding
potential (Somwand et al. 2002; Song & Law 2010; Kato & Cameron 1999; Bouchard &
Douek 1994; Khantayanuwong et al. 2002; Zanuttini et al. 2007; da Silva et al. 2007). The
degree of hornification can be measured by water retention value (WRW) (Kim et al. 2000).
In contrast to the chemical pulps, originally weaker mechanical pulps do not deteriorate but
somewhat even improve bonding potential during a corresponding treatment. Several
studies (Maloney et al. 1998; Weise 1998; Ackerman et al. 2000) have shown good
recyclability of mechanical fibres.
Adámková a Milichovský (2002) present the dependence of beating degree (°SR – Schopper-
Riegler degree) and WRV from the relative length of hardwood and softwood pulps. From
their results we can see the WRV increase in dependence on the pulp length alteration is
more rapid at hardwood pulp, but finally this value is higher at softwood pulps. Kim et al.
(2000) determined the WRV decrease at softwood pulps with the higher number of recycling
(at zero recycling about cca 1.5 g/g at fifth recycling about cca 1.1 g/g). Utilisation of the
secondary fibres to furnish at paper production decrease of the initial need of woody raw
(less of cutting tress) but the paper quality is not significantly worse.
2.1 Paper recycling
The primary raw material for the paper production is pulps fibres obtaining by a
complicated chemical process from natural materials, mainly from wood. This fibres
production is very energy demanding and at the manufacturing process there are used
many of the chemical matters which are very problematic from view point of the
environment protection. The suitable alternative is obtaining of the pulp fibres from already
made paper. This process is far less demanding on energy and chemicals utilisation. The
paper recycling, simplified, means the repeated defibring, grinding and drying, when there
are altered the mechanical properties of the secondary stock, the chemical properties of
fibres, the polymerisation degree of pulp polysaccharidic components, mainly of cellulose,
their supramolecular structure, the morphological structure of fibres, range and level of
interfibres bonds e.g The cause of above mentioned alterations is the fibres ageing at the
paper recycling and manufacturing, mainly the drying process.
At the repeat use of the secondary fibres, it need deliberate the paper properties alter due to
the fiber deterioration during the recycling, when many alteration are irreversible. The
alteration depth depends on the cycle’s number and way to the fibres use. The main
problem is the decrease of the secondary pulp mechanical properties with the continuing
recycling, mainly the paper strength (Khantayanuwong et al. 2002; Jahan 2003; Hubbe &
Zhang 2005; Garg & Singh 2006; Geffertová et al. 2008; Sutjipto et al. 2008). This decrease is
an effect of many alterations, which can but need not arise in the secondary pulp during the
recycling process. The recycling causes the hornification of the cell walls that result in the
decline of some pulp properties. It is due to the irreversible alterations in the cells structure
during the drying (Oksanen et al. 1997; Kim et al. 2000; Diniz et al. 2004).
The worse properties of the recycled fibres in comparison with the primary fibres can be
caused by hornification but also by the decrease of the hydrophilic properties of the fibres
surface during the drying due to the redistribution or migration of resin and fat acids to the
surface (Nazhad & Paszner 1994; Nazhad 2005). Okayama (2002) observed the enormous
increase of the contact angle with water which is related to the fiber inactivation at the
recycling. This process is known as „irreversible hornification“.
The Effects of Paper Recycling and its Environmental Impact
333
Paper recycling saves the natural wood raw stock, decreases the operation and capital costs
to paper unit, decrease water consumption and last but not least this paper processing gives
rise to the environment preservation (e.g. 1 t of waste paper can replace cca 2.5 m
3
of wood).
A key issue in paper recycling is the impact of energy use in manufacturing. Processing
waste paper for paper and board manufacture requires energy that is usually derived from
fossil fuels, such as oil and coal. In contrast to the production of virgin fibre-based chemical
pulp, waste paper processing does not yield a thermal surplus and thus thermal energy
must be supplied to dry the paper web. If, however, the waste paper was recovered for
energy purposes the need for fossil fuel would be reduced and this reduction would have a
favourable impact on the carbon dioxide balance and the greenhouse effect. Moreover, pulp
production based on virgin fibres requires consumption of round wood and causes
emissions of air-polluting compounds as does the collection of waste paper. For better paper
utilization, an interactive model, the Optimal Fibre Flow Model, considers both a quality
(age) and an environmental measure of waste paper recycling was developed (Byström &
Lönnstedt 1997).
2.1.1 Influence of beating on pulp fibres
Beating of chemical pulp is an essential step in improving the bonding ability of fibres. The
knowledge complete about beating improves the present opinion of the fibres alteration at
the beating. The main and extraneous influences of the beating device on pulps were
defined. The main influences are these, each of them can be improve by the suitable beating
mode, but only one alteration cannot be attained. Known are varieties of simultaneous
changes in fibres, such as internal fibrilation, external fibrilation, fiber shortening or cutting,
and fines formation (Page 1989; Kang & Paulapuro 2006a; Kang & Paulapuro 2006c).
Freeing and disintegration of a cell wall affiliated with strong swelling expressed as an
internal fibrilation and delamination. The delamination is a coaxial cleavage in the
middle layer of the secondary wall. It causes the increased water penetration to the cell
wall and the fibre plasticizing.
External fibrillation and fibrils peeling from surface, which particularly or fully attacks
primary wall and outside layers of secondary walls. Simultaneously from the outside
layers there are cleavage fibrils, microfibrils, nanofibrils to the macromolecule of
cellulose and hemicelluloses.
Fibres shortening in any place in any angle-wise across fibre in accordance with
loading, most commonly in weak places.
Concurrently the main effects at the beating also the extraneous effects take place, e.g.
fines making, compression along the fibres axis, fibres waving due to the compression.
It has low bonding ability and it influences the paper porosity, stocks freeness (Sinke &
Westenbroek 2004).
The beating causes the fibres shortening, the external and internal fibrillation affiliated with
delamination and the fibres plasticizing. The outside primary wall of the pulp fibre leaks
water little, it has usually an intact primary layer and a tendency to prevent from the
swelling of the secondary layer of the cell wall. At the beating beginning there are
disintegrated the fibre outside layers (P and S1), the fibrilar structure of the fibre secondary
layer is uncovering, the water approach is improving, the swelling is taking place and the
fibrillation process is beginning. The fibrillation process is finished by the weaking and
cleavaging of the bonds between the particular fibrils and microfibrils of cell walls during
Environmental Management in Practice
334
the mechanical effect and the penetration into the interfibrilar spaces, it means to the
amorphous region, there is the main portion of hemicelluloses.
Češek & Milichovský (2005) showed that with the increase of pulp beating degree the
standard rheosettling velocity of pulp decreases more at the fibres fibrillation than at the
fibres shortening.
Refining causes a variety of simultaneous changes in the fiber structure, such as internal
fibrillation, external fibrillation and fines formation. Among these effects, swelling is
commonly recognized as an important factor affecting the strength of recycled paper (Kang
& Paulapuro 2006d).
Scallan & Tigerstrom (1991) observed the elasticity modulus of the long fibres from kraft
pulp during the recycling. Flexibility decrease was evident at the beating degree decrease
(°SR), and also with the increase of draining velocity of low-yield pulp.
80 °C
100 °C
120 °C
virgin pulp012345678
number of recycling
0
1
2
3
4
5
6
7
8
9
10
11
breaking length [km]
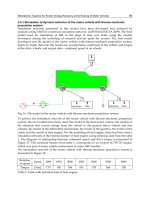
Fig. 2. Alteration of the breaking length of the paper sheet drying at the temperature of 80,
100 a 120 °C during eightfold recycling
properties
of paper sheets
by drying
temperature 80 °C
number of recycling
virgin
pulp
0 1 2 3 4 5 6 7 8
Breaking length
[km]
1.6 8.3 6.3 6.3 5.7 5.7 5.4 4.9 5.0 5.0
Tear index
[mN.m
2
/g]
1.6 2.1 2.5 2.7 2.8 2.8 2.5 3.1 2.7 2.7
Brightnees
[%MgO]
83.8 80.0
82.2
82.8
82.5
82.4
82.0
82.4
82.5 82.6
Opacity [%] 71.4 63.9
68.8
67.8
69.5
69.1
70.0
70.1
69.1 70.3
DP by viscometry
699 666 661 663 653 642 642 608 607 611
DP by SEC 1138 1128
1126
1136
1115
1106
1094
1069
1053 1076
The Effects of Paper Recycling and its Environmental Impact
335
properties
of paper sheets
by drying
temperature
100 °C
number of recycling
virgin
pulp
0 1 2 3 4 5 6 7 8
Breaking length
[km]
1.5 9.1 7.1 6.5 5.4 5.0 4.3 4.4 4.2 4.0
Tear index
[mN.m
2
/g]
1.5 2.2 2.3 2.6 2.7 2.9 2.7 3.0 2.8 2.7
Brightnees
[%MgO]
83.4 81.0
81.8
81.8
82.9
82.4
82.8
82.5
82.3 82.4
Opacity [%] 72.0 64.4
67.7
68.5
69.3
70.1
70.8
71.0
71.1 71.2
DP by viscometry
699 689 688 680 650 672 660 646 636 624
DP by SEC 1138 1012
1010
938 923 918 901 946 942 941
properties
of paper sheets
by drying
temperature
120 °C
number of recycling
virgin
pulp
0 1 2 3 4 5 6 7 8
Breaking length
[km]
1.4 8.4 6.0 4.9 4.2 4.2 4.0 4.0 4.0 3.7
Tear index
[mN.m
2
/g]
1.4 2.1 2.5 2.7 2.8 2.9 2.7 3.1 2.7 2.7
Brightnees
[%MgO]
83.2 79.8
80.6
80.5
81.3
81.2
81.3
81.1
81.1 80.7
Opacity [%] 72.9 65.4
69.0
70.7
71.6
71.7
72.4
72.6
72.4 72.8
DP by viscometry
699 677 665 658 675 677 672 658 673 662
DP by SEC 1138 1030
1015
1059
1042
950 947 945 944 933
Table 1,2,3. The selected properties of the pulp fibres and the paper sheets during the
process of eightfold recycling at three drying temperatures of 80 °C, 100 °C a 120 °C.
From the result on Fig. 2 we can see the increase of the pulp fibres active surface takes place
during the beating process, which results in the improve of the bonding and the paper
strength after the first beating. It causes also the breaking length increase of the laboratory
sheets. The secondary fibres wear by repeated beating, what causes the decrease of strength
values (Tab. 1,2,3).
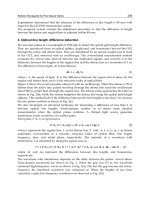
The biggest alterations of tear index (Fig. 3) were observed after fifth recycling at the
bleached softwood pulp fibres. The first beating causes the fibrillation of the outside layer of
the cell wall, it results in the formation of the mechanical (felting) and the chemical bonds
between the fibres. The repeated beating and drying dues, except the continuing fibrillation
of the layer, the successive fibrils peeling until the peeling of the primary and outside
Environmental Management in Practice
336
secondary layer of the cell wall. It discovers the next non-fibriled layer S2 (second, the
biggest layer of the secondary wall) what can do the tear index decrease. The next beating
causes also this layer fibrillation, which leads to the increase of the strength value (Fig. 3,
Tab. 1,2,3). Paper strength properties such as tensile strength and Scott bond strength were
strongly influenced by internal fibrillation; these could also be increased further by
promoting mostly external fibrillation (Kang & Paulapuro 2006b).
The course of the breaking length decrease and the tearing strength increase of the paper
sheet is in accordance with the results of Sutjipto et al. (2008) at the threefold recycling of the
bleached (88 % ISO) softwood pulps prepared at the laboratory conditions, beated on PFI
mill to 25 °SR.
80 °C
100 °C
120 °C
virgin pulp012345678
number of recycling
0,5
1,0
1,5
2,0
2,5
3,0
3,5
4,0
tear index [mN.m
2
/g]
Fig. 3. Tear index alteration of the paper sheets drying at the temperature of 80, 100 a 120 °C,
during eightfold recycling
Song & Law (2010) observed kraft pulp oxidation and its influence on recycling
characteristics of fibres, the found up the fibre oxidation influences negatively the tear index
of paper sheets. Oxidation of virgin fibre prior to recycling minimized the loss of WRV and
sheet density.
The beating causes the fibres shortening and fines formation which is washed away in the
large extent and it endeds in the paper sludges. This waste can be further processed and
effective declined.
Within the European Union several already issued and other foreseen directives have great
influence on the waste management strategy of paper producing companies. Due to the
large quantities of waste generated, the high moisture content of the waste and the changing
composition, some recovery methods, for example, conversion to fuel components, are
simply too expensive and their environmental impact uncertain. The thermal processes,
gasification and pyrolysis, seem to be interesting emerging options, although it is still
necessary to improve the technologies for sludge application. Other applications, such as the
hydrolysis to obtain ethanol, have several advantages (use of wet sludge and applicable
technology to sludges) but these are not well developed for pulp and paper sludges.
The Effects of Paper Recycling and its Environmental Impact
337
Therefore, at this moment, the minimization of waste generation still has the highest priority
(Monte et al. 2009).
2.1.2 Drying influence on the recycled fibres
Characteristic differences between recycled fibres and virgin fibres can by expected. Many
of these can by attributed to drying. Drying is a process that is accompanied by partially
irreversible closure of small pores in the fibre wall, as well as increased resistance to
swelling during rewetting. Further differences between virgin and recycled fibres can be
attributed to the effects of a wide range of contaminating substances (Hubbe et al. 2007).
Drying, which has an anisotropic character, has a big influence on the properties of paper
produced from the secondary fibres. During the drying the shear stress are formatted in the
interfibrilar bonding area. The stresses formatted in the fibres and between them effect the
mechanical properties in the drying paper. The additional effect dues the tensioning of the
wet pulp stock on the paper machine.
During the drying and recycling the fibres are destructed. It is important to understand the
loss of the bonding strength of the drying chemical fibres. Dang (2007) characterized the
destruction like a percentage reduction of ability of the water retention value (WRV) in pulp
at dewatering.
Hornification = [(WRV
0
-WRV
1
)/WRV
0
]. 100 [%],
WRV
0
– is value of virgin pup
WRV
1
– the value of recycled pulp after drying and reslushing.
According to the prevailing concept, hornification occurs in the cell wall matrix of chemical
fibres. During drying, delaminated parts of the fiber wall, i.e., cellulose microfibrils become
attached as Fig. 4 shows (Ackerman et al. 2000).
Fig. 4. Changes in fiber wall structure
(Weise & Paulapuro 1996)
Fig. 5. Shrinkage of a fiber cross section
(Ackerman et al. 2000)
Hydrogen bonds between those lamellae also form. Reorientation and better alignment of
microfibrils also occur. All this causes an intensely bonded structure. In a subsequent
Environmental Management in Practice
338
reslushing in water, the fiber cell wall microstructure remains more resistant to
delaminating forces because some hydrogen bonds do not reopen. The entire fiber is stiffer
and more brittle (Howard 1991). According to some studies (Bouchard & Douek 1994;
Maloney et al. 1998), hornification does not increase the crystallinity of cellulose or the
degree of order in the hemicelluloses of the fiber wall.
Fig. 6. The drying model of Scallan (Laivins & Scallan 1993) suggests that hornification
prevents the dry structure in A from fully expanding to the wet structure in D. Instead, only
partial expansion to B may be possible after initial drying creates hydrogen bonds between
the microfibrils (Kato & Cameron 1999)
Weise & Paulapuro (1996) did very revealing work about the events during fiber drying.
They studied fiber cross section of kraft fibers in various solids by Confocal Laser Scanning
Microscope (CLSM) and simultaneously measured hornification with WRV tests.
Irreversible hornification of fibers began on the degree of beating. It does not directly follow
shrinkage since the greatest shrinkage of fibers occurs above 80 % solids content. In Figs. 4
and 5, stage A represented wet kraft fiber before drying. In stage B, the drainage has started
to cause morphological changes in the fiber wall matrix at about 30 % solids content. The
fiber wall lamellae start to approach each other because of capillary forces. During this
stage, the lumen can collapse. With additional drying, spaces between lamellae continue
shrinking to phase C where most free voids in the lamellar structure of the cell wall have
already closed. Toward the end of drying in stage D, the water removal occurs in the fine
structure of the fiber wall. Kraft fiber shrink strongly and uniformly during this final phase
of drying, i.e., at solid contents above 75-80 %. The shrinkage of stage D is irreversible.
At a repeated use of the dried fibres in paper making industry, the cell walls receive the
water again. Then the opposite processes take place than in the Fig. 4 and 5. It show
Scallan´s model of the drying in Fig. 6.
The drying dues also macroscopic stress applied on paper and distributed in fibres system
according a local structure.
2.1.3 Properties of fibres from recycled paper
The basic properties of origin wet fibres change in the drying process of pulp and they are
not fully regenerated in the process of slushing and beating.
The same parameters are suitable for the description of the paper properties of secondary
fibres and fibres at ageing as well as for description of primary fibres properties. The
The Effects of Paper Recycling and its Environmental Impact
339
experiences obtained at the utilisation of waste paper showed the secondary fibres have
very different properties from the origin fibres. Next recycling of fibres causes the formation
of extreme nonhomogeneous mixture of various old fibres. At the optimum utilisation of the
secondary fibres it need take into account their altered properties at the repeated use. With
the increase number of use cycles the fibres change irreversible, perish and alter their
properties. Slushing and beating causes water absorption, fibres swelling and a partial
regeneration of properties of origin fibres. However the repeated beating and drying at the
multiple production cycles dues the gradual decrease of swelling ability, what influences a
bonding ability of fibres. With the increase of cycles number the fibres are shortened. These
alterations express in paper properties. The decrease of bonding ability and mechanical
properties bring the improving of some utility properties. Between them there is higher
velocity of dewatering and drying, air permeability and blotting properties improve of light
scattering, opacity and paper dimensional stability.
The highest alterations of fibres properties are at the first and following three cycles. The
size of strength properties depends on fibres type (Geffertová et al. 2008).
Drying influences fibres length, width, shape factor, kinks which are the important factors to
the strength of paper made from recycled fibres. The dimensional characteristics are
measured by many methods, known is FQA (Fiber Quality Analyser), which is a prototype
IFA (Imaging Fiber Analyser) and also Kajaani FS-200 fibre-length analyser. They measure
fibres length, different kinks and their angles. Robertson et al. (1999) show correlation
between methods FQA and Kajaani FS-200. A relatively new method of fibres width
measurement is also SEM (Scanning Electron Microscope) (Bennis et al. 2010). Among
devices for analyse of fibres different properties and characteristics, e.g. fibres length and
width, fines, various deformations of fibres and percentage composition of pulp mixture is
L&W Fiber Tester (Lorentzen & Wettre, Sweden). At every measurement the minimum of
20 000 fibres in a sample is evaluated. On Fig. 7 there is expressed the alteration of fibres
average length of softwood pulps during the eightfold recycling at the different drying
temperature of pulp fibres.
Fig. 7. Influence of recycling number and drying temperature on length of softwood pulps
1.5
1.6
1.7
1.8
1.9
2
2.1
2.2
2.3
virgin
pulp
012345678
80 °C
100°C
120 °C
average length of fibres
[mm]
number of recycling
Environmental Management in Practice
340
Fig. 8. Influence of recycling number and drying temperature on width of softwood pulps
The biggest alteration were observed after first beating (zero recycling), when the fibres
average length decrease at the sheet drying temperature of 80 °C about 17%, at the
temperature of 100 °C about 15.6% and at the temperature of 120 °C about 14.6%.
After the first beating the fibres average width was markedly increased at the all
temperatures dues to the fibrillation influence. The fibres fibrillation causes the fibre surface
increase. Following markedly alteration is observed after fifth recycling, when the fibres
average width was decreased. We assume the separation of fibrils and microfibrils from the
cell walls dues the separation of the cell walls outside layer, the inside nonfibriled wall S2
was discovered and the fibres average width decreased. After the fifth recycling the strength
properties became worse, mainly tear index (Fig. 3).
The softwood fibres are longer than hardwood fibres, they are not so straight. The high
value of shape factor means fibres straightness. The biggest alterations of shape factor can be
observed mainly at the high drying temperatures. The water molecules occurring on fibres
surface quick evaporate at the high temperatures and fibre more shrinks. It can result in the
formation of weaker bonds between fibres those surfaces are not enough near. At the
beginning of wet paper sheet drying the hydrogen bond creates through water layer on the
fibres surface, after the drying through monomolecular layer of water, finally the hydrogen
bond results after the water removal and the surfaces approach. It results in destruction of
paper and fibre at the drying.
Chemical pulp fines are an important component in papermaking furnish. They can
significantly affect the mechanical and optical properties of paper and the drainage
properties of pulp (Retulainen et al. 1993). Characterizing the fines will therefore allow a
better understanding of the role of fines and better control the papermaking process and the
properties of paper. Chemical pulp fines retard dewatering of the pulp suspension due to
the high water holding capacity of fines. In the conventional method for characterizing the
role of fines in dewatering, a proportion of fines is added to the fiber furnish, and then only
the drainage time. Fines suspension is composed of heterogeneous fines particles in water.
The suspension exhibits different rheological characteristics depending on the degree of
interaction between the fines particles and on their hydration (Kang & Paulapuro 2006b).
From Fig. 9 we can see the highest formation of fines were after seventh and eight recycling,
when the fibres were markedly weakened by the multiple using at the processes of paper
25.0
25.5
26.0
26.5
27.0
27.5
28.0
virgin
pulp
012345678
80 °C
100 °C
120 °C
average width of fibres
[μm]
number of recycling
The Effects of Paper Recycling and its Environmental Impact
341
making. They are easier and faster beating (the number of revolution decreased by the
higher number of the recycling).
Fig. 9. Influence of recycling process and drying temperature on pulp fines changes
The macroscopic level (density, volume, porosity, paper thickness) consists from the
physical properties very important for the use of paper and paperboard. They indirectly
characterize the three dimensional structure of paper (Niskanen 1998). A paper is a complex
structure consisting mainly of a fibre network, filler pigment particles and air. Light is
reflected at fibre and pigment surfaces in the surface layer and inside the paper structure.
The light also penetrates into the cellulose fibres and pigments, and changes directions.
Some light is absorbed, but the remainder passes into the air and is reflected and refracted
again by new fibres and pigments. After a number of reflections and refractions, a certain
proportion of the light reaches the paper surface again and is then reflected at all possible
angles from the surface. We do not perceive all the reflections and refractions (the multiple
reflections or refractions) which take place inside the paper structure, but we perceive that
the paper has a matt white surface i.e. we perceive a diffuse surface reflection. Some of the
incident light exists at the back of the paper as transmitted light, and the remainder has been
absorbed by the cellulose and the pigments. Besides reflection, refraction and absorption,
there is a fourth effect called diffraction. In other contexts, diffraction is usually the same
thing as light scattering, but within the field of paper technology, diffraction is only one
aspect of the light scattering phenomenon. Diffraction occurs when the light meets particles
or pores which are as large as or smaller then the wavelength of the light, i.e. particles which
are smaller than one micrometer (μm). These small elements oscillate with the light
oscillation and thus function as sites for new light sources. When the particles or pores are
smaller than half of the light wavelength the diffraction decreases. It can be said that the
light passes around the particle without being affected (Pauler 2002).
The opacity, brightness, colouring and brilliance are important optical properties of papers
and paperboards. For example the high value of opacity is need at the printing papers, but
opacity of translucent paper must be lower. The paper producer must understand the
physical principles of the paper structure and to determine their characteristics composition.
It is possible to characterize nondirect the paper structure. The opacity characterizes the
paper ability to hide a text or a figure on the opposite side of the paper sheet. The paper
1.5
2.0
2.5
3.0
3.5
4.0
4.5
virgin
pulp
012345678
80 °C
100 °C
120 °C
pulp fines [%]
number of recycling
Environmental Management in Practice
342
brightness is a paper reflection at a blue light use. The blue light is used because the made
fibers have yellowish colour and a human eye senses a blue tone like a white colour. The
typical brightness of the printing papers is 70 – 95% and opacity is higher than 90%
(Niskanen 1998).
3. Paper ageing
The recycled paper is increasingly used not only for the products of short term consumption
(newspaper, sanitary paper, packaging materials e.g.), but also on the production of the
higher quality papers, which can serve as a culture heritage medium. The study of the
recycled papers alterations in the ageing process is therefore important, but the information
in literature are missing.
The recycling is also another form of the paper ageing. It causes the paper alterations, which
results in the degradation of their physical and mechanical properties. The recycling causes
a chemical, thermal, biological and mechanical destruction, or their combination
(Milichovský 1994; Geffertová et al. 2008). The effect of the paper ageing is the degradation
of cellulose, hemicelluloses and lignin macromolecules, the decrease of low molecular
fractions, the degree of polymerisation (DP) decrease, but also the decline of the mechanical
and optical properties (El Ashmawy et al. 1974; Valtasaari & Saarela 1975; Lauriol et al.
1987a,b,c; Bansa 2002; Havermans 2003; Dupont & Mortha 2004; Kučerová & Halajová, 2009;
Čabalová et al. 2011). Cellulose as the most abundant natural polymer on the Earth is very
important as a renewable organic material. The degradation of cellulose based paper is
important especially in archives and museums where ageing in various conditions reduces
the mechanical properties and deteriorates optical quality of stored papers, books and other
artefacts. The low rate of paper degradation results in the necessity of using accelerating
ageing tests. The ageing tests consist in increasing the observed changes of paper properties,
usually by using different temperature, humidity, oxygen content and acidity, respectively.
Ageing tests are used in studies of degradation rate and mechanism. During the first ageing
stages—natural or accelerated—there are no significant variations in mechanical properties:
degradation evidence is only provided by measuring chemical processes. Oxidation induced
by environmental conditions, in fact, causes carbonyl and carboxyl groups formation, with
great impact on paper permanence and durability, even if mechanical characteristics are not
affected in the short term (Piantanida et al. 2005). During the degradation two main
reactions prevail – hydrolysis of glycosidic bonds and oxidation of glucopyranose rings. As
a result of some oxidation processes keto- and aldehyde groups are formed. These groups
are highly reactive; they are prone to crosslinking, which is the third chemical process of
cellulose decay (Bansa 2002, Calvini & Gorassini 2006).
At the accelerated paper ageing the decrease of DP is very rapid in the first stages of the
ageing, later decelerates. During the longer time of the ageing there was determined the
cellulose crosslinking by the method of size exclusion chromatography (SEC) (Kačík et al.
2009). The similar dependences were obtained at the photo-induced cellulose degradation
(Malesic et al. 2005).
An attention is pay to the kinetic of the cellulose degradation in several decades, this process
was studied by Kuhn in 1930 and the first model of the kinetic of the cellulose chains
cleavage was elaborated by Ekenstam in 1936. This model is based on the kinetic equation of
first-order and it is used to this day in modifications for the watching of the cellulose
degradation in different conditions. Hill et al. (1995) deduced a similar model with the
The Effects of Paper Recycling and its Environmental Impact
343
Fig. 10. Alterations of DP (degree of polymerisation) of cellulose fibres due to recycling and
ageing at the pulp fibres drying temperature of 80 °C, 100 °C a 120 °C.
contribution of the zero order kinetic. Experimental results are often controversial and new
kinetic model for explanation of cellulose degradation at various conditions was proposed
(Calvini et al. 2008). The first-order kinetic model developed by these authors suggests that
the kinetics of cellulose degradation depends upon the mode of ageing. An autoretardant
path is followed during either acid hydrolysis in aqueous suspensions or oven ageing, while
the production of volatile acid compounds trapped during the degradation in sealed
y = -2.1333x + 683.33
y = -10,22x + 603,3
450
500
550
600
650
700
750
virgin
pulp
012345678
DP
number of recycling
before ageing 80 °C
after ageing 80 °C
y = -7,842x + 707,5
y = -7,521x + 595,0
450
500
550
600
650
700
750
virgin
pulp
012345678
DP
number of recycling
before ageing 100
°C
y = -9,357x + 696,6
y = -2,975x + 579,6
450
500
550
600
650
700
750
virgin
pulp
012345678
DP
number of recycling
before ageing 120 °C
after ageing 120 °C
Environmental Management in Practice
344
environments primes an autocatalytic mechanism. Both these mechanisms are depleted by
the consumption of the glycosidic bonds in the amorphous regions of cellulose until the
levelling-off DP (LODP) is reached.
At the accelerated ageing of newspaper (Kačík et al. 2008), the cellulose degradation causes
the decrease of the average degree of polymerisation (DP). The DP decrease is caused by
two factors in accordance with equation
DP = LODP + DP01.e
-k1.t
+ DP02.e
-k2.t
,
where LODP is levelling-off degree of polymerisation. There is a first factor higher and
quick decreasing during eight days and a second factor is lower and slow decreasing and
dominant after eight days of the accelerating ageing in the equation. The number of
cleavaged bonds can be well described by equation
DP
0
/DP
t
– 1 = n
0
.(1-e
-k.t
),
where n
0
is an initial number of bonds available for degradation. The equation of the
regression function is in accordance with Calvini et al. (2007) proposal, the calculated value
(4.4976) is in a good accordance with the experimentally obtained average values of DP
0
a DP
60
(4.5057). The DP decreased to cca 38% of the initial value and the polydispersity degree
to 66% of the initial value. The decrease of the rate constant with the time of ageing was
obtained also by next authors (Emsley et al. 1997; Zervos & Moropoulou 2005; Ding & Wang
2007). Čabalová et al. (2011) observed the influence of the accelerated ageing on the recycled
pulp fibres, they determined the lowest decrease of DP at the fibres dried at the temperature
of 120 °C (Fig. 10).
The simultaneous influence of the recycling and ageing has the similar impact at the drying
temperatures of 80 °C (decrease about 27,5 %) and 100 °C (decrease about 27.6%) in regard
of virgin pulp, lower alterations were at the temperature of 120 °C (decrease about 21.5%).
The ageing of the recycled paper causes the decrease of the pulp fiber DP, but the paper
remains good properties.
4. Conclusion
The recycling is a necessity of this civilisation. The paper manufacturing is from its
beginning affiliated with the recycling, because the paper was primarily manufactured from
the 100 % furnish of rag. It is increasingly assented the trend of the recycled fibers use from
the European and world criterion. The present European papermaking industry is based on
the recycling.
The presence of the secondary fibres from the waste paper, their quality and amount is
various in the time intervals, the seasons and the regional conditions. It depends on the
manufacturing conditions in the paper making industry of the country.
At present the recycling is understood in larger sense than the material recycling, which has
a big importance from view point of the paper recycling. Repeatedly used fibres do not fully
regenerate their properties, so they cannot be recycled ad anfinitum. It allows to use the
alternative possibilities of the paper utilisation in the building industry, at the soil
reclamation, it the agriculture, in the power industry.
The most important aim is, however, the recycled paper utilisation for the paper
manufacturing.
The Effects of Paper Recycling and its Environmental Impact
345
5. Acknowledgment
This work was financed by the Slovak Grant Agency VEGA (project number 1/0490/09).
6. References
Ackerman, Ch., Göttsching, L. & Pakarinen, H. (2000). Papermaking potential of recycled fiber,
In: Göttsching, L. & Pakarinen, H. (eds.). Recycled Fiber and Deiking. Papermaking
Science and Technology. Finland. Chapter 10, pp. 358-438, ISBN 952 – 5216 – 07 – 1
(book 7)
Adámková, G. & Milichovský, M. (2002). Beating of Mixtures Hardwood and Softwood
Pulps. Papír a celulóza, 57(8), 2002, pp. 250 – 254, ISSN 0031 - 1421
Bansa, H. (2002). Accelerated Ageing of Paper: Some Ideas on its Practical Benefit.
Restaurator 23(2), 2002, pp. 106-117, ISSN 0034-5806
Bennis, H., Benslimane, R., Vicini, S., Mairani, A. & Princi, E. (2010). Fibre width
measurement and quantification of filler size distribution in paper-based materials
by SEM and image analysis. Journal of Electron Microscopy 59(2), 2010, pp. 91-102,
ISSN 0022-0744
Bouchard, J. & Douek, M. (1994). The effects of recycling on the chemical properties of
pulps. Journal of pulp and paper science 20(5), 1994, pp. 131-136, ISSN 0826-6220
Byström, S. & Lönnstedt, L. (1997). Paper recycling: environmental and economic impact.
Resources, Conservation and Recycling 21, 1997, pp. 109-127, ISSN 0921-3449
Calvini, P. & Gorassini A. (2006). On the rate of paper degradation: lessons from the past.
Restaurator 27, 2006, pp. 275–290, ISSN 0034-5806
Calvini, P., Gorassini, A. & Metlami, A. L. (2007). Autocatalytic Degradation of Celulose
Paper in DealerVessels. Restaurator 28, 2007, pp. 47-54 ISSN 0034-5806
Calvini, P., Gorassini, A. & Metlami, A. L. (2008). On the kinetics of cellulose degradation:
looking beyond the pseudo zero order rate equation. Cellulose 15, 2008, pp. 193–203,
ISSN 0969-0239
Cao, B., Tschirner, J. & Ramasway, S. (1999). Study of changes in wet- fiber flexibility and
surface condition of recycled fibers. Paperi ja Puu /Paper and Timber 81(2), 1999, pp.
117-122, ISSN 0031-1243
CEPI (Confederation of European Paper Industries). (2006). Special Recycling 2005 Statistics
- European Paper Industry Hits New Record in Recycling. 27.02.2011, Available
from: o/images/Special_Recycling_2005_statistics.pdf
CEPI (Confederation of European Paper Industrie). (2010). Annual Statistic 2009. 27.02.2011,
Available from:
o/download/CEPI_annual_statistics%202009.pdf
Čabalová, I., Kačík, F. & Sivák, J. (2009). Changes of molecular weight distribution of
cellulose during pulp recycling. Acta Facultatis Xylologiae Zvolen 51(1), 2009, pp. 11-
17, ISSN 1336-3824
Čabalová, I., Kačík, F. & Sivák, J. (2011). The changes of polymerization degree of softwood
fibers by recycling and ageing process. Acta Facultatis Xylologiae Zvolen 53(1), 2011,
pp. 61-64, ISSN 1336-3824