New Perspectives in Biosensors Technology and Applications Part 3 pptx
Bạn đang xem bản rút gọn của tài liệu. Xem và tải ngay bản đầy đủ của tài liệu tại đây (5.89 MB, 30 trang )
New Perspectives in Biosensors Technology and Applications
52
The developed program carries out an analysis to detect latent pathologies, e.g., in a blood
picture, but using of a matrix of symptoms in the process of diseases recognition makes it
possible to achieve the highest system accuracy. Clusters algorithms rely on pattern
recognition in multidimensional feature space corresponding to definitive human
conditions (Fig. 15).
Figures 16, 17 and 18 show results of recognition information blood patterns before and
after traumas and diseases. Therefore, it is possible to carry out rapidly a human diagnostics
and to prevent the data deference in a high-cost research laboratory.
Fig. 17. Blood information patterns before/after trauma of human limbs.
Fig. 18. Blood information patterns suffering from diabetes.
The base components of an information pattern of saliva are K
+
, Na
+
ions, protein, glucose
and an acoustic coefficient equals numerically a ratio of ultrasonic waves velocity in saliva
to the one in water. Figure 19 depicts information patterns of saliva in the two-dimensional
space of the first two principal components for different subjects.
Intelligent Sensory Micro-Nanosystems and Networks
53
Fig. 19. Saliva information patterns suffering from ischemic heart disease.
Information pattern recognition of human urine (Table 9), e.g., in diagnostics of urolithiasis
is based on a clinical urine analysis using physical-acoustic and electroacoustical properties.
The developed diagnostic system allows to process data of urine analysis fast and with the
high detection probability (79,07 %).
Values, ml
Clinical parameters of urine
analysis
norm healthy man sick man
potassium, K 35-90 40 31
sodium, Na 150-220 175 140
calcium, Ca 2,5-7,5 3,4 2,7
chlorine, Cl 115-220 162 84
phosphorus, P 29-45 37 28
uric acid 1,2-7,1 3,6 5,2
urates till 0,7 0,57 0,65
dielectric capacitivity,
(nondimensional quantity)
less 17,5 24 15
Table 9. Information sensory pattern recognition of urine.
3. Sensory system on a chip electronic eye
Intelligent analysis systems of information optical patterns of human biomatters (blood,
saliva, sweat, urine etc.) present an innovative class of smart laboratories on a chip of the
type “electronic eye”. The light-emitting microdiodes (LED) emit given electromagnetic
waves in the frequency range 10
11
-10
15
Hz, but microphotodiodes register quantitative
changes of a reflected radiation (absorption, refraction, light scattering coefficients etc.). It is
possible to analyze different changes of optical matter properties and a hardware
miniaturization of the intelligent recognition system allows to adopt it to any other systems
depending on application purposes (Fig. 20) (Gulay & Polynkova, 2010).
New Perspectives in Biosensors Technology and Applications
54
Fig. 20. Analysis of investigated matters by optical broadband microtomograph (a), general
form (b) for diagnostics and in the intelligent watch (c) with optical pattern recognition.
Fig. 21. E-eye sensory system in mobile devices. (a) Developed smartphone with optical
recognition system e-eye. (b) Penetration of electromagnetic waves with different
wavelengths in skin of user’s palm holding smartphone in one's hand. (c) General view of
smartphone with embedded sensory system e-eye.
Intelligent Sensory Micro-Nanosystems and Networks
55
Then it makes a comparison between the known information pattern and all reference
models of human biomatter to determine a degree of manifestation for the given pattern and
its influence on human health. Smart multiprocessing enables flexible on-line modeling of
intelligent systems with a calculation of individual optimal micro-nanosensory parameters
of the optical microtomography. For example, the mobile intelligent system (Fig. 21) enables
to carry out an operative prediction about a health status and doesn’t require special
application conditions or highly skilled specialists.
Fig. 22. Recognition of information patterns of foodstuffs.
Our developed systems find a broad spectrum of applications, e.g., for:
• toxic and biological agents, explosive hazard and narcotic searching in complex sensory
systems and networks;
• rapid recognition of acute infections by the use of breathing diagnostic and early
detection of latent diseases;
• monitoring of children's homes, maternity wards, old people's homes (Polynkova &
N.V. Khmurovich, 1997);
• individual noninvasive monitoring of human health and continuous control of its
functional state of organism due to intelligent sensory systems and networks;
• helping, e.g., medical staffs and prompting them of important decision making;
• production process monitoring (Fig. 22) in pharmaceutics, rejecting mechanism of
primary goods, storage accommodation safety, drinking, nicotine and drug abuse
determination;
• air analysis in industrial and agricultural enterprises, monitoring of noxious vapors,
wastes;
• control of firefanging threshold in agriculture;
• analysis of soil information patterns in precise agriculture (Fig. 23) (Gulay & Polynkova,
2010);
New Perspectives in Biosensors Technology and Applications
56
• problem-solving of on-the-job injury rate and human-factor error accidents in modern
enterprises by testing of any staff;
• ensuring of personal and social safety and safe control against terrorism and corrupt
government officials.
Fig. 23. Mobile soil analyser for precise agriculture (a), satellite “electronic map” of field (b).
4. Radio frequency identification systems
4.1 Remote sensing of information patterns by means of SAW sensors
Radio frequency identification (RFID) systems have been developing over recent years and
find wide applications in micro-nanosensory technologies, production monitoring, ecology,
security systems, transport tracking systems etc. Combining of a SAW sensor with a RFID
system enables to design a new wireless micro-nanosensory device (Polunkova, 2007). A
main idea of such intelligent system includes a latent placement of inexpensive SAW
sensors in public gathering areas (waiting room, airport, railway terminal, cloakrooms etc.).
Transducer makes a connection to an antenna in a specified operation frequency range, but
SAWs are stimulated by antenna irradiation of electromagnetic signal. A substrate of SAW
sensors contains IDT and many reflecting segments and metal strips reflect an electrically
induced acoustic wave so that constructive interference obtains. When launching is stopped
after a while, surface-mode waves goes on still and disappears in 25 μs, so next exciting
acoustic wave is to be generated. The IDTs signal is transformed in SAW propagating to
reflectors and backward directions and back in an electromagnetic signal. Then the
generated in 5-20 μs reflected signal contains important information concerning propagation
Intelligent Sensory Micro-Nanosystems and Networks
57
characteristics and environmental effects on acoustic lines. This one is transmitted in the
antenna outside and can be successfully detected by receiver which measures its parameters
and determines specific gaseous substances. The structure chart of the intelligent system for
detection of odor matters is presented in figure 24.
Fig. 24. Environmental intelligent monitoring system.
Fig. 25. Intelligent system for detection of ethyl alcohol vapors in sensory networks.
4.2 Sensory networks
A universal contactless multicore intelligent system “ISA” for control in sensory networks,
e.g., of ethyl alcohol vapor in any spaces is developed which enables to define instantly
drinking using not remote labs, but a distributed intellect in multidimensional space of
New Perspectives in Biosensors Technology and Applications
58
sensory networks to recognize of information patterns of human health status, dangerous
substances and explosives etc. Vapors concentration characterises the remoteness of a source
from a sensor, but radiuses of remoteness (Fig. 25) define an intersection region.
Every sensor of e-tongue and e-nose is characterized by different partial sensitivity to an
analyzable taste, an odor spaces, but the combined characteristics of all sensor responses can
be used to identify an information pattern in computer technologies and sensory networks.
Amplitude modulation is used for information transferring on a resonance frequency of an
oscillating circuit. Figure 26a presents dependence of a power propagation factor on the
distance between the rider and the SAW retransmitter.
Fig. 26. Stable region of RFID system (a) and characteristics of channel reliability (b).
For example, 430 MHz sensor working in the mode of delay line or in the excitation mode
has the frequency band up to 1 MHz. The receiver of this frequency range has the sensitivity
P
0
=3·10
-15
W= 150 dB/W in case of the signal-to-noise ratio equals numerically 10 dB in
transmission band and at the distance approximately 10 m. Using of pseudonoise signals in
the length more million enables to achieve the considerable distance about 50 m for reliable
functioning of remote hidden passive e-noses and e-tongues. Characteristics of channel
reliability depending on used pseudonoise signals are shown in figure 26b. The maximal
distance of a rider and a SAW retransmitter equals to r
max
≈ 500 m, when the noise-to-signal
ratio in the rider antenna makes 100. Thus, an active SAW sensory antenna makes it possible
to increase the maximal distance up to r
max
=50 km.
5. Multicore system of pattern recognition
A design of microelectronic components and a progress trend of processor throughputs are
related to the development of multicore technologies with parallel architecture which are
close to the functionality cerebration concerning computational powers (Table 10). An
intelligent multicore recognition system of multidimensional sensory patterns is developed
on the basis of SAW micro-nanosensors on a chip e-tongue, e-nose and an optical
microtomography e-eye in the broadband frequency range (Gulay & Polynkova, 2010). The
developed intelligent system “WIS” includes multicore and parallel processing technologies
for fast self-learning and on-line recognition of information sensory patterns of blood, saliva,
sweat, urine etc. Intelligent client applications in Visual Studio enable to design rapid
unique softwares on different platforms by means of NET. Framework 3.5, to use a Parallel
Extensions library for fast data processing depending on numbers of available cores and to
Intelligent Sensory Micro-Nanosystems and Networks
59
Fig. 27. Functional diagram of intelligent system “WIS”.
New Perspectives in Biosensors Technology and Applications
60
apply practically SQL Server opening wide possibilities for Web-applications. The developed
intelligent system “WIS” can be embedded, e.g., in a wristwatch or in mobile phones and
smartphones for different individual applications (Fig. 27). A data packet is generated for
remote wireless transferring to a server after registration of information sensory patterns of
blood, saliva, sweat or foodstuffs etc. Data encoding and information encryption of sensory
devices and antinoise coding are fulfilled before transmission. Information-translation
process realizes using a socket determined at a client and a server to assure an entry of data
to the server.
Characteristic features
Parameters
current systems on a chip human brain
processor throughputs,
flops
single-precision 8,942 ·10
11
(supercomputer Roadrunner
1,4567·10
15
)
close to 10
16
weight
(supercomputer Roadrunner) 226
tonnes
1,4 kg
energy consumption, W
(supercomputer Roadrunner) 3,9·10
6
(videochip AMD RV770) 150
25
clock frequency, Hz 3,33·10
9
10
14
heat energy, J
(switching energy of microchip)
up to 10
-13
(energy of nerve impulse)
5·10
-15
information capacity, bit
(technical process 22 nm)
364·10
6
per cm
2
10
23
memory bandwidth,
bit per sec
10
12
10
18
number of elements, pcs
(transistors) up to
2,9·10
9
per cm
2
(neurons) up to
4·10
7
per cm
3
linear size, m (transistor) up to 22·10
-9
(neuron) 10
-6
data-processing mode parallel-serial mode (more 80 cores)
flexible self-adjusting
parallelism
Table 10. Brain and technical system.
Execution time, sec
one-core multicore
Methods of self-learning
Intel
Pentium 3
753 GHz
Intel
Pentium 4
3 GHz
Intel Core 2
Duo T8300,
2,4 GHz
Root-
mean-
square
error
(RMSE)
neural networks 0,5426 0,1023 0,0409 0,3428
twain 54,1732 15,3611 3,5423 0,2804
group method of
data handling
triplet 186,8461 24,0156 12,3106 0,2093
Table 11. Information pattern recognition of urolithiasis in human urine.
Intelligent system “WIS” makes it possible to achieve high training speed, to apply
advanced parallelism for the purpose of recognition of multidimensional sensory patterns of
biomatters (Тable 11) and for a design of effective not energy-intensive intelligent systems.
Intelligent Sensory Micro-Nanosystems and Networks
61
6. Intelligent information systems security
Using of traditional techniques of a biometric identification and authentication is connected
with problems in relation to external influences determining a distortion of biometric
information and safety features of controllable and reference objects (Azizov, 2009).
Intelligent patented technology of protection against falsification, substitution, imitation of
biometric parameters is developed which can be applied in different fields of human
activity, in particularly, in information and communication networks. A new principle of
group features on the basis of set of physicochemical and biological characteristics uses a
nanostructure of traditional and prospective biometric information characteristics, their
nanomechanic, electronic, gaseous, optical components (Fig. 28).
Fig. 28. Superprotection technology of biometric data: (a) information pattern of fingerprint,
bivariate (b) / three-dimensional (с ) cross-correlation function between fingerprint and
image of reference object.
7. Conclusion
The developed intelligent sensory micro-nanosystems and networks including e-tongue,
e-nose on SAW and e-eye for individual applications, recognition of information biomatters
patterns (blood, saliva, sweat etc.) are shown. These multicore intelligent systems can be
embedded in up-to-date mobile devices (сell phones, smartphones, communicator etc.) or in
a wristwatch, can fast recognize any patterns by means of Internet global sensory networks.
New Perspectives in Biosensors Technology and Applications
62
8. References
Azizov, P.M. & Khudnitsky A.A. (2009). Intelligent System for Biotesting of Thoughts in
Production Process. Proceedings of the Samara Scientific Center of the Russian Academy
of Sciences (Special Edition), pp. 254-261, Samara, Russia, April 2-3, 2009
Azizov, P.M.; Khudnitsky A.A. & Snigirev S.A. (2009). Prospective techniques of biometrical
authentication and identification, Belarusian National Technical University, Belarus,
Minsk
Barkaline, V.V. & Polynkova, E.V. (2002). Smart Materials of Sensory Microelectromechanical
Systems. Modern methods of mashines design. Computing, Engineering and Integration
Technology, Vol.3, pp. 116-121
Deinak, D.A.; Chashynski, A.S. & Khmurovich, N.V. (2009). Desing of Electronic Nose on
Basis of Nanotubes and DNA, Nano-Microsystem Technics, Vol.9, No. 110, pp. 2-6
Gulay, A.V. & Lazapnev E.V. (2005). Analytical Modeling of the Surface Acoustic Wave
Microactuators, Perspective Technologies and Methods in MEMS Design, pp. 14-15,
Lviv-Polyana, Ukraine, May 25-28, 2005
Gulay, A.V & Polynkova, E.V (2010). Optical Sensory Recognition System of Information
Patterns of Human Biomatters, Proceedings of Medelectronics-2010 on Tools of Medical
Electronics and New Medical Technologies, pp. 42-43, Minsk, Belarus, December 6-8,
2010
Khmurovich, N.V. (2010). Intelligent Sensory Nanosystem of Genom Sequencing,
Proceedings of II International Scientific Conference on Nanostructured Materials-2010:
Belarus-Russia-Ukraine (NANO-2010), pp. 653, Kiev, Ukraine, October 19-22, 2010
Koleshko, V.M (1974, 1976, 1981, 1983, 1984, 1985, 1986, 1987, 1988, 1989, 1990). Certificate of
USSR Authorship for Invention № 491824 ,№ 519048, № 608377, № 720693,
№ 843632, № 1104363, № 1105803, № 1127470, № 1138668, № 1144562, № 1159457,
№ 1182293, № 1182939, № 1191765, № 1191817, № 1250858, № 1251661,
№ 1262317, № 1264013, № 1291829, № 1340521, № 1349672, №
1371176,
№ 1378721, № 1410642, № 1426400, № 1436831, № 1450708, № 1501867,
№ 1572187, № 1591724, № 1634063, № 1634069, № 1634111, № 1648234,
№ 1801463, № 3646150
Meshkov, Yu.V & Barkaline, V.V. (1990). Strain Effect in Single-Crystal Silicon Based
Multilayer Surface Acoustic Wave Structures, Thin Solid Films, Vol.190, pp. 359-372
Polynkova, E.V. & Khmurovich, N.V. (1997). Global Monitoring and Control System of Personal
and Social Safety, BITA, Belarus, Minsk
Polynkova, E.V. (2007). Sensory Micro-Nanosystems on Surface-Acoustic-Waves with
Radio-Frequency Identification, Collection of IV Scientific and Practical Conference on
Nanotechnology in Production 2007, pp. 126-132, Frjazino, Russia, November, 2007
3
SPR Biosensor Technique Supports
Development in Biomaterials Engineering
Bogdan Walkowiak
et al.
*
Department of Biophysics, Technical University of Lodz,
Poland
1. Introduction
Various biomaterials are presently employed in the production of a very wide spectrum of
medical implants. The choice of biomaterial is of course determined by the medical
application for which it is intended and to date no one biomaterial has been found to be
fully biocompatible and biotolerant. Furthermore, it is a well known fact that quite often
implants must be removed due to tissue reactions and resultant health problems (Khan et al.
2008; Schierholz& Beuth, 2001). The key role in implant tolerance depends on a very short
period of time during which the biomaterial surface first comes into contact with body
fluids. During this time, water molecules come into contact with the surface of the
biomaterial and the results of this reaction determine the further course of events. Water
molecule interaction is generally dependent on surface nanostructure and highly dependent
on its energy and hydrophobicity. The next stage of interaction, which depends on the
presence of water on the biomaterial surface, is the creation of a thin protein film on this
surface. A hydrophilic surface will collect a large amount of hydrophilic proteins readily
available in body fluids, however these proteins are weakly adsorbed and can be easily
removed or replaced by other molecules. A hydrophobic surface will adsorb proteins by
their hydrophobic regions often causing changes in protein structure and biological activity.
The final stage, cellular attachment, adhesion and proliferation depends on the profile of the
adsorbed proteins, their accessibility and a proper spatial structure which enables
expression of biologically active sites. Thus, the type of protein present on a biomaterial
surface seems to be crucial for biomaterial tolerance in the human body. The most common
experimental models developed to characterize protein adsorption on biomaterial surfaces
involve the incubation of proteins in contact with a studied surface and the estimation of
adsorbed proteins by a variety of methods including electrophoretic, enzymatic or
immunoenzymatic approaches together with a number of labeling techniques. The common
disadvantages of these techniques is that it is not possible to observe protein adsorption as a
kinetic process and protein quantification is strongly limited by the sensitivity of the
methods used, which is usually limited to nanograms per square millimeter. Surface
*
Witold Szymanski
1
, Jacek Szymanski
2
, Marta Walczynska
1
, Magdalena Walkowiak-Przybyło
1
,
Piotr Komorowski
1
, Wiesława Okrój
1
, Witold Jakubowski
1
and Marta Kaminska
1
1
Department of Biophysics, Technical University of Lodz,
2
CoreLab of Medical University of Lodz, BioTechMed
Technology Centre Lodz, Poland
New Perspectives in Biosensors Technology and Applications
64
plasmon resonance (SPR) technology is a potent analytical tool for biomaterial surface
study. This technology makes it possible to prepare a surface of interest (including
polymers, metals, ceramics or carbon) and essentially make it the biosensor surface.
Subsequently, the kinetics of molecule adsorption to the surface can be observed in real
time, without the need for any labeling, together with an extremely high sensitivity of
picograms per square millimeter. Moreover, this technique also allows for the identification
and quantification of adsorbed molecules by use of specific antibodies. The aim of the
present study was to develop conditions that enabled the measurement of plasma protein
adsorption to a variety of biomaterials (including Parylene C, nanocrystalline diamond and
titanium alloy) using commercially available glass plates pre-coated with gold. The
preliminary results obtained regarding plasma protein adsorption were compared with
blood platelets adhesion, E. coli and endothelial cells proliferation, as well as changes in
proteome of endothelial cells grown on the surfaces of these materials.
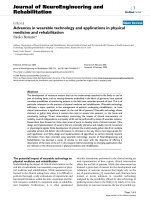
2. SPR biosensor technique in biomaterials engineering
The SPR effect, as a convenient tool for surface investigation, was mentioned in the
monograph describing usable analytical techniques for biomaterial surface study (Davies &
Faulkner, 1996; Davies & Skelton, 1996). The following year a study concerning bovine
serum albumin (BSA) adsorption by thiolated dextran layers present on metallic surfaces,
monitored by SPR technique, was reported (Frazier et al. 1997). In subsequent years SPR
sensors were used for kinetic studies of protein adsorption by polymeric surfaces (Green et
al. 1997; Green et al. 1999) and degradation of polymer surface (Green et al. 2000). Papers
describing SPR technique as a method of supplementing atomic force microscopy (AFM) in
biomaterial studies have also been published (Vansteenkiste et al. 2000; Jung et al. 2009).
Beside the most frequently studied polymeric biomaterials, SPR technique was also used to
study nanocrystalline diamond surfaces and their interaction with plasma proteins
(Walkowiak et al. 2002). Nevertheless, none of these reports describes the application of SPR
sensors to the study of metallic biomaterials, other than substrate metals of the SPR sensor
itself.
2.1 Background of SPR biosensor functioning
The first documented observation of surface plasmons was reported in 1902 (Wood, 1902).
These observations concerned anomalies in the spectrum of light diffracted on a metallic
diffraction grating. The first theoretical approach to these abnormalities was undertaken by
Lord Rayleigh (Lord Rayleigh, 1907) and was continued by Fano (Fano, 1941), who proved
that these anomalies result from excitation of electromagnetic waves on the diffraction
grating. A complete explanation of this phenomenon was reported in 1968 in different
studies that described excitation of surface plasmons (Otto, 1968; Kretschmann & Raether,
1968). Since that time the phenomenon of surface plasmon resonance (SPR) has found
practical applications in modern optics, as a sensitive detector for monitoring molecular
interactions in real time without needing to label interacting molecules. A historical
overview and fundamentals of surface plasmon resonance can be found in numerous review
articles and books (Tudos & Schasfoort, 2008; Kooyman, 2008; Homola, 2008). The most
common geometry in which a surface plasmon can be found, is the structure of dielectric-
metal interface. Analysis performed using Maxwell’s equations with appropriate boundary
SPR Biosensor Technique Supports Development in Biomaterials Engineering
65
conditions, indicates that this structure can support only a single guided mode of
electromagnetic fields i.e. a surface plasmon. Several configurations of SPR devices capable
of generating and detecting SPR signals can be utilized for biosensor construction. These
are: a) prism coupled total internal reflection (TIR) system, b) optical fibers, c) grating
coupled systems, and d) optical wave-guide systems. Of these the most frequently used is
the prism-based system, which was developed for the Kretchman configuration
(Kretschmann & Raether, 1968) This refers to an arrangement where a metal layer is put
directly on a top of a TIR surface (prism) enabling efficient plasmon generation. The second
most commonly applied configuration utilizes core optical fibers coated with a thin metallic
film. When light enters the fiber at certain discrete angles, the conditions for SPR generation
and signal detection are fulfilled (Kanso et al., 2008). The last two configurations are rather
less important for biosensor construction, however new systems that use these techniques
have aroused great interest. In a grating coupled system light penetrates a flow channel and
is angle-reflected onto diffraction grating. The effective refractive index depends on the
concentration of particles within a flowing sample (Hoa, et al. 2009). An optical wave-guide
system is a somewhat similar to the optical fiber based configuration, here a glass plate
instead of an optical fiber is used (Suzuki et al., 2005).
Most commercially available systems are working in the Kretchman configuration. Put
simply this SPR method can be described as a physical process taking place when plane-
polarized light, propagated in a dielectric environment, hits a metal surface under total
internal reflection (TIR) conditions. Assuming that the dielectric-metal interface consists of a
transparent dielectric (glass prism) and a layer of metal of suitable thickness, we can
consider an evanescent p-polarized electromagnetic field (light) penetrating the metal layer,
which excite plasmon surface wave propagating within the conductor surface. For a non-
magnetic metal such as gold, this surface plasmon wave is also p-polarized. Because the
electric field of this wave also penetrates a short distance into the external environment,
usually with a lower refractive index, the conditions for SPR are sensitive to the refractive
index of the media at the gold surface. When the wavevectors for the photon and plasmon
are equal in magnitude and direction, the resonance condition can be fulfilled. Thus, an
increased refractive index of the medium (sample) penetrated by the plasmon increases the
wavevector of the plasmon wave. Varying the angle of incidence or the wavelength of light,
the wavevector of the light can be attuned to the plasmon wavevector. This enables resonant
absorption of energy via the plasmon excitation (SPR) causing a characteristic drop in the
reflected light intensity. For a fixed wavelength of incident p-polarized light, SPR is seen as
a drop in the intensity of reflected p-polarized light at a specific angle of incidence.
Biomolecular interactions occurring at the sensor surface affect the solute concentration and
thus the refractive index. The SPR angle is therefore altered and the resulting angle shift is
measured as a response signal. In general, different biomolecules have very similar
contributions to the refractive index, thus SPR provides an extremely sensitive detector of
mass change on the sensor surface. Moreover, it is very important for laboratory practice
that the technique requires no labeling of the interacting molecules. A linear correlation
between resonance angle shift and protein surface concentration determined via a
radiometric method has been reported in the literature (Stenberg et al., 1990). The sensitivity
of the mass change detection on the sensor surface depends on the instrument used, more
precisely the type and resolution of the refractrometer, which can vary between 50 pg/mm
2
(Stenberg et al., 1990) and 1 pg/mm
2
(our own observations).
New Perspectives in Biosensors Technology and Applications
66
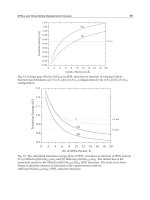
The geometric scheme of the measurement cell used in the BiaCore X instrument is shown in
Figure 1. The prism and the glass plate of the SPR sensor are made of the same high quality
glass and create one piece of a transparent dielectric. The other side of glass plate is coated
with a thin gold film usually carrying a dextran matrix suitable for chemical immobilization
of selected biomolecules. For our experiments we used a pure gold sensor surface instead of
gold coated with dextran. The gold coated side of the sensor surface completes the flow cell
of a flow channel and is a place where molecular interactions can be observed. P-polarized
light comes from the monochromator and passes through the prism, the glass plate and
reaches the gold film, where it excites a plasmon wave. The resonance of plasmon
evanescent waves and light results in the energy deficit of the reflected light, which can be
detected for specific resonance angles. Binding of flowing molecules (analyte) to the
immobilized molecules (ligand) results in a shift in the reflected resonance angle.
Fig. 1. The geometry scheme of the measurement cell in the BiaCore X instrument (the scheme
was adopted from Surface Plasmon Resonance Technology Note 1, Biacore AB, Sweden).
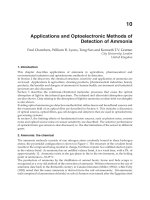
A typical response produced by the SPR biosensor technique is presented in Figure 2. The
response signal can be expressed as a shift in resonance angle (degree) or as a resonance unit
(RU). The baseline represents the response attributed to the initial level of mass at the sensor
surface. An injection of analyte over the immobilized ligand results in a two-component
response. The first part, a bulk response, corresponds to the presence of a constant amount
of mass flowing by the sensor surface during the injection interval. This subsequently drops
to the level of the baseline when injection is finished. The second component, a binding
response, corresponds to an increase in mass resulting from binding of analyte molecules,
including nonspecific interactions. The response increases until binding saturation is
achieved, which means an equilibrium between the number of associated and dissociated
complexes is reached. This phase is considered as an association phase. When injection is
stopped, the bulk response is rapidly switched off, and the dissociation phase of bound
analyte is observed. The cycle can also be repeated with different analytes, for example
enhancing specific antibody.
SPR Biosensor Technique Supports Development in Biomaterials Engineering
67
Fig. 2. Typical response produced by the SPR biosensor technique
Collected data can be used for analyte fishing and recognition, concentration estimation or
kinetic analysis. Very useful surveys of literature, concerning commercially available SPR
systems, containing a lot of interesting suggestions and comments, regularly updated since
1999 is accessible (Myszka, 1999; Rich & Myszka, 2010).
3. Materials and methods
Samples for the study of blood platelet adhesion, endothelial cell proliferation and bacterial
biofilm formation were prepared as follows: a round bar (8 mm in diameter) of
commercially available stainless steel (AISI 316 L) was cut into discs each 3 mm thick. These
discs where then machined, polished and later coated with nanocrystalline diamond (NCD)
or chlorinated poly(para-xylylene) (Parylene C). Titanium alloy samples were prepared as
above using a Ti6Al4V round (8 mm) bar substrate. For blood plasma protein adsorption
studies samples were prepared on commercially available pre-sensor glass plates precoated
with gold (SIA Kit AU, BiaCore Life Sciences). A carbon layer was synthesized on the gold
surface of the pre-sensor and characterized as described previously (Mitura et al. 1999;
Okroj et al. 2006), with a slight modification that involved adjusting the duration of the
process. The purpose of this alteration was to obtain a uniform carbon layer with a thickness
of approximately 10 nm. Ten nanometer thick layer of Parylene C was deposited onto the
gold surface of the pre-sensor by chemical vapour deposition (CVD) method in a manner
that had been reported previously (Gazicki-Lipman 2007; Kaminska et al. 2009). Titanium
alloy layer was prepared by magnetron sputtering of titanium substrate (Wendler et al.
2004) with process parameters tailored to achieve uniform and thin (10 and 20 nm) coatings.
All sample surfaces were prepared at the Institute of Materials Science and Engineering,
Technical University of Lodz, Poland, and were kindly provided by Prof. Stanislaw Mitura,
Prof. Maciej Gazicki-Lipman and Prof. Bogdan Wendler.
Hydrophobicity of the studied surfaces was estimated by measurement of the contact angle
of deionized water droplets. The values of the contact angle were determined using the
commonly available software Image J.
New Perspectives in Biosensors Technology and Applications
68
Adsorption of blood plasma proteins on the surface of the examined samples, under flow
conditions, was measured with a BIACore X system (BIACore AB, Uppsala, Sweden). The
system temperature was set at 37
o
C. After sensor docking the system was primed with HBS-
EP buffer containing 0.01 M HEPES, 0.15 M NaCl, 3 mM EDTA, 0.005% v/v surfactant P20,
pH 7.4. Before any measurements were carried out, each sensor was subjected to sensitivity
assessment (Kaminska et al. 2005). For this purpose 20 µl of glucose solution in increasing
concentration, up to 10%, was repeatedly injected. The procedure was performed at a flow
rate of 60 μl/min. When sensor sensitivity was satisfactory, small portions (10 μl) of blood
plasma, diluted in HBS-EP (1:1000), were then injected and adsorption of plasma
constituents on the studied surfaces was recorded for a number of flow rates starting from
10 μl/min through 25 and 50 μl/min up to 100 μl/min. The system exhibits extremely high
sensitivity in determination of mass change on the sensor surface - approximately one
resonance unit (RU) corresponds to one picogram per square millimetre (1 RU ~ 1 pg/mm
2
).
Pure gold was used as a reference surface. Monospecific polyclonal antibodies specific for
human fibrinogen were produced at the Department of Molecular and Medical Biophysics,
Medical University of Lodz, Poland, according to a previously published procedure
(Walkowiak et al. 1994).
SPM Veeco MultiMode V atomic force microscope (Plainview, USA), equipped with
NanoScope 7.3 software, working in tapping mode with a type 15 scanning probe, was used
for measurement of Parylene C coat thickness. For this purpose a piece of glass plate was
partially coated with an adhesive tape and treated with the same process as used for the
parylene coated sensor. Next, the adhesive tape was removed and an AFM device was used
to estimate the Parylene C layer thickness.
The interaction of sample surfaces with blood platelets was studied using a standard
method developed in our laboratory (Okroj et al. 2006). Blood samples used for these
experiments were collected from healthy volunteers and approval for this study was
obtained from the Bioethical Committee of the Medical University of Lodz (RNN/46/06/KB
21.02.2006). The donors had not been treated with any antiplatelet drugs for at least two
weeks prior to the examination. The investigated surfaces were immersed in whole citrated
blood at 37 °C for one hour. Blood was constantly kept in motion by gentle end-to-end
mixing. Thereafter, the samples were rinsed twice in 0.1 M phosphate buffer, pH 7.4. The
fixing procedure was carried out with glutaraldehyde and sample dehydration was
achieved with ethanol applied in increasing concentrations. Finally, the surface was
sputtered with a thin layer of gold (JEE-4X, JEOL, Tokyo, Japan). Quantitative analysis of
SEM (HITACHI S – 3000N, Tokyo, Japan) images, obtained from thirty randomly selected
areas, was carried out for each sample.
Endothelial immortalized cell line EA.hy 926 was used for the experiment (Jerczynska et al.
2005). Cells were cultured in tissue culture plastics (TPP, Trasadingen, Switzerland) using
Dulbecso’s modified Eagle’s medium with high glucose concentration (4,5 g/l), containing
10% FBS supplemented with HAT (100 μM hypoxanthine, 0.4 μM aminopterin and 16 μM
thymidine) and antibiotics, at 37 °C in a humidified atmosphere containing 5% CO
2
. The
cells were applied onto the examined surfaces immersed in the above mentioned culture
medium and were grown for 48 hours. For the control, cells cultured in standard conditions
were used. Cell proliferation and cytotoxicity were estimated with live/dead test using
calcein-AM and ethidium homodimer (Molecular Probes, Eugene, USA) and GX71
fluorescence microscope (Olympus, Center Valley, USA).
SPR Biosensor Technique Supports Development in Biomaterials Engineering
69
For proteome analysis 2D electrophoresis technique was carried out. Harvested cells were
disintegrated with a lysis buffer containing urea (7M), tiourea (2M), CHAPS (4%), IPG
buffer (2%) and DTT (40 mM), and proteins were purified with a 2D-Clean-Up Kit. IEF
separation (1D) was carried out with an IPGphor integrated isoelectrofocusing system using
IPG strips (11 cm, pH 4-7). The second dimension was performed with a Multiphore II
system using ExcelGel SDS 2-D Homogeneous 12,5%. Finally, gels were stained with silver,
scanned using ImmageScanner II and analyzed with ImageMaster 2D Platinium 6.0
software. All instruments, materials and reagents used for 2D electrophoresis were sourced
from GE Healthcare (Waukesha, USA).
E. coli cells (DH5α strain, 2x10
3
cells) were cultured on the surfaces of the examined samples.
The culture was carried out for 24 h at 37°C in a medium containing NaCl (1%),
bactopeptone (1%), yeast extract (0.5%) and pH 7.0. Next, the surfaces were extensively
washed with deionized water and labeled by immersion in a fluorescent dye solution
containing two dyes, bis-benzimide and propidium iodide, which made the visualization of
both living and dead cells possible (Jakubowski et al. 2004).
Both F-Snedecor’s test and unpaired Student’s t-test or alternatively nonparametric ANOVA
test with Bonferroni p-value correction were used for statistical analysis of the results. A
value of p < 0.05 was considered as significant.
4. Results
4.1 Surface hydrophobicity
The measured contact angle for deionised water showed NCD and Ti6Al4V surfaces to be
hydrophilic, whereas Parylene C surface was found to be hydrophobic. The differences were
statistically significant. The results are shown in Table 1.
surface
contact angle
(degree)
ANOVA test
significance
NCD 66.34 ± 0.43
Parylene C 96.42 ± 0.40
Ti6Al4V 76.28 ± 1.63
p<0.001
Table 1. Hydrophobicity of examined surfaces expressed as the contact angle of water drop.
4.2 Adsorption of plasma proteins estimated with SPR biosensors
4.2.1 Sensor sensitivity
The sensitivity of sensors coated with thin layers of studied materials was assessed by
sequential injection of glucose solution (20 μl) in increasing concentration (up to 10%).
Figure 3 summarizes the crude results obtained for the reference (gold) sensor together with
NCD, Ti6Al4V and Parylene C coated sensors. These results demonstrate, that with an
increase in density of coating material the sensor response also increases, however
sensitivity may decrease (see results for titanium alloy). It should be also noted that titanium
alloy is a conducting material and can affect SPR phenomenon.
The responses normalized to the initial values and presented as a function of glucose
concentration are shown in Figure 4. NCD and Parylene C coated sensors exhibited the
same sensitivity as the reference sensor, however titanium alloy as more dense metallic
New Perspectives in Biosensors Technology and Applications
70
material caused a decrease in the response. The thinner layer lowered sensor response by
10-15 %, whereas the thicker layer of titanium alloy diminished the response by 85-90%. The
sensitivity of the last sensor was too low to be included in any further investigations.
Fig. 3. Crude results of sensors response to the presence of increasing amounts of glucose.
The glucose concentration varied from 0.04% up to 10%.
Fig. 4. Normalized to the initial values sensor responses as a function of glucose
concentration.
SPR Biosensor Technique Supports Development in Biomaterials Engineering
71
4.2.2 Adsorption of blood plasma proteins to the sensor surface
The same volume (10 μl) of 1000 times diluted blood plasma was applied under variable
flow rates starting from 10 μl/min through 25 and 50 up to 100 μl/min. It was found, that
the amount of blood plasma proteins attached to the surfaces of interest strongly depends
on the shear stress at the sensor surface. With higher share stress lower protein deposition
was observed. En example of protein adsorption to Parylene C surface as a function of flow
rate is presented in Figure 5. Figure 6 summarizes the results and shows a comparison of the
amounts of adsorbed plasma proteins to different surfaces, including reference gold surface,
for different levels of shear stress. It is evident, that for low shear stress, Parylene C adsorbs
more proteins than other surfaces. However, with an increase in flow rate the amount of
adsorbed proteins decreases and is similar to that of titanium alloy. NCD surface exhibited
the highest resistance for protein adhesion for the entire range of flow rates applied.
Fig. 5. Blood plasma proteins adsorption to the surface of Parylene C. Different flow rates
results in different amounts of adsorbed proteins.
The following graph (Figure 7) presents example results of blood plasma protein adsorption
to Parylene C and reference (gold) surfaces. In both cases curves were obtained for flow
rates of 10 μl/min, and identical volumes (20 μl) of diluted plasma proteins were injected.
However, the time intervals for buffer flow were twice as long for Parylene C. The arrows
indicate time points of subsequent plasma protein injection. It is evident, that repeated
injections initially cause an increase in the amount of adsorbed proteins, but within a short
space of time the adsorption process becomes saturated. The forth injection resulted in
almost no change to the mass of adsorbed proteins, moreover the desorption process was
also significantly slower. The last injection, which was marked with anti-Fbg, contained
rabbit anti-fibrinogen monospecific polyclonal antibodies. The observed increase in
resonance signal resulted from binding of the antibodies to fibrinogen molecules present at
the surface. This made it possible to quantify the amount of fibrinogen fixed to the surface. It
New Perspectives in Biosensors Technology and Applications
72
is worth noting, that although the response for the antibody used was different, this was to a
lesser degree than the recorded responses to injected plasma proteins. This may indicate that
the gold surface adsorbed relatively more fibrinogen molecules than Parylene C surface.
Fig. 6. Blood plasma proteins adsorption to the examined surfaces as a function of flow rate.
Fig. 7. An example of repetitive injection of diluted plasma proteins. The injection marked as
anti-Fbg contained rabbit anti-fibrinogen monospecific polyclonal antibodies.
SPR Biosensor Technique Supports Development in Biomaterials Engineering
73
material
blood plasma
proteins
(ng/mm
2
)
anti-Fbg IgG
(ng/mm
2
)
ratio
IgG/plasma
proteins
Parylene C 2.319 1.016 0.438
gold 0.276 0.614 2.225
ratio
Parylene C/gold
8.402
1.655
Table 2. Comparison of amounts of adsorbed proteins and IgG to the Parylene C and
reference (gold) surfaces.
Table 2 summarizes the amount of plasma proteins attached to the surfaces and the amount
of specific IgG molecules enhancing the signal. The ratio of IgG to plasma proteins is about 5
times higher for smooth, nonporous gold surface than for porous Parylene C surface. It also
means that sticky, adhesive, large fibrillar molecules such as fibrinogen, adhere more easily
to the gold surface than to the Parylene C. However, other smaller proteins must be trapped
by porous Parylene C in very large amounts.
It is also important for future studies, using SPR biosensors, to know how to control the
process of biosensor surface synthesis with regards to biomaterial film thickness. It must be
known whether the thickness of any films of used materials correspond to the parameters
we have assumed. Table 3 summarizes data of the initial responses recorded for each sensor
used. If the specific density of the materials and their specific response are known, i.e. after
subtracting the signal from the reference gold film signal, and assuming that 1 RU
corresponds to about 1 pg/mm
2
, it is possible to calculate the thickness of the films. For
NCD we managed to achieve a layer that was exactly 10 nm thick. On the other hand, for
Parylene C the estimated thickness was about 8,44 nm instead of the 10 nm that was
assumed to present. For titanium alloy, where we assumed the layer thickness to be 10 nm,
it was approximately 8.3 nm. Furthermore for the 20 nm layer it was only 11.2 nm. It is
possible that for such a weak sensitivity, as was exhibited by the thicker titanium alloy, the
recorded signal does not accurately represent the amount of titanium alloy on the sensor
surface.
material
density
(g/cm
3
)
response
(RU)
specific
response
(RU)
segment mass
(ng/mm
2
)
thickness
(nm)
NCD 3.52 55 000 35 500 35.5 10.09
Parylene C 1.28 30 300 10 800 10.8 8.44
Ti6Al4V 10nm 4.42 56 000 36 500 36.5 8.26
Ti6Al4V 20nm 4.42 69 000 49 500 49.5 11.20
gold 19 500
Table 3. Data used for estimation of thickness of the films of biomaterials. The specific
response was calculated as the difference between the initial response recorded for the
material of interest and the corresponding response for reference (gold) surface. The
segment mass corresponds to the mass of the film falling on the flow cell surface.
New Perspectives in Biosensors Technology and Applications
74
Of course, it was necessary to confirm the above results with different method. For this
purpose the AFM instrument was used. Figure 8 presents the surface of Parylene C film
deposited on gold surface in the same process used to prepare the SPR biosensor. Prior to
initiating this process, a small area of the surface was covered with adhesive tape. After the
process was complete, the tape was carefully removed and AFM inspection was carried out.
The resulting thickness of the Parylene C film was about 8 nm, which corresponded well
with the 8,44 nm estimated from the SPR reading.
Fig. 8. Measurement of thicknes of the Parylene C film deposited on SPR sensor surface with
use of AFM instrument.
4.3 Blood platelets adhesion
Blood platelet adhesion to the surface of any biomaterial strongly depends on the presence
and exposure of adhesive proteins such as collagen, fibrinogen, fibronectin and others. Since
plasma proteins are adsorbed by the examined surfaces, it was assumed that blood platelets
would adhere to them. Figure 9 illustrates example photos of selected biomaterial surface
fragments. The panels on the left side (lower magnification) were adequate for quantitative
analysis, whereas the panels on the right were used to analyse the degree of activation of the
adhered blood platelets. The lowest number of adhered platelets was found on the surface
of NCD, a greater amount of platelets adhered to surface of titanium alloy, however the
highest thrombogenic properties were exhibited by the Parylene C surface (Table 4). These
differences were statistically very significant. Most platelets found on Ti6Al4V and Parylene
C surfaces were in a similar dendritic-like form, but some of the platelets attached to
Parylene C were also in spread form indicating a higher degree of activation. Platelets
adhering to NCD were mainly in spherical form with short dendrites. This form is usually
attributed to an initial level of platelet activation.
SPR Biosensor Technique Supports Development in Biomaterials Engineering
75
Fig. 9. Blood platelet adhesion to NCD, Parylene C and Ti6Al4V surfaces observed with
SEM. Bars for left and right segments are 50 μm and 10 μm, respectively.
material
number of adhered platelets
per 100 μm
2
ANOVA test
(significance)
NCD 0.9 ± 0.3
Parylene C 3.8 ± 0.2
Ti6Al4V 1.7 ± 0.3
p<0.0001
Table 4. Number of blood platelets adhering to the surfaces of examined materials. Surfaces
exhibited statistically relevant differences in susceptibility to blood platelet adhesion. The data
were collected from at least 10 separate readings. Significance for material pairs was as
follows: NCD vs. Parylene C p<0.001, NCD vs. Ti6Al4V p<0.001, Ti6Al4V vs. Parylene C
p<0.001