Optoelectronics Devices and Applications Part 3 ppt
Bạn đang xem bản rút gọn của tài liệu. Xem và tải ngay bản đầy đủ của tài liệu tại đây (1.56 MB, 40 trang )
SPSLs and Dilute-Nitride O ptoelectronic Devices 19
0 2 4 6 8 10 12 14 16 18 20
0.84
0.86
0.88
0.90
0.92
0.94
0.96
0.98
1.00
1.02
1.04
(a)
(b)
GaNAs Thickness (A)
Transition Energy (eV)
o
1.3 μm
Fig. 14. Energy gap of InAs/GaN
0.02
As SPSL structure as function of varying GaNAs
(barrier) layer thickness (a)7
(InAs)
4
6(GaN As)
n
configuration (b) 14(InAs)
2
13(Ga NAs)
n
configuration.
0 2 4 6 8 10 12 14 16 18 20
0.7
0.8
0.9
1.0
1.1
1.2
1.3
(a)
(b)
Transition Energy (eV)
1.3 μm
1.5 μm
No of SPSL Period, N
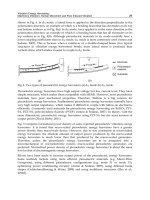
Fig. 15. The calculated transition energy plots of SPSL structures as function of SPSL-period,
N. (a) M(InAs)
3
N(GaN
0.02
As)
2
and (b) M(InAs)
4
N(GaN
0.03
As)
2
. The dotted line is the
numerical result for the M(InAs)
3
N(GaN
0.023
As)
6.2
SPSL structure. The circle (o) is from
Hong et al(needs reference in here)and is the experimental result for
10(InAs)
3
9(GaN
0.023
As)
6.2
SPSL annealed structure.
69
SPSLs and Dilute-Nitride Optoelectronic Devices
20 Will-be-set-by-IN-TECH
Therefore varying by the number of periods and/or barrier height within a SPSL structure, the
position of the band edge can be modified significantly. For the plots it is clear that a structure
which would absorb or emit at the important telecommunication wavelength of 1.5 μmcan
be achieved. We could equally reduce the potential barrier height of the cladding layer (GaAs
in this case) by incorporation of In, in order to reduce the band edge to 1.5 μm, since, due
to limitations of strain, the InAs layer thickness, with a critical thickness, h
c
≤ 5Angstroms
cannot be varied arbitrarily. As expected a larger number of SPSL periods, N, reduces the
transition energy. The same pattern holds with a reduction in potential barrier height.
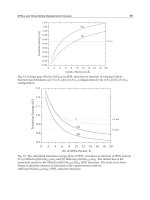
The following plots illustrate contour plots for various SPSL structures which emit or absorb
light at 1.3 μm. The contours in Fig. 16(i) indicate that by reducing dB, tunneling across the
barriers increases and leads to a reduction of the carrier energy within the wells. Therefore
to make up for this reduction we need to increase the barrier height, Vo, or we must reduce
the N concentration since the number of unit cells and the well width, d
A
,arefixed.Thetwo
contour lines in the figure imply that if SPSL-period, N, is reduced in going from solid line
contour to the dashed line contour, then the carrier energy is increased. Therefore thinner
barriers or more nitrogen, are required to lower the barrier height, since d
A
is fixed. Further
more, for nitrogen concentrations of 0.5-1.5% the contour curvature is negligible with respect
to N concentrations. This is particularly so for smaller numbers of periods, N. This is very
significant considering that band gap variation in III-(N)-V systems is nonlinear with respect
to the nitrogen concentration and is therefore very difficult to control even by sophisticated
epitaxial growth techniques. Fig. 16(ii) illustrates 1.3 μm contour plots for fixed nitrogen
concentration and well thickness. In this case an increase in barrier thickness, dB, reduces the
carrier energy within the wells, and therefore, to make up for this we would have to increase
the number of periods. Going from the contour represented by a dashed line to the one
represented in dotted line, the nitrogen concentration increases from 0.5% to 2% respectively.
For higher nitrogen concentrations the barrier height V
o
, is lowered implying that the carrier
energy decreases. Therefore we would have to reduce the number of periods to make up for
the carrier energy reduction. In Fig. 16(iii) the contours indicate that, since increase in number
of periods lowers the carrier energy, the barrier height needs to be raised as d
A
and d
B
are
both kept fixed. This is achieved by reducing the nitrogen concentration. The same pattern
holds when barrier width, d
B
, is reduced, as shown by the solid line of Fig. 16(iii). Again, as
with contours of Fig. 16(i), the transition energy is not very sensitive to variations in nitrogen
concentration for the smaller barrier width particularly for 2-3% nitrogen concentrations. This
is in contrast to structures with comparatively larger barrier width (dashed line of Fig. 16(iii))
which leads to better control over nitrogen concentration in growth. These results, which are
based on numerical models are in agreement with the predictions based on the SL model.
The results are very encouraging for design and fabrication of short period superlattices
suitable for devices which emit or absorb light at 1.3μm and also 1.5 μm of GaAs-based dilute
nitrides. Specifically, more degrees of freedom are available for the design of nanostructure
optoelectronic devices based on a given choice of materials. Structures can be engineered to
vary the SPSL energy gap, by suitable choice of layer thicknesses, which can be atomically
controlled using thin film crystal growth techniques such as MBE, as well as varying the
number of SL period and layer composition. The proposals to use dilute nitride SPSL
structures results in the separation of In and N and would over-come some of the key
material issues limiting growth of III-N
y
-V
1−y
alloys. The growth of the binary and ternary
configuration of GaInNAs SPSL should also provide better compositional control since the
70
Optoelectronics – Devices and Applications
SPSLs and Dilute-Nitride O ptoelectronic Devices 21
0
5
10
15
20
0 0.5 1.0 1.5 2.0 2.5 3.0 3.5
N_Concentration (%)
GaN As Thickness (A)
o
y
(i)
2
4
6
8
10
12
14
0246810
GaN As Thickness (A)
o
y
SPSL Period, N
(ii)
2
4
6
8
10
12
14
16
0 0.5 1.0 1.5 2.0 2.5 3.0 3.5
N_Concentration (%)
SPSL Period, N
(iii)
Fig. 16. 1.3 μm contour plots of (i) 4(InAs)
4
13(GaN
y
As)
n
, solid line, and
7(InAs)
4
6(GaN
y
As)
n
, dashed line, SPSLs vs. barrier width, n, and N-concentration,y.
(ii)M(InAs)
4
N(GaN
0.005
As)
n
, dotted line, M(InAs)
4
N(GaN
0.01
As)
n
solid line, and
M(InAs)
4
N(GaN
0.02
As)
n
, dashed line, SPSLs vs. number of periods and barrier width. (iii)
M(InAs)
4
N(GaN
y
As)
9
, dashed line, and M(InAs)
4
N(GaN
y
As)
4
, solid line, SPSL structures as
function of number of periods, N, and N-concentration, y.
71
SPSLs and Dilute-Nitride Optoelectronic Devices
22 Will-be-set-by-IN-TECH
incorporation of nitrogen will involve only one group III-element in each period of the
structure. Also, since in SPSL structures the well/barrier width and therefore the period are in
effect reduced to less than the electron mean free path, the entire electron system will enter a
quantum regime of reduced dimensionality in the presence of nearly ideal interfaces, resulting
in improved mobility within these structures. Therefore, design and growth of more efficient
optoelectronic devices based on III-N
y
-V
1−y
systems should be possible. The current work on
SPSL dilute nitride structures is very scarce. To authors knowledge apart from our group only
one other has produced such work without any proper theoretical back up tough. Therefore
the potential is tremendous in this field with many possible directions in obtaining a better
understanding of the important GaAs-based dilute nitride systems.
If dilute nitride materials are to prove their worth, then it must be demonstrated that they
can be used to produce durable optoelectronic devices for use at 1.3-1.55 m applications.
Unfortunately, a full understanding of the fundamental nature and behaviour of nitride
alloys, especially during the annealing treatments that are required for optimum performance,
continues to elude researchers. Certain trends have been identified qualitatively, such as
that optimum anneal conditions depend on composition, and more specifically on (2D/3D)
growth mode Hierro et al. (2003), on nitrogen content Francoeur et al. (1998); Loke et al.
(2002), and on indium content for GaInNAs Kageyama et al. (1999), but ’optimum’ annealing
treatments continue to vary widely, according to growth method, growth conditions, structure
and composition. We believe that SPSL structures have an important role to play in such
studies. Therefore the priority should be to repeat the previous annealing study and try
to obtain more information about the improvements seen during annealing. This could
be done by measuring more-comprehensively the relationship seen in Arrhenius plots of
integrated PL intensity vs. 1/T. Additionally, a series of experiments designed to find the
optimum combination, duration and temperatures for in-situ and/or ex-situ annealing should
be carried out, and repeated for SPSL active layers to determine whether such dilute nitride
structures are capable of outperforming more-primitive MQW structures. These experiments
should also provide another opportunity to investigate the optical performance of nitrides.
We made use of the transfer matrix algorithm based on the envelope function approximation
(EFA). The results obtained demonstrated excellent agreement with those obtained
experimentally so far, to authors knowledge, Hong et al Hong et al. (2001). Since the
transfer matrix method is based on the EFA, it has the corresponding advantage that the
input parameters are those directly determined by experimentally measured optical and
magneto-optical spectra of bulk materials. The effect of additional perturbations, such as
externally applied fields, built in strain in superlattices are easily incorporated into the k.p
Hamiltonian with no additional analysis in the transfer matrix method. Furthermore the
transfer matrix method provides a simple procedure to obtain the wavefunctions, which are
particularly useful in evaluating transition probabilities.
6. References
Ahlgren, T., Vainonen-Ahlgren, E., Likonen, J., Li, W. & Pessa, M. (2002). Concentration
of interstitial and substitutional nitrogen in GaN
x
As
1x
, Applied Physics Letters
80: 2314–2316.
72
Optoelectronics – Devices and Applications
SPSLs and Dilute-Nitride O ptoelectronic Devices 23
Albrecht, M., Grillo, V., Remmele, T., Strunk, H. P., Egorov, A. Y., Dumitras, G., Riechert, H.,
Kaschner, A., Heitz, R. & Hoffmann, A. (2002). Effect of annealing on the In and N
distribution in InGaAsN quantum wells, Applied Physics Letters 81: 2719–2721.
Bastard, G. A. (1988). Wave mechanics applied to semicindcutor heterostructures, Les Editiond de
Physique, Paris.
Bastard, G. & Brum, J. (1986). Electronic states in semiconductor heterostructures, Quantum
Electronics, IEEE Journal of 22: 1625–1644.
Bhat, R., Caneau, C., Salamanca-Riba, L., Bi, W. & Tu, C. (1998). Growth
of GaAsN/GaAs, GaInAsN/GaAs and GaInAsN/GaAs quantum wells by
low-pressure organometallic chemical vapor deposition, Journal of Crystal Growth
195: 427–437.
Buyanova,I.A.,Chen,W.M.,Pozina,G.,Bergman,J.P.,Monemar,B.,Xin,H.P.&Tu,
C. W. (1999). Mechanism for low-temperature photoluminescence in GaNAs/GaAs
structures grown by molecular-beam epitaxy, Applied Physics Letters 75: 501–504.
Buyanova, I. A., Chen, W. M. & Tu, C. W. (2002). Magneto-optical and light-emission
properties of III-As-N semiconductors, Semiconductor Science and Technology
17: 815–822.
Buyanova, I. A., Chen, W. M. & Tu, C. W. (2003). Recombination processes in N-containing
III
˝
UV ternary alloys, Solid State Electronics 47: 467–475.
Buyanova, I. A., Hai, P. N., Chen, W. M., Xin, H. P. & Tu, C. W. (2000). Direct determination
of electron effective mass in GaNAs/GaAs quantum wells, Applied Physics Letters
77: 1843–1845.
Buyanova, I. A., Pozina, G., Hai, P. N. & Chen, W. M. (2000). Type I band alignment in the
GaN
x
As
1−x
/GaAs quantum wells, Physical Review B 63: 033303–033307.
Buyanova, I. A., Pozina, G., Hai, P. N., Thinh, N. Q., Bergman, J. P., Chen, W. M., Xin, H. P. &
Tu, C. W. (2000). Mechanism for rapid thermal annealing improvements in undoped
GaN(x)As(1-x)/GaAs structures grown by molecular beam epitaxy, Applied Physics
Letters 77: 2325–2327.
de Walle, C. G. V. (1989). Band lineups and deformation potentials in the model-solid theory,
Physical Review B 39: 1871–1883.
Egorov,A.Y.,Odnobludov,V.A.,Zhukov,A.E.,Tsatsul’nikov,A.F.,Krizhanovskaya,N.V.,
Ustinov, V. M., Hong, Y. G. & Tu, C. W. (2002). Valence band structure of GaAsN
compounds and band-edge line-up in GaAs/GaAsN/InGaAs hetorosructures,
Molecular Bean Epitaxy, 2002 International Conference on, IEEE, pp. 269–270.
Esaki, L. & Tsu, R. (1970). Superlattice and negative differential conductivity in
semiconductors, IBM J. Res. Development 14: 61–65.
Fan, W. J., Li, M. F., Chong, T. C. & Xia, J. B. (1996). Electronic properties of zinc-blende GaN,
AlN, and their alloys Ga
1−x
Al
x
N, Journal of Applied Physics 79: 188–194.
Francoeur, S., Sivaraman, G., Qiu, Y., Nikishin, S. & Temkin, H. (1998). Luminescence
of as-grown and thermally annealed GaAsN/GaAs, Applied Physics Letters
72: 1857–1859.
Geisz, J. F., Friedman, D. J., Olson, J. M., Kurtz, S. R. & Keyes, B. M. (1998). Photocurrent of 1
eV GaInNAs lattice-matched to GaAs, Journal of Crystal Growth 195: 401–408.
Gerard, J. M., Marzin, J. Y., Jusserand, B., Glas, F. & Primot, J. (1989). Structural and
optical properties of high quality InAs/GaAs short-period superlattices grown by
migration-enhanced epitaxy, Applied Physics Letters 54: 30–32.
73
SPSLs and Dilute-Nitride Optoelectronic Devices
24 Will-be-set-by-IN-TECH
Gilet, P., Chevenas-Paule, A., Duvaut, P., Grenouillet, L., Hollinger, P., Million, A., Rolland, G.
& Vannuffel, C. (1999). Growth and characterization of thick GaAsN epilayers and
GaInNAs/GaAs multiquantum wells, Physica-Status-Solidi a 176: 279–283.
Grenouillet, L., Bru-Chevallier, C., Guillot, G., Gilet, P., Ballet, P., Duvaut, P., Rolland, G. &
Million, A. (2002). Rapid thermal annealing in GaN
x
As
1x
/GaAs structures: Effect of
nitrogen reorganization on optical properties, Journal of Applied Physics 91: 5902–5908.
Gupta, J. A., Barrios, P. J., Aers, G. C., Williams, R. L., Ramsey, J. & Wasilewski, Z. R. (2003).
Properties of 1.3 μm InGaNAs laser material grown by MBE using a N
2
/Ar RF
plasma, Solid State Electronics 47: 399–405.
Hasenberg, T. C., McCallum, D. S., Huang, X. R., Dawson, M. D., Boggess, T. F.
& Smirl, A. L. (1991). Linear optical properties of quantum wells composed
of all-binary InAs/GaAs short-period strained-layer superlattices, Applied Physics
Letters 58: 937–939.
Hierro, A., Ulloa, J M., Chauveau, J M., Trampert, A., Pinault, M A., Tournié, E., Guzmán,
A., Sánchez-Rojas, J. L. & Calleja, E. (2003). Annealing effects on the crystal structure
of GaInNAs quantum wells with large In and N content grown by molecular beam
epitaxy, Journal of Applied Physics 94: 2319–2324.
Hong, Y. G., Egorov, A. Y. & Tu, C. W. (2002). Growth of GaInNAs quaternaries using a digital
alloy technique, Journal of Vaccum Science Technology B 20: 1163–1166.
Hong, Y. G. & Tu, C. W. (2002). Optical properties of GaAs/GaN
x
As
1−x
quantum well
structures grown by migration-enhanced epitaxy, Journal of Crystal Growth 242: 29–34.
Hong, Y. G., Tu, C. W. & Ahrenkiel, R. K. (2001). Improving properties of GaInNAs with a
short-period GaInAs/GaNAs superlattice, Journal of Crystal Growth 227: 536–540.
hsiu Ho, I. & Stringfellow, G. B. (1997). Solubility of nitrogen in binary III-V systems, Journal
of Crystal Growth 178: 1–7.
Jalili, Y. S., Stavrinou, P. N., Jones, T. & Parry, G. (2004). GaAs-based III-N
y
-V
1−y
active regions
based on short-period super-lattice structures, to be submitted to, Physical Review B .
Jang, J. G., Miller, D. L., Fu, J. & Zhang, K. (1992). Study of (InAs)
m
(GaAs)
n
short-period
superlattice layers grown on gaas substrates by molecular-beam epitaxy, Journal of
Vaccum Science Technology B 10: 772–774.
Kageyama, T., Miyamoto, T., Makino, S., Koyama, F. & Iga, K. (1999). Thermal annealing of
GaInNAs/GaAs quantum wells grown by chemical beam epitaxy and its effect on
photoluminescence, Japanese Journal of Applied Physics 38: L298–L300.
Kent, P. R. C. & Zunger, A. (2001a). Evolution of III-V Nitride alloy electronic structure: The
localized to delocalized transition, Physical Review Letters 86: 2613–2616.
Kent, P. R. C. & Zunger, A. (2001b). Theory of electronic structure evolution in GaAsN and
GaPN alloys, Physical Review B 64: 115208–115231.
Kim, K., Lambrecht, W. R. L. & Segall, B. (1996). Elastic constants and related properties of
tetrahedrally bonded BN, AlN, GaN, and InN, Physical Review B 53: 16310–16326.
Kitatani, T., Kondow, M., Nakahara, K., Larson, M. C., Yazawa, Y., Okai, M. & Uomi, K.
(1999). Nitrogen incorporation rate, optimal growth temperature, and AsH
3
-flow
rate in GaInNAs growth by gas-source MBE using N-radicals as an N-source, Journal
of Crystal Growth 201-202: 351–354.
Kitatani, T., Nakahara, K., Kondow, M., Uomi, K. & Tanaka, T. (2000). Mechanism analysis of
improved GaInNAs optical properties through thermal annealing, Journal of Crystal
Growth 209: 345–349.
74
Optoelectronics – Devices and Applications
SPSLs and Dilute-Nitride O ptoelectronic Devices 25
Klar, P. J., Gruning, H., Chen, L., Hartmann, T., Golde, D., Gungerich, M., Heimbrodt, W.,
Koch, J., Volz, K., Kunert, B., Torunski, T., Stolz, W., Polimeni, A., Capizzi, M.,
Dumitras, G., Geelhaar, L. & Riechert, H. (2003). Unusual properties of metastable
(Ga, In)(N,As) containing semiconductor structures, in IEEE (ed.), Optoelectronics, IEE
Proceedings-, Vol. 150, IEEE, pp. 28 –35.
Klar, P. J., Gruning, H., Heimbrodt, W., Weiser, G., Koch, J., Volz, K., Stolz, W., Koch, S. W.,
Tomic, S., Choulis, S. A., Hosea, T. J. C., O’Reilly, E. P., Hofmann, M., Hader, J. &
Moloney, J. V. (2002). Interband transitions of quantum wells and device structures
containing Ga(N, As) and (Ga, In)(N, As), Semiconductor Science and Technology
17: 830–842.
Klar, P. J., Gruning, H., Koch, J., Schafer, S., Volz, K., Stolz, W., Heimbrodt, W., Saadi, A. M. K.,
Lindsay, A. & OŠReilly, E. P. (2001). (Ga, In)(N, As)-fine structure of the band gap
due to nearest-neighbor configurations of the isovalent nitrogen, Physical Review B
64: 121203(R)–121207(R).
Kondow, M., Uomi, K., Kitatani, T., Watahiki, S. & Yazawa, Y. (1996). Extremely large
N-content (up to 10%) in ganas grown by gas-source MBE, Journal of Crystal Growth
164: 175–179.
Kong, J. A. (1990). Electromagnetic wave theory, 2nd edn, Wiley, New York.
Kurtz,S.,Webb,J.,Gedvilas,L.,Friedman,D.,Geisz,J.,Olson,J.,King,R.,Joslin,D.&Karam,
N. (2001). Structural changes during annealing of GaInAsN, Applied Physics Letters
78: 748–750.
Li, L. H., Pan, Z., Zhang, W., Lin, Y. W., Zhou, Z. Q. & Wu, R. H. (2000). Effects
of rapid thermal annealing on the optical properties of GaN
x
As
1−x
/GaAs single
quantum well structure grown by molecular beam epitaxy, Journal of Applied Physics
87: 245–248.
Li, W., Pessa, M., Ahlgren, T. & Decker, J. (2001). Origin of improved luminescence efficiency
after annealing of Ga(In)NAs materials grown by molecular-beam epitaxy, Applied
Physics Letters 79: 1094–1096.
Li, W., Pessa, M. & Likonen, J. (2001). Lattice parameter in GaNAs epilayers on GaAs:
Deviation from Vegard’s law, Applied Physics Letters 78: 2864–2866.
Linsay, A. (2002). PhD Thesis, University of Surrey.
Loke, W. K., Yoon, S. F., Wang, S. Z., Ng, T. K. & Fan, W. J. (2002). Rapid thermal annealing of
GaN
x
As
1x
grown by radio-frequency plasma assisted molecular beam epitaxy and
its effect on photoluminescence, Journal of Applied Physics 91: 4900–4903.
Mair, R. A., Lin, J. Y., Jianga, H. X., Jones, E. D., Allerman, A. A. & Kurtz, S. R.
(2000). Time-resolved photoluminescence studies of In(x)Ga(1-x)As(1-y)N(y), Applied
Physics Letters 76: 188–190.
Masia, F., Polimeni, A., Baldassarri, G., von Högersthal, H., Bissiri, M., Capizzi, M., Klar, P. J.
& Stolz, W. (2003). Early manifestation of localization effects in diluted Ga(AsN),
Applied Physics Letters 82: 4474–4476.
Mazzucato, S., Potter, R. J., Erol, A., Balkan, N., Chalker, P. R., Joyce, T. B., Bullough, T. J.,
Marie, X., Carrère, H., Bedel, E., Lacoste, G., Arnoult, A. & Fontaine, C. (2003).
S-shaped behaviour of the temperature-dependent band gap in dilute nitrides,
Physica E 17: 242–244.
Miyamoto, T., Kageyama, T., Makino, S., Schlenker, D., Koyama, F. & Iga, K. (2000). CBE and
MOCVD growth of GaInNAs, Journal of Crystal Growth 209: 339–344.
75
SPSLs and Dilute-Nitride Optoelectronic Devices
26 Will-be-set-by-IN-TECH
Moison, J. M., Guille, C., Houzay, F., Barthe, F. & Rompay, M. V. (1989). Surface segregation
of third-column atoms in group iii-v arsenide compounds: ternary alloys and
heterostructures, Physical Review B 40: 6149–6162.
Moreira, M. V. B., Py, M. A. & Ilegems, M. (1993). Molecular-beam epitaxial growth and
characterization of modulation-doped field-effect transistor heterostructures using
InAs/GaAs superlattice channels, Journal of Vaccum Science Technology B 11: 601–609.
Mussler, G., Däweritz, L., K H Ploog, J. W. T. & Talalaev, V. (2003). Optimized annealing
conditions identified by analysis of radiative recombination in dilute Ga(As,N),
Applied Physics Letters 83: 1343–1345.
Ng, T. K., Yoon, S. F., Wang, S. Z., Loke, W. K. & Fan, W. J. (2002). Photoluminescence
characteristics of GaInNAs quantum wells annealed at high temperature, Journal of
Vaccum Science Technology B 20: 964–968.
O’Reilly, E. P., Lindsay, A., Tomic, S. & Kamal-Saadi, M. (2002). Tight-binding and k.p models
for the electronic structure of Ga(In)NAs and related alloys, Semiconductor Science and
Technology 17: 870–879.
Ougazazaden, A., Bellego, Y. L., Rao, E. V. K., Juhel, M. & Leprince, L. L. (1997). Metal
organic vapor phase epitaxy growth of GaAsN on GaAs using dimethylhydrazine
and tertiarybutylarsine, Applied Physics Letters 70: 2861–2863.
Pan, Z., Li, L. H., Zhang, W., Lin, Y. W. & Wu, R. H. (2000). Effect of rapid thermal annealing on
GaInNAs/GaAs quantum wells grown by plasma-assisted molecular-beam epitaxy,
Applied Physics Letters 77: 1280–1282.
Pearton, S. J. (2000). Optoelectronic properties of semiconductors and superlattices: GaN and related
materials II, Gordon and Breach Science Publishers.
Peng, C. S., Pavelescu, E. M., Jouhti, T., Konttinen, J. & Pessa, M. (2003). Diffusion at the
interfaces of InGaNAs/GaAs quantum wells, Solid State Electronics 47: 431–435.
Persson, C., da Silva, A. F., Ahuja, R. & Johansson, B. (2001). Effective electronic masses in
wurtzite and zinc-blende GaN and AlN, Journal of Crystal Growth 231: 397–406.
Polimeni, A., v H G Baldassarri, H., Bissiri, M., Capizzi, M., Fischer, M., Reinhardt,
M. & Forchel, A. (2001). Effect of hydrogen on the electronic properties of
In
x
Ga
1x
As
1y
N
y
/GaAs quantum wells, Physical Review B 63: 201304(R)–201308(R).
Pomarico, A., Lomascolo, M., Cingolani, R., Egorov, A. Y. & Riechert, H. (2002). Effects of
thermal annealing on the optical properties of InGaNAs/GaAs multiple quantum
wells, Semiconductor Science and Technology 17: 145–149.
Raja, M., Lloyd, G. C. R., Sedghi, N., Eccleston, W., Lucrezia, R. D. & Higgins, S. J. (2002).
Conduction processes in conjugated, highly regio-regular, high molecular mass,
poly(3-hexylthiophene) thin-film transistors, Journal of Applied Physics 92: 1446–1449.
Ram-Mohan, L. R., Yoo, K. H. & Aggarwal, R. L. (1988). Transfer matrix algorithm for
the calculation of band structure of semiconductor super lattices, Physical Review B
38: 6151–6159.
Rao, E. V. K., Ougazzaden, A., Begello, Y. L. & Juhel, M. (1998). Optical properties of low band
gap GaAs
1−x
N
x
layers: Influence of post-growth treatments, Applied Physics Letters
72: 1409–1411.
Sai-Halasz, G. A., Tsu, R. & Esaki, L. (1977). A new semiconductor superlattice, Applied Physics
Letters 30: 651–653.
Saito, H., Makimoto, T. & Kobayashi, N. (1998). MOVPE growth of strained InGaAsN/GaAs
quantum wells, Journal of Crystal Growth 195: 416–420.
76
Optoelectronics – Devices and Applications
SPSLs and Dilute-Nitride Optoelectronic Devices 27
Seong, M. J., Hanna, M. C. & Mascarenhas, A. (2001). Composition dependence of Raman
intensity of the nitrogen localized vibrational mode in GaAs(1-x)N(x), Applied Physics
Letters 79: 3974–3976.
Shan, W., Walukiewicz, W., III, J. W. A., Haller, E. E., Geisz, J. F., Friedman, D. J., Olson, J. M.
& Kurtz, S. R. (1999). Band anticrossing in GaInNAs alloys, Physical Review Letters
82: 1221–1224.
Shan, W., Walukiewicz, W., Yu, K. M., III, J. W. A., Haller, E. E., Geisz, J. F., Friedman, D. J.,
Olson, J. M., Kurtz, S. R., Xin, H. P. & Tu, C. (2001). Band anticrossing in III-N-V
alloys, Physica-Status-Solidi B 223: 75–85.
Shirakata, S., Kondow, M. & Kitatani, T. (2002). Temperature-dependent photoluminescence
of high-quality GaInNAs single quantum wells, Applied Physics Letters 80: 2087–2089.
Sik, J., Schubert, M., Leibiger, G., Gottschalch, V. & Wagner, G. (2001). Band-gap
energies, free carrier effects, and phonon modes in strained GaNAs/GaAs
and GaNAs/InAs/GaAs superlattice heterostructures measured by spectroscopic
ellipsometry, Journal of Applied Physics 89: 294–305.
Skierbiszewski, C., Perlin, P., Wisniewski, P., Knap, W., Suski, T., Walukiewicz, W., Shan,
W., Yu, K. M., Ager, J. W., Haller, E. E., Geisz, J. F. & Olson, J. M. (2000).
Large, nitrogen-induced increase of the electron effective mass in In
y
Ga
1−y
N
x
As
1−x
,
Applied Physics Letters 76: 2409–2411.
Spruytte,S.G.,Coldren,C.W.,Harris,J.S.,Wampler,W.,Krispin,P.,Ploog,K.&Larson,
M. C. (2001a). Incorporation of nitrogen in nitride-arsenides: Origin of improved
luminescence efficiency after anneal, Journal of Applied Physics 89: 4401–4406.
Spruytte,S.G.,Coldren,C.W.,Harris,S.J.,Wampler,W.,Krispin,P.,Ploog,K.&Larson,
M. C. (2001b). Incorporation of nitrogen in nitride-arsenides: Origin of improved
luminescence efficiency after anneal, Journal of Applied Physics 89: 4401–4406.
Toivonen, J., Hakkarainen, T., Sopanen, M. & Lipsanen, H. (2003a). Effect of post-growth
laser treatment on optical properties of Ga(In)NAs quantum wells, in IEEE (ed.),
Optoelectronics, IEE Proceedings-, Vol. 150, IEE, pp. 68 –71.
Toivonen, J., Hakkarainen, T., Sopanen, M. & Lipsanen, H. (2003b). Observation of defect
complexes containing Ga vacancies in GaAsN, Applied Physics Letters 82: 40–42.
Tournie, E., Pinault, M A. & Guzman, A. (2002). Mechanisms affecting the
photoluminescence spectra of GaInNAs after post-growth annealing, Applied Physics
Letters 80: 4148–4150.
Toyoshima, H., Anan, T., Nishi, K., Ichihashi, T. & Okamoto, A. (1990). Growth
by molecular-beam epitaxy and characterization of (InAs)
m
(GaAs)
n
short period
superlattices on InP substrates, Journal of Applied Physics 68: 1282–1286.
Toyoshima, H., Onda, K., Mizuki, E., Samoto, N., Kuzuhara, M., Itoh, T., Okamoto, A.,
Anan, T. & Ichihashi, T. (1991). Molecular-beam epitaxial growth of InAs/GaAs
superlattices on GaAs substrates and its application to a superlattice channel
modulation-doped field-effect transistor, Journal of Applied Physics 69: 3941–3949.
v H G Baldassarri, H., Bissiri, M., Polimeni, A., Capizzi, M., Fischer, M., Reinhardt, M. &
Forchel, A. (2001). Hydrogen-induced band gap tuning of (InGa)(AsN)/GaAs single
quantum wells, Applied Physics Letters 78: 3472–3474.
Wagner, J., Geppert, T., Köhler, K., Ganser, P. & Maier, M. (2003). Bonding of nitrogen in
dilute GaInAsN and AlGaAsN studied by raman spectroscopy, Solid State Electronics
47: 461–465.
77
SPSLs and Dilute-Nitride Optoelectronic Devices
28 Will-be-set-by-IN-TECH
Wang, S. Z., Yoon, S. F., Loke, W. K., Liu, C. Y. & Yuan, S. (2003). Origin of photoluminescence
of GaAsN/GaN(001) layers grown by plasma-assisted solid source molecular beam
epitaxy, Journal of Crystal Growth 255: 258–265.
Wang, S. Z., Yoon, S. F., Ng, T. K., Loke, W. K. & Fan, W. J. (2002). Molecular beam epitaxial
growth of GaAs
1−X
N
X
with dispersive nitrogen source, Journal of Crystal Growth
242: 87–94.
Weyers, M., Sato, M. & Ando, H. (1992). Red shift of photoluminescence and absorption in
dilute GaAsN alloy lasers, Japanese Journal of Applied Physics 31: L853–L857.
Xin, H. P., Kavanagh, K. L. & Tu, C. W. (2000). Gas-source molecular beam epitaxial growth
and thermal annealing of GaInNAs/GaAs quantum wells, Journal of Crystal Growth
208: 145–152.
Xin, H. P., Tu, C. W. & Geva, M. (1999). Annealing behaviour of p-type GaInAsN grown by
GSMBE, Applied Physics Letters 75: 1416–1418.
Yeh, P. & Yariv, A. (1984). Optical waves in crystals, John Wiley and Sons, New York.
78
Optoelectronics – Devices and Applications
4
Optoelectronic Plethysmography
for Measuring Rib Cage Distortion
Giulia Innocenti Bruni
1
, Francesco Gigliotti
1
and Giorgio Scano
1,2
1
Fondazione Don Carlo Gnocchi, Pozzolatico Firenze
2
Department of Internal Medicine,
Section of Clinical Immunology and Respiratory Medicine
Italy
1. Introduction
The pressure acting on the part of the Rib Cage that is apposed to the costal surface of the lung
is quite different from that acting on the part apposed to the diaphragm. The non uniformity of
pressure distribution led Agostoni and D’Angelo (1985) to suggest that the rib cage could be
usefully regarded as consisting of two compartments mechanically coupled to each other
(Agostoni & D’Angelo, 1985; Jiang et al., 1988, Ward, 1992): the pulmonary rib cage (RCp), and
the abdominal rib cage (RCa). The magnitude of the coupling determines the resistance to
distortion and is an important parameter in the mechanics of breathing. Unitary behaviour of
the rib cage was thought to be dictated by rigidity and the restrictive nature of rib articulations
and interconnection. Nonetheless, important distortion of the rib cage from its relaxation
configuration has been described in asthma (Ringel et al., 1983) quadriplegia (Urmey et al.,
1981) and also in health individual during a variety of breathing pattern (quiet breathing,
hyperventilation, single inspiration, involuntary breathing acts, such as phrenic nerve
stimulation); (Crawford et al., 1983; McCool et al., 1985; Ward et al., 1992; D’Angelo, 1981;
Roussos et al., 1977). In summarizing these results Crawford et al., (1983) and more recently
McCool et al., (1985) concluded that the maintenance of rib cage shape needs not be attributed
to inherent stiffness but may be the consequence of apparently coordinated activity of the
different respiratory muscles. Under circumstance such as lung hyperinflation or when
mechanical coupling between the upper rib cage (RCp) and the lower rib cage (RCa) is very
loose rib cage muscle recruitment is essential to prevent paradoxical (inward) rib cage
displacement. (Ward et al., 1992). Moreover the deformation of the chest wall (CW) occurring
during hyperventilation and while breathing through a resistance implies that the work of
breathing in these conditions is slight larger than that calculated only the basis of the volume-
pressure diagram. And indeed part of the force exerted by the respiratory muscles is
expended to change the shape of the chest wall relative to that occurring at the same lung
volume during relaxation (Agostoni & Mognoni 1966).
Most of what is known about the kinematics of the chest wall i,e., the thoraco-abdomen
compartment comes from studies (Sackner, 1980; Gilbert et al., 1972) using RIP
(Respitrace®). However, the RIP method is subject to error, the volume being inferred from
cross-sectional area changes. Also, evaluation of the breathing pattern with RIP is reliable
only when the rib cage and abdomen behave with a single degree of freedom such as during
Optoelectronics – Devices and Applications
80
quiet breathing. The validity of the calibration coefficient obtained experimentally to convert
one or two dimensions to volume is limited to the estimation of tidal volume under
conditions matched with those during which the calibration was performed (Henke et al.,
1988). Conversely, OEP has been proven able to evaluate, without any assumptions
regarding degree of freedom, changes in compartmental volume of the chest wall. (Pedotti
et al., 1995; Cala et al., 1996; Kenyon et al., 1997; Sanna et al., 1999; Aliverti et al., 1997;
Duranti et al., 2004; Romagnoli et al., 2004a; Romagnoli et al., 2004b; Romagnoli et al., 2006;
Binazzi et al., 2006; Filippelli et al., 2001; Lanini et al., 2007; Gorini et al., 1999; Filippelli et al.,
2003). The precise assessment of changes in thoraco-abdominal volumes, combined with
pressure measurements, allows a detailed description of the action and control of the
different respiratory muscle groups. That is the reason why the accurate computation of
thoraco-abdominal volume changes is needed. It is well known that methods actually in use
for the computation of thoraco-abdominal volume displacement are affected by several
limitations. The most used devices able to compute dynamic changes of the thoraco-
abdominal wall are magnetometers and inductance plethysmography (Respitrace
). Both
these systems are based on the assumption that the thoraco-abdominal wall has only two
degrees of freedom but it is well known that changes in both antero-posterior diameter and
changes in cross-sectional area of thoracic and abdominal compartments are not linearly
related to their respective volumes. Furthermore both devices are strongly influenced by
artefacts due to the subject’s posture that limit their utilization in dynamic conditions (e.g.
exercise).
An ideal system able to measure movements and volumes of the respiratory system should
have the following characteristics as much as possible:
1. Accurate computation of volume changes without using a mouthpiece that may alter
the normal breathing pattern (Gilbert et al., 1972).
2. Necessitating of a simple, stable and repeatable calibration.
3. Possibility of use in non collaborating subjects (during sleep, or in unconscious
patients).
4. Permitting the analysis in different postures.
5. Permitting the analysis in dynamic conditions such walking, or cycling.
6. Allowing high frequency response in order to accurately describe rapid phenomena (i.e.
electric or magnetic stimulation of phrenic nerves).
7. Allowing the analysis of movements and volume changing of the different
compartments of the chest wall: the upper thorax, lower thorax, and abdomen).
8. Allowing the analysis of movements and volume changing of the two halves (left and
right) of the chest wall.
9. Being non-invasive, non-joining and safe for the patient.
An OEP device able to track the three-dimensional co-ordinates of a number of reflecting
markers placed non-invasively on the skin of the subject satisfies many of these
characteristics. The simultaneous acquisition of kinematic signals with pleural and gastric
pressures during a relaxation manoeuvre allows the representation of pressure-volume
plots describing the mechanical characteristics of each compartment. The OEP system was
developed in 80’s by the Bioengineering Department of the University of Milano in order to
overcome as many of the previous limitations as possible (Pedotti et al., 1995; Cala et al.,
1996; Kenyon et al., 1997)
Here we quantify distortion in healthy and diseased rib cage using a method that requires
an accurate measurement of absolute volumes of upper and lower rib cage .
Optoelectronic Plethysmography for Measuring Rib Cage Distortion
81
2. Methods
2.1 Subjects and experimental protocol
We studied non-smoking healthy subjects experienced in physiological studies and in
performing respiratory manoeuvres, and patients with a number of respiratory disorders.
Fig. 1. Eighty-nine markers model.
Eighty-nine reflecting markers are placed in front and back over the trunk from the clavicles
to the anterior superior iliac spines along predefined vertical and horizontal lines. To
measure the Vcw compartments from the surface markers, we define the following: (i) the
diaphragm border confirmed by percussion at end-expiration in sitting position, (ii) the
boundaries of the upper rib cage (RCp) as extending from the clavicles to a line extending
transversely around the thorax corresponding to the top of the area of the apposition of the
diaphragm to the rib cage; (iii) the boundaries of lower rib cage (RCa) as extending from this
line to the lower costal margin anteriorly, and to the level of the lowest point of the lower
costal margin posteriorly, and (iv) the boundaries of the abdomen as extending caudally
from the lower rib cage to a horizontal line at the level of the anterior superior iliac spine.
Fig. 2. The coordinates of the landmarks were measured with a system configuration of six
infrared television cameras, three placed 4 m behind and three placed 4 m in front of the
subject at a sampling rate of ≥60 Hz.
Optoelectronics – Devices and Applications
82
2.2 Compartmental volume measurements
Volumes of the different chest wall compartments were assessed by using the ELITE system,
which allows computation of the 3-dimensional coordinates of 89 surface markers applied on
the chest wall surface with high accuracy (Cala et al., 1996). The markers, small hemispheres (5
mm in diameter) coated with reflective paper, were placed circumferentially in seven
horizontal rows between the clavicles and the anterior superior iliac spine. Along the
horizontal rows, the markers were arranged anteriorly and posteriorly in five vertical columns,
and there was an additional bilateral column in the mid-axillary line. In agreement with Cala
et al., (1996), the anatomic landmarks for the horizontal rows were 1) the clavicular line, 2) the
manubrio-sternal joint, 3) the nipples, 4) the xiphoid process, 5) the lower costal margin, 6)
umbilicus, and 7) anterior superior iliac spine. The landmarks for the vertical rows were 1) the
midlines, 2) both anterior and posterior axillary lines, 3) the midpoint of the interval between
the midline and the anterior axillary lines, and 4) the midaxillary lines. To measure volume of
chest wall (Vcw) compartments from the surface markers, we defined the following: (i)
confirmed by percussion at end-expiration in sitting position, the diaphragm border in the mid
clavicular line was always below the anterior end of the seventh rib, (ii) the boundaries of the
upper rib cage (RC, p) as extending from the clavicles to a line extending transversely around
the thorax corresponding to the top of the area of the apposition of the diaphragm to the rib
cage, (iii) the boundaries of lower rib cage (RC, a) as extending from this line to the lower
costal margin anteriorly, and to the level of the lowest point of the lower costal margin
posteriorly, and (iv) the boundaries of the abdomen as extending caudally from the lower rib
cage to a horizontal line at the level of the anterior superior iliac spine.
The coordinates of the landmarks were measured with a system configuration of six
infrared television cameras, three placed 4 m behind and three placed 4 m in front of the
subject at a sampling rate of 25-100 Hz. Starting from the marker coordinates, the thoraco-
abdominal volumes were computed by triangulating the surface. For closure of surface
triangulation, additional phantom markers were constructed as the average position of
surrounding points at the center of the caudal and cephalad extremes of the trunk. Volumes
were calculated from the surface triangulation between the marker points.
2.3 Pressure measurements
Pes and Pga were measured by using conventional balloon-catheter systems connected to
two 100-cmH
2
O differential pressure transducers (Validyne, Northridge, CA). Pes was used
as an index of pleural pressure and Pga as that of abdominal pressure (Pab). From the
pressure signals, we measured the following: Pes and Pga at end inspiration (PesEI and
PgaEI, respectively) and end expiration (PesEE and PgaEE, respectively) at zero-flow points.
The transdiaphragmatic pressure (Pdi) was obtained by subtracting Pes from Pga. Pdi at end
expiration during quiet breathing was assumed to be zero. The difference between PgaEI
and PesEI was defined as active Pdi and that between PgaEE and PesEE as passive Pdi. ΔPdi
was defined as the difference between passive Pdi and active Pdi. Pressure and flow signals
were synchronized to the kinematics signals of the OEP system and sent to an IBM-
compatible personal computer through an RTI 800 analogue-to-digital card for subsequent
analysis.
2.4 Rib cage and abdomen relaxation measurements
Relaxation characteristics of the chest wall were studied at rest. The subjects, in a sitting
position, inhaled to total lung capacity and then relaxed and exhaled through a high
Optoelectronic Plethysmography for Measuring Rib Cage Distortion
83
resistance. Relaxation manoeuvres were repeated until curves were reproducible, pressure at
the mouth returned to zero at functional residual capacity (FRC), and Pdi was zero throughout
the entire manoeuvre. The best relaxation curve was retained. To assess rib cage relaxation
characteristics, volume of pulmonary rib cage (Vrc,p) was plotted against Pes. The best fitting
linear (y = ab + x) regression for the Vrc,p-Pes curve was constructed to obtain a relaxation
curve of RC, p. The relaxation curve of the abdomen was obtained by plotting Pga vs. Vab
from end-expiratory volume of abdomen (Vab) to end-inspiratory Vab during quiet breathing;
we found a curvilinear relationship to which we fitted a second-order polynomial regression
(Sanna et al., 1999; Aliverti et al., 1997). (This was extrapolated linearly from higher and lower
values of Vab). This method was preferred to the actual data obtained during relaxation
because the latter were reliably obtained only at values of Vab greater than at FRC.
Fig. 3. Schematic representation of relationship between oesophageal pressure (Pes) and
volume of pulmonary rib cage(Vrc,p) during quiet breathing (continuous loop) and at 50 L
min
-1
of VE (dashed loop) assuming minimal rib cage distortion during leg exercise. The
thin line is the relaxation line. The closed circle is end expiratory volume. Measurement of
pressure generated by rib cage muscles at Vrc,p (thin line) is obtained from horizontal
distance between dynamic loop and the relaxation line at that volume during inspiration
(Prcm,i) and expiration (Prcm,e). Right: schematic representation of the relationship
between gastric pressure (Pga) and volume of the abdomen (Vab) at rest and at 50 L min
-1
of
ventilation (VE). The thin line is the relaxation line. Measurement of pressure generated by
abdominal muscles (Pabm) at that Vab is obtained from the horizontal distance between
gastric pressure and the relaxation line at that volume.
2.5 Cardiopulmonary exercise testing
Flow was measured with a mass flow sensor (Vmax 229; SensorMedics; 70 ml dead space)
near the mouthpiece and lung volume changes were obtained by integrating the flow signal.
A gas mixture (inspiratory oxygen fraction of 0.50 balanced with nitrogen) was inspired by
the patients from a Douglas bag through a two-way non-rebreathing valve (mod 27900;
Hans-Rudolph, Kansas City, MO, USA, 115 ml dead space). The flow into the Douglas bag
was constant and patients breathed the gas mixture at the rate they demanded. We carefully
reduced the impedance of the tubing by increasing its width and minimizing its length. To
ascertain the linearity of the analyzer we used a 0.50 oxygen calibration cylinder. During the
test flow rate at the mouth and gas exchange were recorded breath-by-breath (Vmax 229,
Optoelectronics – Devices and Applications
84
SensorsMedics). Expired gas was analyzed for oxygen
uptake (V'
O2
), and carbon dioxide
production (V'
CO2
). Cardiac frequency was continuously
measured using a 12-lead
electrocardiogram and oxygen saturation was measured using a pulse oxymeter
(NPB 290;
Nellcore Puritan Bennett, Pleasanton, CA, USA). The equipment was calibrated immediately
before each test. V'
CO2
and V'
O2
were expressed as standard temperature, pressure and dry.
The flow signal was synchronized to that of the motion analysis used for OEP and sent to a
personal computer for subsequent analysis.
3. Analysis of the data
3.1 Operational chest wall volume measurements
To measure the Vcw compartments from the surface markers, we defined the following: (i)
confirmed by percussion at end expiration in sitting position, the diaphragm border in the
mid clavicular line was always below the anterior end of the seventh rib, (ii) the boundaries
of the upper rib cage (RCp) as extending from the clavicles to a line extending transversely
around the thorax corresponding to the top of the area of the apposition of the diaphragm
to the rib cage; (iii) the boundaries of lower rib cage (RCa) as extending from this line to the
lower costal margin anteriorly, and to the level of the lowest point of the lower costal
margin posteriorly, and (iv) the boundaries of the abdomen as extending caudally from the
lower rib cage to a horizontal line at the level of the anterior superior iliac spine. The
arrangement of the chosen markers and the geometric model allow the computation of the
contribution of rib cage and abdomen to tidal volume (VT). The difference between the end-
inspiratory and end-expiratory volumes of each compartment was calculated as the VT
. The
OEP calculates absolute volumes. The absolute volume of each compartment at functional
residual capacity (FRC) in control conditions was considered as the reference volume.
Volumes are reported either as absolute values or as changes from the volume at FRC in
control conditions. The total chest wall volume (Vcw) was modeled as the sum of volume of
the upper rib cage, i.e., the rib cage apposed to the lung (Vrc,p), volume of the lower rib
cage, i.e., the rib cage apposed to the abdomen (Vrc,a) and volume of the abdomen (Vab).
Thus, the Vcw was calculated as Vcw = Vrc+Vab and changes (∆) in Vcw were calculated as
∆Vcw = ∆Vrc+∆Vab. The time course of the volume of each region (Vrc,p, Vrc,a and Vab)
along their sum (Vcw) was processed to obtain a breath-by-breath assessment of both
ventilatory pattern and operational chest wall volume . From VT and respiratory frequency,
VE was calculated. VT was simultaneously measured by using a mass flow sensor (sVT).
The volume accuracy of the OEP system was tested by comparing VToep to sVT. All
respiratory cycles at rest and during walking were pooled for each subject.
The time course of the volume of each region (Vrc,p, Vrc,a and Vab) and their sum (Vcw)
was processed to obtain a breath-by-breath assessment of both ventilatory pattern and
operational chest wall volume (Johnson et al., 1999; Gorini et al., 1999).
3.2 Rib cage distortion measurements
a) The undistorted rib cage configuration was defined by plotting Vrc,p against Vrc,a during
relaxation. Rib cage distortion was evaluated by comparing Vrc,p-Vrc,a at rest and during
exercise to the undistorted rib cage configuration, according to the method of Chihara et al
(1996). Thus we measured the perpendicular distance of the distorted configuration away
from the relaxation line and divided it by the value of Vrc,p at the insertion point. This
results in a dimensionless number, which, when multiplied by 100, gives percent distortion.
Optoelectronic Plethysmography for Measuring Rib Cage Distortion
85
b) Because most patients were unable to relax their respiratory muscles enough to yield
accurate and meaningful relaxation volume-pressure curves of the thorax, the presence of rib
cage distortion was established by: 1. comparing the time courses of Vrc,p vs Vrc,a and 2. the
phase shift between Vrc,a and Vrc,p when these two volumes were plotted against each other.
This was measured as the ratio of distance delimited by the intercepts of Vrc,p versus Vrc,a
dynamic loop on line parallel to the X-axis at 50% of RCp tidal volume (m), divided by RCa
tidal volume (s), as θ= sin
-1
(m s
-1
), as previously adopted approach (Agostoni & Mognoni,
1996; Aliverti et al., 2009) (Fig. 5). In this system a phase angle of zero represents a completely
synchronous movement of the compartments and 180° total asynchrony. Rib cage to abdomen
displacement was assessed by the ratio of changes in Vrc to change in Vab.
The rest signals were recorded over a 3-min period after a 10-min period of adaptation to
equipment. In each patients, the volume tracings were normalized with respect to time to
allow ensemble averaging over three reproducible consecutive breaths chosen within the
period of interest (rest, warm-up, each minute of exercise) and to derive an average
respiratory cycle over each of the data acquisition periods. Inspiratory and expiratory
phases of the breathing cycles were derived from the Vcw signal.
3.3 Respiratory muscle pressure measurements
The pressure developed by inspiratory and expiratory rib cage muscles (Prcm,i and Prcm,e,
respectively) and that developed by the abdominal muscles (Pabm) were measured as the
difference between the Pes-Vrc,p loop and the relaxation pressure-volume curve of RCp and
between the Pga-Vab loops and the relaxation pressure-volume curve of the abdomen,
respectively, according to the method of Aliverti et al. (1997).
Fig. 4. The undistorted rib cage configuration is defined by plotting Vrc,p against Vrc,a
during relaxation. Rib cage distortion is evaluated by comparing Vrc,p-Vrc,a at rest and
during exercise to the undistorted rib cage configuration. Individual Vrc,p–Vrc,a plot at
quiet breathing (QB) and at 50 L of VE In a representative subject. Continuous lines:
relaxation lines. Continuous loops: respiratory cycle at QB. Dotted loops: respiratory cycle
during leg exercise; dashed loops: respiratory cycle during arm exercise.
Optoelectronics – Devices and Applications
86
Fig. 5. In patients unable to relax their respiratory muscles enough to yield accurate and
meaningful relaxation volume-pressure curves of the thorax, the presence of rib cage
distortion is established by: 1. comparing the time courses of Vrcp, Vrca and 2. the phase
shift between Vrc,a and Vrc,p when these two volumes are plotted against each other. This
is measured as the ratio of distance delimited by the intercepts of Vrcp, Vrca dynamic loop
on line parallel to the X-axis at 50% of RCp tidal volume (m), divided by RCa tidal volume
(s), as θ= sin
-1
(m s
-1
). In this system a phase angle of zero represents a completely
synchronous movement of the compartments and 180° total asynchrony.
4. Results and discussion
4.1 OEP vs pneumotachograph volume
We compared change in Vcw during inspiration obtained by OEP (∆Vcw) with inspired
volumes obtained by integration of flow (∆Vm). Also, the linear regression analysis between
∆Vcw and ∆Vm calculated simultaneously over a period of 20s yielded the following
equation: r:0.94, Y= -0.103+1.093X. The small discrepancy we found between VToep and
VTm may be explained as follows. While pneumotachograph measures the volume of the
lung OEP measures the volume of the trunk. This includes volume changes in the mouth,
gas compression and decompression in the lung, and blood shift between trunk and
extremity.
4.2 Physiology
4.2.1 Effect of exercise
Studies concerning chest wall mechanics during exercise or walking in normal humans
(Kenyon et al., 1997; Aliverti et al., 1997; Sanna et al., 1999; Duranti et al., 2004) have used
OEP to investigate a new aspect of respiratory mechanics: the rib cage distortion, that is due
to the different pressure acting on the volumes of the lower (abdominal) and upper rib cage
i,e., the non diaphragmatic inspiratory/expiratory muscles acting on volume of the upper
Optoelectronic Plethysmography for Measuring Rib Cage Distortion
87
rib cage, and diaphragm and abdominal muscles acting on volume of the lower rib cage.
The volume distortion surprisingly is <1% (Kenyon et al., 1997; Aliverti et al., 1997; Sanna et
al., 1999). Thus, during exercise, the diaphragm, rib cage and abdominal muscles are
coordinated so that rib cage distortion, although measurable, is minimised. In particular, the
progressive relaxation of abdominal muscles observed during inspiration could prevent
volume of the lower rib cage from an unbalanced expansion with respect to volume of the
upper rib cage. (Aliverti et al., 1997; Sanna et al., 1999; Duranti et al., 2004)
4.2.2 Effect of coughing
The three-compartment model of the chest wall dictates that contraction of the abdominal
muscles has both a deflationary action on the lower rib cage via their insertional components
(the rectus and obliquus muscles), and an inflationary action via their non-insertional
components (the trasversus muscle), the net effect being that upper rib cage deflation is
commensurate with lower rib cage deflation (Kenyon et al., 1999). However, if forces applied
to the upper rib cage are out of proportion with those applied to the lower rib cage, distortion
might ensue during fits of coughing. In this way the abdominal rib cage is exposed to greater
positive abdominal pressure at the end of expiration during cough (Man et al., 2003). Lanini et
al., (2007) therefore hypothesized that uneven distribution of operating forces may results in
rib cage distortion during coughing. The results obtained in 12 healthy subjects during
voluntary single and prolonged coughing efforts at functional residual capacity and after
maximal inspiration (max) showed that the three chest wall compartments contributed to
reducing end expiratory volumes of the chest wall during coughing at functional residual
capacity and prolonged maximum coughing, with the latter resulting in the greatest chest wall
deflation. Mean rib cage distortion, did not differ between men and women, but tended to
significantly increase from single to prolonged coughing maximum. Lanini et al. (2007)
therefore concluded that rib cage distortion may ensue during coughing, probably as a result
of uneven distribution of forces applied to the rib cage.
4.3 Pathophysiology
4.3.1 Neuromuscular diseases (NMD)
NMD are characterized by progressive loss of muscle strength resulting in cough
ineffectiveness with deleterious effects on the respiratory system (Bach, 1993; Bach, 1997).
Assessment of cough effectiveness is therefore a prominent component of the clinical
evaluation and respiratory care in these patients. Owing to uneven distribution of muscle
weakness in neuromuscular patients (De Troyer & Estenne 1995). Lanini et al., (2008)
hypothesized that forces acting on the chest wall may have impact on the compartmental
distribution of gas volume resulting in a decrease in cough effectiveness. The current
authors have shown that unlike controls patients were unable to reduce end expiratory chest
wall volume and exhibited greater rib cage distortion during cough. Peak cough flow was
negatively correlated with rib cage distortion, the greater the former the smaller the latter,
but not with respiratory muscle strength. Therefore, insufficient deflation of chest wall
compartments and marked rib cage distortion resulted in cough ineffectiveness in these
neuromuscular patients.
4.3.2 Pathology of the rib cage
Few detailed physiological studies have been carried out in young pectus excavatum PE
subjects either preoperatively or postoperatively (Mead et al., 1985); it has been suggested
Optoelectronics – Devices and Applications
88
however that the depression of the sternum limits the movement of the ribs especially in the
lower ones, thus preventing the expansion of the lower thoracic cross-sectional area
(Koumbourlis, 2009). On theoretical grounds uncoordinated displacement of chest wall
compartments is not unexpected in these patients, considering that a non-uniform
distribution of pressure over the different parts may distort the rib cage (Crawford et al.,
1983; McCool et al., 1985; Chihara et al., 1996; Ward et al., 1992; Kenyon et al., 1997). By
contrast, recent studies (Kenyon et al., 1997, Aliverti et al., 1997; Sanna et al., 1999;
Romagnoli et al., 2006) have shown that the expiratory action of the abdominal muscles
plays a key role in minimizing rib cage distortion during sustained ventilatory effort in
healthy subjects. Moreover, a normal swing in abdominal pressure with a normal
abdominal pressure-volume loop is associated with normal rib cage mobility during
increased ventilation in PE patients (Mead et al., 1985). In keeping with these data, the
preliminary results of our laboratory (Binazzi et al., 2009) indicate a normal reduction in
end-expiratory abdominal volume (suggestive of phasic expiratory activity) during
hyperventilation in PE patients. Collectively these data allow us to hypothesize that a
coordinated motion of upper to lower rib cage prevents distortion during ventilatory tasks
in PE patients. It has been suggested that the rib cage fails to move up and out during
inspiration (Whol et al., 1995). Available data, however, argue against this possibility
(Koumbourlis, 2009; Mead et al., 1985). Plotting of upper rib cage volume (Vrc,p) vs lower
rib cage volume (Vrc,a) we were able to find a normal phase angle degree at QB and
through maximal voluntary ventilation in control subjects and in a few PE patients.
4.3.3 Asthma
The mechanics of the chest wall was studied in asthmatic patients before and during
histamine-induced bronchoconstriction. The volume of the chest wall (Vcw), pleural and
gastric pressures were simultaneously recorded. Vcw was modeled as the sum of the
volumes of the pulmonary-apposed rib cage (Vrc,p), diaphragm-apposed rib cage (Vrc,a),
and abdomen (Vab). During bronchoconstriction, hyperinflation was due to the increase in
end-expiratory volume of the rib cage, whereas change in Vab was inconsistent because of
phasic recruitment of abdominal muscles during expiration. Changes in end-expiratory
Vrc,p and Vrc,a were along the rib cage relaxation configuration, indicating that both
compartments shared proportionally the hyperinflation. Vrc,p-Ppl plot during
bronchoconstriction was displaced leftward of the relaxation curve, suggesting persistent
activity of rib cage inspiratory muscles throughout expiration. Changes in end-expiratory
Vcw during bronchoconstriction did not relate to changes in airway obstruction or time and
volume components of the breathing cycle. We concluded that during bronchoconstriction
in asthmatic patients: (1) rib cage accounts largely for the volume of hyperinflation, whereas
abdominal muscle recruitment during expiration limits the increase in Vab; (2)
hyperinflation is influenced by sustained postinspiratory activity of the inspiratory muscles;
(3) this pattern of respiratory muscle recruitment seems to minimize volume distortion of
the rib cage at end-expiration and to preserve diaphragm length despite hyperinflation
(Gorini et al., 1999).
4.3.4 Chronic obstructive pulmonary disease (COPD)
Lung hyperinflation in patients with chronic obstructive pulmonary disease (COPD) places
the respiratory muscles at a mechanical disadvantage and impairs their force generation
capacity (De Troyer, 1997). Clinical evidence of the diaphragm’s vulnerability in the effect of
Optoelectronic Plethysmography for Measuring Rib Cage Distortion
89
hyperinflation is abundant (Sharp, 1985). One indicator of diaphragm dysfunction is
Hoover’s sign (Hoover, 1920) consisting of inward movement of the lower lateral rib cage
during inspiration. However, the basis of abnormal rib cage motion and the effect of
hyperinflation on rib cage distortion have not been systematically examined in patients with
COPD. Some factors argue against a close relationship between Hoover’s sign and
hyperinflation: (i) the primary factor contributing to rib cage distortion in COPD patients is
an abnormal alteration of the forces applied to the pulmonary and abdominal rib cage, with
hyperinflation making only a minor contribution (Jubran & Tobin, 1992); (ii) hyperinflation
produces a decrease in airway resistance (Briscoe & Dubois, 1958) which may account for
the greater degree of abnormal CW motion observed with resistive loading (Tobin et al.,
1987) than with hyperinflation (Jubran & Tobin, 1992); (iii) hyperinflation is closely linked to
expiratory flow limitation which at least theoretically, can be due entirely to loss of lung
elastic recoil and tracheo or bronchomalacia. We therefore asked whether hyperinflation
would produce rib cage distortion per se. We hypothesized that lung hyperinflation and rib
cage distortion (Binazzi et al., 2008) could independently define the functional conditions of
COPD patients. We based the hypothesis on the following observations: (i) a remarkable
directed correlation has been found between abdominal rib cage compliance and
distortability (Chihara et al., 1996), and (ii) passive tension in the abdominal muscles exerts
an important deflationary action on abdominal rib during tidal inspiration (Kenyon et al.,
1997). Rib cage distortion associated with Hoover’s sign was indicated by the negative
values of Vrc,p/Vrc,a which contrasted with the positive values in patients without
Hoover’s sign. Most importantly, the fact that we found a lack of any significant relationship
between quantitative indices of Hoover’s sign and functional residual capacity validates the
starting hypothesis that rib cage volume distortion cannot be fully explained by static
hyperinflation in patients with COPD. Chihara et al. (1996) have also speculated that when
rib cage distortion is present the greater the distortability the greater the degree of
recruitment of inspiratory rib cage muscles and the greater the predisposition to dyspnea for
a given load and strength (Ward & Macklem 1992). On the other hand, the role of
hyperinflation on abnormal chest movement is questionable (Binazzi et al., 2008; Hoover,
1920; Aliverti et al., 2009; Joubran & Tobin, 1992; O’Donnell et al., 1997; O’Donnell et al.,
2001). By contrast, Aliverti et al., (2009) have shown that lower rib cage paradox yields to an
early onset of dynamic hyperinflation as a likely explanation for the increased dyspnea
during incremental exercise in these patients. Contradicting this interpretation we have
shown that, neither rib cage distortion nor, despite being reduced, dynamic lung
hyperinflation do not contribute to oxygen-induced decrease in dyspnea in exercising
normoxic COPD patients.
The coordinated respiratory muscle action translates into proportional changes in the
volume of the CW compartments when human beings cycle, run or walk (Sanna et al., 1999;
Aliverti et al., 1997; Duranti et al., 2004). This complex interaction between the diaphragm,
inspiratory rib cage muscles, and abdominal muscles is poorly understood during
unsupported arm exercise [UAE]. Comparing UAE with leg exercise [LE] in normal subjects
Celli et al. (1988) found that UAE resulted in less ventilatory contribution of inspiratory
muscles of the rib cage and more contribution by the diaphragm and abdominal muscles. In
a two compartment rib cage model this shift in dynamic work results in rib cage distortion
(Kenyon et al., 1997). Romagnoli et al., (2006) therefore hypothesized that a decrease in
pressure contribution of the rib cage inspiratory muscles, and increase in pressure
production of the diaphragm and abdominal muscles with UAE might be associated with
Optoelectronics – Devices and Applications
90
rib cage distortion as opposed to undistorted configuration during LE at comparable
ventilation. The results showed that unlike LE, with UAE inspiratory pressure production of
the rib cage muscles did not significantly increase from quiet breathing. However, no clear-
cut differences in rib cage distortion were found between UAE and LE. What is the clinical
relevance of this study? Based on the present results and those in patients with ankylosing
spondylitis and rib cage rigidity (Romagnoli et al., 2004) we speculate that diverting rib cage
muscles from ventilatory function to postural function limits inspiratory rib cage expansion
more than some degree of rib cage rigidity does. This may have negative ventilatory
consequences in severely hyperinflated patients with chronic obstructive pulmonary disease
(COPD) who unlike the subjects of the present study are not able to deflate the rib cage and
abdominal compartments to maintain an adequate tidal volume when using rib cage
muscles for daily living activities.
4.3.5 Rib cage distortion and dyspnea
Both the joint and muscles receptors should sense the deformation of the chest wall
occurring during hyperventilation and breathing through resistance. The information sent
by these receptors could alter the pattern of activity of some respiratory muscles. Because of
the phase shift between the change of lung volume and those of some parts of the rib cage
there might be a phase shift between the different impulses from the lung receptors and the
those of the rib cage. This paradoxical information contributes to a sensation of dyspnea
(Agostoni & Mognoni, 1996). More recently Chihara et al., (1996) have speculated that when
rib cage distortion is present the greater the distortability the greater the degree of
recruitment of inspiratory rib cage muscles and the greater the predisposition to dyspnea for
a given load and strength. However our recent data shown that BORG score on air did not
differ between patients with and without rib cage distortion, and that changes in BORG
with oxygen associated with no change in phase shift do not provide evidence that rib cage
distortion plays a major role in the perceived sense of breathlessness. But that does not mean
that it could not contribute as we do not have any evidence that phase shift accurately
reflects the different pressures acting on lower and upper rib cage (Chihara et al., 1996;
Kenyon et al., 1997), or energy wasted during inspiration on rib cage distortion. Further
studies in these patients are needed to assess the relationship between changes in the
applied muscle pressures, displacement of chest wall compartment, rib cage phase shift, and
dyspnea during exercise, on air and oxygen.
Either dyspnea or leg effort, or both may be the principal complaints for stopping exercise in
patients with COPD (O’Donnell et al., 1997; O’Donnell et al., 2001) Regardless of whether
patients dynamically hyperinflated or deflated the chest wall, or distorted the rib cage, was
dyspnea the primary symptom limiting exercise. These data are in keeping with those of
Iandelli et al., ( 2002) who have found that externally imposed expiratory flow limitation
does not necessarily lead to dynamic hyperinflation, nor to impaired exercise performance
in subjects who do not hyperinflate the chest wall, and does not contribute to dyspnea in
subjects who hyperinflate until the highest expiratory flow limitation exercise level is
reached. Collectively these data are not in line with a previous report (Aliverti et al., 2009)
showing that an early onset of dynamic hyperinflation of the chest wall is the most likely
explanation of predominance of dyspnea in patients with rib cage distortion, and that when
paradox is absent the sense of leg effort becomes a more important symptom limiting
exercise. The effort-dependent nature of different exercise tests, underlying multifactorial
mechanisms, and subjective nature of dyspnea scaling might account for these different
Optoelectronic Plethysmography for Measuring Rib Cage Distortion
91
results. In conclusion, the rib cage paradox, changes in chest wall dimension and dyspnea
do not appear to be closely interrelated phenomena during exercise in COPD patients.
4.3.6 Study limitations
The limitations of OEP in assessing the relative changes in Vrc,p and Vrc,a might be the
changes in the cephalic margin of the zone of apposition, i.e., in the area over which the rib
cage is effectively exposed to abdominal pressure (Chihara et al., 1996). Inasmuch as the
area of apposition is diminished in patients with COPD, the abdominal rib cage is
considerably smaller than normal. However, to the extent that abdominal displacement is
the principal determinant of the upper boundary of the area of apposition (Kenyon et al.,
1997), the similarity of this displacement at end inspiration during rest and exercise suggests
that its caudal excursion during inspiration is not greatly affected by exercise. We therefore
believe that an error, if any exists, introduced by defining the boundary of the upper limit of
the area of apposition on the dynamics of abdominal rib cage and pulmonary rib cage
would not qualitatively affect our results.
5. References
Agostoni, E. & D’Angelo E. (1985). Statics of the chest wall. In: The Thorax, Editor, Roussos,
Macklem, pp. 259-295, Publisher, Marcel Dekker, New York
Jiang, TX. Demedts, M. & Decramer, M. (1988). Mechanical coupling of upper and lower
canine rib cage and its functional significance. Journal of Applied Physiology, Vol. 64,
pp. 620-626
Ward, MEJW. & Macklem, PT. (1992). Analysis of human chest wall motion using a two
compartment rib cage model. Journal of Applied Physiology, Vol.72, pp. 1338-1347
Ringel, ER. Loring, SH. Mcfadden, ER. &. Ingram, RH. (1983). Chest wall configurational
changes before and during acute obstructive episodes in asthma. American Review of
Respiratory Disease, Vol.128, pp. 607-610
Urmey, WF. Loring, SH. Mead, J. Brown, R. Slutsky, AS. Sarkarati, MS. & Rossier, A. (1981).
Rib Cage (Rc) Mechanics In Quadriplegic Patients. Physiologist , Vol. 24, No. 4, pp.
97
Crawford, ABH. Dodd, D. & Engel, LA. (1983). Changes in the rib cage shape during quiet
breathing, hyperventilation and single inspiration. Respiratory Physiology, Vol 54,
pp. 197-209
McCool, FD. Loring, SH. & Mead J. (1985). Rib cage distortion during voluntary and
involuntary breathing acts. Journal of Applied Physiology. Vol. 58, No5, pp. 1703-1712
D’Angelo, E. (1981). Cranio-caudal rib cage distortion with increasing inspiratory airflow in
man. Respiratory Physiology. Vol. 44 pp. 215-237
Roussos, CS. Fixley, M. Geneset, J. Cosio, M. Kelly, S. Martin, RR. & Engel, LA. (1977).
Voluntary factors influencing the distribution of inspired gas. American Review of
Respiratory Disease. Vol. 116, pp. 457-467, ISSN
Agostoni, E. & Mognoni, PJ. (1966). Deformation of the chest wall during breathing efforts.
Journal of Applied Physiology. Vol. 21, No. 6, pp. 1827-1832.
Sackner, MA. (1980). Monitoring of ventilation without a physical connection to the airway.
In: Diagnostic Techniques in Pulmonary Disease, Part I Volume 1. pp. 508, Publisher:
Marcel Dekker, New York.
Optoelectronics – Devices and Applications
92
Gilbert, R. Auchincloss, JH. Brodsky, J. & Boden, W. (1972). Changes in tidal volume,
frequency and ventilation induced by their measurement. Journal of Applied
Physiology, Vol. 33, pp. 252-254
Henke, KG. Sharratt, M. Pegelow, D. & Dempsey, JA. (1988). Regulation of end expiratory
lung volume during exercise. Journal of Applied Physiology, Vol. 64, pp. 135-146
Pedotti, A. & Ferrigno, G. (1995). Opto-electronics based systems. In Three-Dimensional
Analysis of Human Movement, Human Kinetics, 1st Ed, Editors, Allard, P. Stokes, IA.
Bianchi, J. pp. 57-78, Publishers, Human Kinetics. Champaign, USA.
Cala, SJ. Kenyon, CM. Ferrigno, G. Carnevali, P. Aliverti, A. Pedotti, A. Macklem, P.T. &
Rochester, DF. (1996). Chest wall and lung volume estimation by optical reflectance
motion analysis. Journal of Applied Physiology, Vol. 81, pp.2680-2689
Kenyon, CM. Cala, SJ. Yan, S. Aliverti, A. Scano, G. Duranti, R. Pedotti, A. & Macklem, P.T.
(1997). Rib cage mechanics during quiet breathing and exercise in humans. Journal
of Applied Physiology, Vol. 83, pp. 1242–1255
Sanna, A. Bertoli, F. Misuri, G. Gigliotti, F. Iandelli, I. Mancini, M. Duranti, R. Ambrosino, N.
& Scano, G. (1999). Chest wall kinematics and respiratory muscle action in walking
healthy man. Journal of Applied Physiology, Vol. 87, pp. 938-946
Aliverti, A. Cala, SJ. Duranti, R. Ferrigno, G. Kenyon, CM. Pedotti, A. Scano, G. Sliwinsky, P.
Macklem, PT. & Yan, S. (1997). Human respiratory muscle actions and control
during exercise. Journal of Applied Physiology, Vol. 83, pp.1256-1269
Duranti, R. Sanna, A. Romagnoli, I. Nerini, M. Gigliotti, F. Ambrosino, N. & Scano, G.
(2004). Walking modality affects respiratory muscle action and contribution to
respiratory effort. Pflugers Archives, Vol.448, pp.222-230
Romagnoli, I. Gigliotti, F. Lanini, B. Bianchi, R. Soldani, N. Nerini, M. Duranti, R. & Scano,
G. (2004). Chest wall kinematics and respiratory muscle coordinated action during
hypercapnia in healthy males. European Journal of Applied Physiolology, Vol. 91,
pp.525-533
Romagnoli, I. Gigliotti, F. Galarducci, A. Lanini, B. Bianchi, R. Cammelli, D. & Scano, G.
(2004) Chest wall kinematics and respiratory muscle action in ankylosing
spondylitis patients. European Respiratory Journal, Vol. 24, pp. 453-460
Romagnoli, I. Gorini, M. Gigliotti, F. Bianchi, R. Lanini, B. Grazzini, M. Stendardi, L. &
Scano, G. (2006). Chest wall kinematics, respiratory muscle action and dyspnoea
during arm vs. leg exercise in humans. Acta Physiologica (Oxf), Vol. 188, pp. 63-73
Binazzi, B. Lanini, B. Bianchi, R. Romagnoli, I. Nerini, M. Gigliotti, F. Duranti, R. Milic-Emili,
J. & Scano, G. (2006). Breathing pattern and kinematics in normal subjects during
speech, singing and loud whispering. Acta Physiologica (Oxf), Vol. 186, pp. 233-246.
Filippelli, M. Pellegrino, R. Iandelli, I. Misuri, G. Rodarte, J.R. Duranti, R. Brusasco, V. &
Scano, G. (2001). Respiratory dynamics during laughter. Journal of Applied
Physiology, Vol. 90, pp. 1441-1446
Lanini, B. Bianchi, R. Binazzi, B. Romagnoli, I. Pala, F. Gigliotti, F. & Scano, G. (2007). Chest
wall kinematics during cough in healthy subjects. Acta Physiologica (Oxf), Vol. 190,
pp. 351-358
Gorini, M. Iandelli, I. Misuri, G. Bertoli, F. Filippelli, M. Mancini, M. Duranti, R. Gigliotti, F.
& Scano, G. (1999). Chest wall hyperinflation during acute bronchoconstriction in
asthma. Ame
rican Journal of Respiratory and Critical Care Medicine, Vol. 160, pp. 808-
816
Optoelectronic Plethysmography for Measuring Rib Cage Distortion
93
Filippelli, M. Duranti, R. Gigliotti, F. Bianchi, R. Grazzini, M. Stendardi, L. & Scano, G.
(2003). Overall contribution of chest wall hyperinflation to breathlessness in
asthma. Chest, Vol. 124, pp. 2164-2170
Johnson, BD. Weisman, IM. Zeballos, RJ. & Beck, KC. (1999). Emerging concepts in
evaluation of ventilatory limitation during exercise: the excessive tidal flow-
volume loop. Chest, Vol. 116, pp. 488-503
Chihara, K. Kenyon, CM. Macklem, PT. (1996). Human rib cage distortability. Journal of
Applied Physiology. Vol. 81, No.1, pp. 437-447.
Aliverti, A. Quaranta, M. Chakrabarti, B. Albuquerque, ALP. & Calverley, PM. (2009).
Paradoxical movement of the lower ribcage at rest and during exercise in COPD
patients. European Respiratory Journal, Vol. 33, pp. 49-60
Man, WD. Kyroussis, D. Fleming, TA. Chetta, A. Harraf, F. Mustfa, N. Rafferty, GF. Polkey,
MI. & Moxham, J. (2003). Cough gastric pressure and maximum expiratory mouth
pressure in humans. American Journal of Respiratory and Critical Care Medicine, Vol.
68, pp. 714-717
Bach, JR. (1993). Mechanical insufflation-exsufflation: comparison of peak expiratory flows
with manually assisted and unassisted coughing techniques. Chest, Vol. 104, pp.
1553-1562
Bach, JR. Ishikawa, I. & Kim, H. (1997). Prevention of pulmonary morbidity for patients with
Duchenne muscular dystrophy. Chest, Vol.112, pp. 1024–1028
De Troyer, A. & Estenne, M. (1995). Respiratory system in neuromuscular disorders. In: The
Thorax Part C, Editor, Roussos, C. pp. 2177–2212. Publisher, Marcel Dekker, New
York, NY
Lanini, B. Masolini, M. Bianchi, R. Binazzi, B. Romagnoli, I. Gigliotti, F. & Scano G. (2008).
Respiratory Physiology and Neurobiology, Vol. 161, No. 1, pp. 62-68
Mead, J. Sly, P. Le Souefm, P. Hibbert, M. & Phelan, P. (1985). Rib cage mobility in Pectus
Excavatum. American Review of Respiratory Disease. Vol. 132 pp.1223-1228
Koumbourlis, C. (2009). Pectus excavatum: Pathophysiology and clinical characteristics.
Paediatric Respiratory Reviews, Vol.10 pp. 3-6
Binazzi, B. Coli, C. Innocenti Bruni, G. Gigliotti, F. Messineo, R. Lo Piccolo, R. Romagnoli, I.
Lanini, B. & Scano, G. (2009). Breathing pattern and chest wall kinematics in
patients affected by pectus excavatum. European Respiratory Journal, Vol. 34 No. 53
Whol, ME. Stark, A. & Stokers, DC. (1995). Thoracic disorders in Childhood. In The Thorax
Part C, Disease, Editor, Roussos, C. pp. 2035-2069. Publisher, Marcel Dekker New
York, NY
De Troyer, A. (1997). Effect of hyperinflation on the diaphragm. European Respiratory Journal,
Vol.10, pp. 708–713
Sharp, JT. (1985). The chest wall and respiratory muscles in airflow limitation. In: The Thorax:
Vital pump. Lung Biology in Healthy and Disease Series, Editors, Macklem, PT.
Roussos, C. & Lenfant, C. pp. 1155–1202, Publisher, Marcel Dekker, NewYork, NY
Hoover, CF. (1920). The diagnostic significance of
inspiratory movements of the costal
margins. American Journal. Medical Sciences. Vol. 159, pp. 633–646
Jubran, A. & Tobin, MJ. (1992). The effect of hyperinflation on rib cage-abdominal motion.
American Review of Respiratory Disease, Vol. 146, pp. 1378–1382