Progress in Biomass and Bioenergy Production Part 3 doc
Bạn đang xem bản rút gọn của tài liệu. Xem và tải ngay bản đầy đủ của tài liệu tại đây (6.36 MB, 30 trang )
Thermal Plasma Gasification of Biomass
49
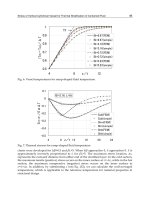
Fig. 9. Gasification rate of wood particles in dependence on reactor temperature for various
particle diameters
It can be seen that the particle diameter substantially influences both the surface
temperature and the gasification rate. Increase of the diameter results in reduction of heat
transfer to the particle due to more intensive shielding of the particle by gas sheath formed
from volatilized material. From the dependence of process rate on the size of particles a
relation between throughput and minimum volume of the reactor can be estimated. The
relation between total volume of particles of given diameter and gasification rate can be
calculated from the equations (10) – (14). In Fig. 10 the ratio of total volume of particles to
material throughput is plotted in dependence on reactor temperature for several particle
diameters. A minimum reactor volume needed for given material throughput can be
determined from these dependences assuming that reactor volume should be several times
800 1000 1200 1400 1600 1800
Reactor gas temperature [
0
C]
0.01
0.1
1
10
100
V/M
feed
[m
3
hour/kg]
D=50 mm
D=5 mm
D=10 mm
D=1 mm
Fig. 10. Ratio of volume occupied by particles to total gasification rate
Progress in Biomass and Bioenergy Production
50
higher than volume occupied by particles to ensure good heat transfer to the particles. It can
be seen from the Fig. 10 that needed volume of reactor rapidly increases with the size of the
particles. The increase of the reactor volume leads to the increase of power loss P
react
(T
r
) in
equation (4). Optimal reactor volume can be determined on the basis of analysis of relations
between process rate and power loss for given size of the particles.
4. Gasification of organic materials in steam plasma
Plasma gasification of biomass was studied in the recent years in several papers [Tang 2005,
Brothier 2007, Hrabovsky 2006, Tu Wen Kai 2008, Tang 2005, Xiun 2005]. Up to now only
laboratory scale experimental investigations of plasma biomass gasification have been
performed. Production of syngas from wood in plasma generated in ac air plasma torches
was studied in [Rutberg 2004]. In these experiments plasma with high flow rates and
enthalpy not higher then 8 MJ/kg was used. The high flow rate of plasma ensures good
mixing of plasma with treated material and a uniform temperature distribution in the
reactor. However, the produced syngas contains plasma gas components, usually nitrogen
and oxygen if air or nitrogen are used as plasma gases [Rutberg 2004, Zasypkin 2001]. The
usage of mixtures of inert gas with hydrogen [Zhao 2001, Zhao 2003] eliminates this
disadvantage but it increases the cost. In [Kezelis 2004] biomass was gasified in steam
plasma, the usage of produced syngas as plasma gas in a special plasma torch is planned in
[Brothier 2007]. This chapter presents the experimental results obtained in medium scale
thermal plasma gasification reactor equipped by the gas-water dc plasma torch with arc
power up to 160 kW.
4.1 Plasma gasification reactor
The experiments were performed on plasma reactor PLASGAS equipped by plasma torch with
a dc arc stabilized by combination of argon flow and water vortex. The scheme of the
experimental system is shown in Fig. 11. The torch power could be adjusted in the range of 90 -
160 kW. Power loss to the reactor walls was reduced by the inner lining of the reactor, which
was made of special refractory ceramics with the thickness of 400 mm. The wall temperature
1100
0
to 1400
o
C could be regulated by the torch power and feeding rate of the material. Inner
volume of the reactor was 0.22 m
3
. All parts of the reactor chamber were water-cooled and
calorimetric measurements on cooling circuits were made. The material container was
equipped with a continuous screw conveyer with controlled material feeding rate. Treated
material was supplied into the reactor and was fed into plasma jet in the position about 30 cm
downstream of the input plasma entrance nozzle at the reactor top. Inputs for additional gases
for control of reactor atmosphere were at three positions in the upper part of the reactor. The
gas produced in the reactor flowed through the connecting tube to the quenching chamber,
which was created by a cylinder with the length of 2 m. At the upper entrance of the cylinder
the gas was quenched by a spray of water from the nozzle, positioned at the top of the
cylinder. The water flow rate in the spray was automatically controlled to keep the
temperature of gas at the output of the quenching chamber at 300
o
C. The gas then flows into
the combustion chamber where it is combusted in the flow of the air. To prevent destruction of
ceramic insulation wall the reactor was pre-heated prior to the experiments for 24 hours to
temperature about 950
o
C. Then the heating of the reactor walls to working temperature was
made by plasma torch at arc power 110 kW.
Thermal Plasma Gasification of Biomass
51
The measuring system included monitoring of plasma torch operation parameters,
temperatures in several positions inside the reactor and calorimetric measurements on
cooling water loops. The temperature of inner wall of the reactor was measured in six
positions by thermocouples. The flow rate of produced syngas was determined by two
methods. Pitot flow meter was installed in the system downstream of the exit of quenching
chamber and thus the total flow rate was measured of syngas and steam produced in
quenching chamber with water spray. The flow rate was also determined from molar
concentration of argon measured at the output of the reactor before quenching chamber in
case when defined flow rate of argon was introduced into the reactor. Gas temperature was
measured at the input and the output of the quenching chamber by thermocouples. The
composition of produced gas was measured at the output of reactor before the gas enters the
quenching chamber. The tube for collection of samples was cooled down by the water spray
at the input of the quenching chamber.
Fig. 11. Schematics of experimental reactor PLASGAS.
The main gas analysis was made by a quadruple mass spectrometer Balzers QMS 200. As the
gas can contain some amount of steam which could after condensation block or damage the
inputs of the mass spectrometer, the freezing unit was connected into the gas sample circuit.
Additional analyses of the composition of the produced syngas and the content of tar were
made on samples of gas taken during the experiment by means of mass spectroscopy with
cryofocusing, gas and liquid chromatography and FT infrared spectroscopy. Samples for
tests of presence of tar in the gas were taken from the tube between the reactor and the
quenching chamber. The samples were captured on the DSC-NH2 adsorbend or silica gel
and analyzed by gas and liquid chromatography. The content of tar was below the
sensitivity of the method, which was 1 mg/Nm
3
.
Progress in Biomass and Bioenergy Production
52
4.2 Plasma generator with hybrid water/gas arc stabilization
Plasma was produced in the torch with a dc arc stabilized by combination of argon flow and
water vortex. The torch generates an oxygen-hydrogen-argon plasma jet with extremely high
plasma enthalpy and temperature. Typical arrangement of arc chamber with gas/water
stabilization is shown in Fig. 12. The cathode part of the torch is arranged similarly like in gas
torches. Gas is supplied along tungsten cathode tip, vortex component of gas flow that is
injected tangentially, assures proper stabilization of arc in the cathode nozzle. Gas plasma
flows through the nozzle to the second part of arc chamber, where arc column is surrounded
by a water vortex. The chamber is divided into several sections, where water is injected
tangentially. The inner diameter of the vortex is determined by the diameter of the holes in the
segments between the sections. The sections with tangential water injection are separated by
two exhaust gaps, where water is exhausted out of the arc chamber. Interaction of the arc
column with the water vortex causes evaporation from the inner surface of the vortex. The
steam mixes with the plasma flowing from the cathode section. An anode is created by a
rotating copper disc with internal water cooling. Thus the arc column is composed of three
sections. The cathode section is stabilized by a vortex gas flow. If gas with low enthalpy like
argon is used, the voltage drop and power of this section is small. The most important section,
which determines plasma properties, is the water-stabilized part, where the arc column
interacts with the water vortex. The third part between the exit nozzle and the anode
attachment is an arc column in a free jet formed from mixture of argon with steam.
water in
out
water
vortex
exi t
nozzle
an ode
cathode
argon
steam
cath ode
nozzle
Fig. 12. Schematics of water/argon plasma torch.
As walls of stabilizing cylinder in the main arc chamber are created by water, arc can be
operated at substantially higher power than in common gas stabilized torches. Figure 13
presents comparison of operation regimes of water stabilized torches and conventional gas
stabilized torches, characterized by levels of arc power and plasma mass flow rate. Low
mass flow rates of plasma for water torches follow from the energy balances of radial heat
transfer. For gas torches mass flow rates can be controlled independently of arc power.
However, lower limit of mass flow rate is given by a necessity to protect walls of arc
chamber by gas flow. It can be seen that water plasma torches are characterized by very low
mass flow rates. This fact results in high plasma enthalpies. Typical values of mean plasma
Thermal Plasma Gasification of Biomass
53
enthalpies for dc arc torches are shown in Fig. 13. Figure 14 presents enthalpies of steam
plasma compared with mixtures of nitrogen and argon with hydrogen, which are commonly
used in gas plasma torches. High enthalpy of steam plasma represents capacity of plasma to
carry energy. The other positive property of steam plasma for plasma processing is high
heat conductivity. Thus, extreme properties of plasma jets generated in water stabilized and
hybrid stabilized arc torches follows both from the properties of steam plasma and from the
way of stabilization of arc by water vortex.
0246
m
a
s
s
f
l
o
w
r
a
t
e
[
g
/
s
]
0
50
100
150
200
p
o
we r [k
W
]
Gas torches
Wa t er to rch es
Hybrid
torches
Mean plasma enthalpy:
Gas torches:
10 – 40 MJ/kg
Water torches:
100 – 300 MJ/kg
Fig. 13. Operation regimes of dc arc plasma torches.
The way how operation regime is established in a hybrid torch is illustrated in Fig. 13. In the
cathode gas-stabilized section the power increases with gas flow rate slowly, if low enthalpy
gas like argon is used (red part of characteristics in Fig. 13). Energy balance in the water
0 4000 8000 12000 16000 20000
temperature [K
]
0
100
200
300
400
plasma enthalpy h [MJ/kg]
steam
nitrogen/hydrogen (2:1)
argon/hydrogen (3/1)
Fig. 14. Plasma enthalpy in dependence on temperature for steam and mixtures
nitrogen/hydrogen (2:1 vol.) and argon hydrogen (3:1 vol.).
Progress in Biomass and Bioenergy Production
54
stabilized arc section is almost completely controlled by steam inflow and the arc in this
section has electrical characteristics and power balances that are very close to the ones of
water-stabilized torches. The power thus increases rapidly with mass flow rate as in the case
of water torch (blue part of characteristics in Fig. 13).
High temperature plasma jet with high flow velocity is generated in the hybrid plasma
torch. The centreline plasma flow velocity at the torch exit, which is increasing with both the
arc current and the argon flow rate, ranges approximately from 1800 m/s to 7000 m/s. The
centerline exit temperature is almost independent of argon flow rate and varies between 14
kK and 22 kK. In Fig. 15 measured profiles of plasma temperature for arc power 70 kW and
96 kW are presented. Temperature is increasing with arc current but does not depend much
on argon flow rate, because thermal plasma parameters are determined by processes in
water stabilized (Gerdien) arc part. Fig. 15 presents temperature profiles measured at
position 2 mm downstream of torch nozzle. With increasing distance from the nozzle
plasma jet temperature rapidly decreases due to mixing of plasma with ambient gas and
due to intensive radial heat transfer to the jet surrounding.
-3 -2 -1 0 1 2 3
0.8
1
1.2
1.4
1.6
1.8
2
x 10
4
r [mm]
temperature [K]
400 A, 22.5 l Ar
300 A, 22.5 l Ar
300 A, 12.5 l Ar
Fig. 15. Profiles of plasma temperature at the position 2 mm downstream of the torch exit for
argon flow rates 12.5 and 22.5 slm for arc currents 300 A (70 kW) and 400 A (96 kW).
The torch was attached to the reactor at the reactor top. Plasma enters the reactor volume
through the nozzle with diameter of 40 mm in the reactor top wall. The torch was operated
at arc currents 350 A to 550 A and arc power 96 – 155 kW, plasma mass flow rates were in
the range from 2.1 to 2.5 kg per hour.
4.3 Experimental results of plasma gasification of organic materials
Experiments with several materials at various conditions were performed with plasma
reactor PLASGAS.
Table 1 presents examples of results obtained in experiments with gasification of wooden
saw dust. The table gives values of basic operation parameters, i.e. plasma power, feed rate
of wood, flow rates of gases added to the reactor (CO
2
and O
2
) and averaged temperature T
r
in the reactor. The temperature T
r
given in the table is averaged temperature of the reactor
Thermal Plasma Gasification of Biomass
55
torch power feed rate
CO
2
O
2
T
r
syngas
H
2
CO CO2 O2 Ar CH4 calorific value
[kW] [kg/h] [slm] [slm] [K]
[m
3
/h]
%%%%%% [kW]
104 6.9 43 10 1360 7.13 27.7 60.8 5.4 0.7 4.9 0.5 21.11
104.3 6.9 20 10 1355 7.85 33.7 57.1 3.3 0.4 5.6 0.05 23.6
105.3 17 115 0 1345 30.42 31.5 59.5 4.9 0.1 2.3 1.6 92.2
106.1 17 115 30 1463 32.16 28.4 59.7 7.7 0.4 2.2 1.6 94.7
106.3 27.1 115 30 1417 34.41 22.3 68.3 2.4 4.8 1.4 0.8 105.4
152.5 27.1 115 30 1452 32.3 61.3 4.7 0.1 0.6 0.9
95 28 16 0 1150 37.6 46.3 45.2 1.9 1.6 5.1 - 111.7
138 28 16 0 1200 32.6 42 44.3 3.4 2.5 7.8 0 101.6
107.7 47.2 115 30 1406 71.04 36 59.9 2.3 0.1 0.6 1.1 225.9
107.7 47.2 115 30 1364 76.36 37.3 60.1 1.8 0.1 0.2 0.4 246.3
Table 1. Basic operation parameters, composition, flow rate and calorific value of syngas
produced by gasification of wood saw dust.
wall obtained as an average of inner wall temperatures measured at six positions in the
reactor. The right hand side of the table presents flow rate of produced syngas, its
composition and calorific value of syngas. The calorific value was calculated from measured
flow rate of gas and its composition. It can be seen that for the highest feed rates the calorific
value of produced syngas is almost 2.5 times higher then the torch power. The ratio of
power available for material treatment (after all power losses were subtracted from the arc
power) to total arc power increased with increasing arc power from 0.35 - 0.41 at arc power
95 - 100 kW to 0.41 - 0.46 for arc power higher then 130 kW for wall temperatures 1100 -
1200
o
C. The ratio was lower for higher wall temperatures. Most of the results in Table 1
were obtained at arc power 104 to 107 kW, some results for different power are also
included. No effect of arc power on gas composition and flow rate was observed for tested
feeding rates up to 47.2 kg/h. It can be concluded that maximum possible feeding rate at
given power has not been reached.
The results of other test series of experimental gasification of wooden saw dust are
presented in Table 2. The composition of produced syngas is compared with the
composition determined by equilibrium computations which are presented in Fig. 2. In all
test runs syngas with high concentrations of hydrogen and carbon monoxide was
obtained. The concentration of CO
2
and CH
4
were small especially for higher feeding rates
and higher flow rates of gases added for oxidation of surplus of carbon. The last column
of Table 2 presents heating values of syngas calculated from the composition. It can be
seen that the values of LHV and the composition are close to the results of equilibrium
calculations.
Test Parameters Added gases Syngas Composition
Feed
[kg/h]
T
r
[K]
Power
[kW]
CO
2
[slm]
O
2
[slm]
H
2
%
CO
%
CO
2
%
O
2
%
CH
4
%
Ar
%
LHV
syn.
[MJ/m
3
]
C 47 1350 115 30 42 56 0.3 0 0.4 1.0 11.72
E1 47.2 1364 108 115 30 37 60 1.8 0.1 0.4 0.2 11.76
E2 47.2 1420 108 115 30 36 59 2.9 0 1.5 0.6 11.84
E3 30 1280 110 15 0 43 44 7.2 0.1 1.3 3.3 10.81
E4 30 1360 110 15 0 42 49 4.7 0.1 1.7 2.5 11.33
Table 2. Measured (E) and computed (C) composition and LHV of syngas.
The differences between temperatures of inner wall measured at different positions within
the reactor did not exceed 100
o
C. At all experiments the minimum measured wall
Progress in Biomass and Bioenergy Production
56
temperature was 1100
o
C. Under these conditions the change of wall temperature in the
range of 1100 to 1450
o
C does not influence the flow rate and the composition of the
produced gas, as can be seen in Tables 1 and 2.
The composition of produced gas was only slightly influenced by the material feeding rate
and the power and was controlled by the ratio of mass of oxygen in supplied gases (O
2
,
CO
2
), added for complete oxidation of carbon, to the feed rate of material. This is illustrated
in Fig. 16 where molar fractions of gas components are plotted in dependence on ratio of
oxygen mass flow rate to the material feed rate.
0 0.2 0.4 0.6 0.8
ox
y
g
en mass
r
atio
0
20
40
60
80
molar concentrations [%]
CO
2
O
2
Ar
CH
4
Fig. 16. Composition of syngas in dependence on mass ratio of oxygen in gases supplied
into the reactor.
The degree of biomass gasification is characterized by the ratio of carbon content in syngas
to the total amount of carbon supplied into the reactor in fed wood and in added gases. The
ratio of carbon in gas phase to the supplied carbon is shown as carbon yield in Fig. 17. The
ratios of carbon mass in syngas to the carbon mass in wood and to the total mass of supplied
0 0.1 0.2 0.3 0.4 0.5
added oxygen mass ratio
0
0.4
0.8
1.2
carbon yield
carbon ouput to carbon input - total
carbon in CO to carbon in wood
Fig. 17. Ratio of carbon in syngas to the supplied carbon in dependence on mass fraction of
oxygen added into the reactor in O
2
and CO
2
.
Thermal Plasma Gasification of Biomass
57
carbon including supplied gas species are plotted in dependence on ratio of mass of oxygen
added into the reactor in the gas species (O
2
and CO
2
) to the mass of wood. The carbon
yield, defined on the basis of mass of wood, can be higher than 1 as carbon from supplied
gas (CO
2
) is added to syngas. It can be seen that for higher feeding rates almost all carbon
was gasified. Lower values of carbon yield for lower material feeding rates are probably
related to weak mixing of plasma with material and thus less intensive energy transfer to
the material. The mixing is more intensive at higher feeding rates due to substantially higher
amount of gas produced in the reactor volume at high feeding rates. The flow within the
reactor is almost completely controlled by material gasification, especially for higher feeding
rates, because the amount of gas produced by gasification is up to 120 Nm
3
/h while the flow
rate of plasma from the torch is 1.34 Nm
3
/h.
The energy spent for the gasification of material at different feeding rates is shown in Fig.
18 in dependence on the feeding rate. Fig. 18 also gives the values of ratio of heating value
of produced syngas (LHV), calculated from measured syngas composition and flow rate,
to the energy spent for its production, corresponding to the torch power. It can be seen
that for the highest values of the feeding rate this ratio, presented in Fig. 18 as energy
gain, was 2.3.
0 1020304050
material throughput [kg
/
h]
0
4
8
12
16
energy consumption [kWh
/
kg]
0
0.5
1
1.5
2
2.5
energy gain
energy gain
energy consumption
Fig. 18. Specific energy consumption for gasification and ratio of LHV of syngas to the torch
power in dependence on feeeding rate.
The results of analysis of tar content in produced syngas are shown in Table 3. The overall
content of tar was lower than 10 mg/Nm
3
, which was under the detection limit of used
TCD. This occurred even with toluene, and it is obvious that concentration of tar in
produced gas is really low in comparison with other gasification technologies. Especially in
the case of lower feeding rates of treated material the tar content was minimal. Low tar
content is caused mainly by the high temperatures in the reactor and the fast quenching as
well as by high level of uv radiation in the entrance of output gas tube, which was
positioned close to the input for plasma jet.
Progress in Biomass and Bioenergy Production
58
Plasma torch power [kW] 107 107 107
CO
2
flow rate [slm] 5 10 60
Humidity of treated wood [w/w] 20.2 20.2 20.2
Wood flow rate [kg/hour] 10 20 50
Benzene [mg/Nm
3
] 1,5 2,7 116,2
Toluene < 1 mg/Nm
3
Tar - SPE < 10 mg/Nm
3
Table 3. Content of benzene, toluene and tar in produced syngas.
Besides experiments with wood saw dust, gasification of several other organic materials was
tested. Tables 4 and 5 show results of test runs of following four materials: wooden saw
dust, wooden pellets 6 mm in diameter and 6 mm long, polyethylene balls of diameter 3 mm
and waste polyethylene plastics composed of 80% high-density polyethylene and 20% low-
density polyethylene. Gasification by reaction with CO
2
, O
2
and mixture of the two gases
was studied. Table 4 presents basic experimental parameters, feed rates of materials and
flow rates of added gases. Arc current was 446 to 450 A and arc power between 130 and 140
kW. Small differences in arc current and power for various runs are caused by small
fluctuations of arc voltage due to changes of temperature of water in the arc chamber.
Composition of syngas determined from the analysis by mass spectrometer is shown in
Table 5. Amount of carbon transferred into gas phase was determined from syngas flow rate
and gas composition. The gas yield of carbon represented by the ratio of amount of C in
syngas to total amount of carbon in supplied material and gases is given in Table 5.
I [A] P[kW] material [kg/h] CO2 [slm] O2 [slm]
T
r
[
o
C]
1 449 138 wood 41,1 64 1362
2 448 138 wood 41,1 125 135
5
3 449 137 wood 25,2 125 4
3
136
8
4 449 137 wood 25,2 125 1341
5 449 137 wood 25,2 86 133
7
6 450 140 pellets 30 64 1493
7450 140
p
ellets 30 248 138
3
8 450 140 pellets 60 248 1286
9 446 140 PE 5,3 2 10 80 153
9
10 4 46 140 PE 10,6 210 80 1559
11 448 131 plastics 11,2 300 1397
Table 4. Experimenal conditions and input parameters for several materials.
It can be seen that syngas with high concentrations of hydrogen and carbon monoxide was
obtained in all runs. The CO
2
concentrations were small especially for wood saw dust and
wood pelets (runs 4, 5, 7, 8), concentration of CH
4
was very low in all runs. Oxidation with
CO
2
and O
2
led to the same composition (runs 1,2). Surplus of oxygen (run 3) resulted in
increase of concentration of CO and reduction of H
2
, probably due to formation of H
2
O.
Concentration of water in syngas could not be measured by mass spectrometer due to
problems with condensation; water was removed in freezing unit. In the runs 5, 8 and 10 an
Thermal Plasma Gasification of Biomass
59
amount of supplied oxygen was close to stoichiometric values for oxidation of all carbon in
material. Complete transformation of carbon into gas phase was found for wood saw dust
and polyethylene. For wooden pellets and plastic waste the carbon yield was 0.7 – 0.8.
In all cases, like in case of wood saw dust, the content of tar and higher hydrocarbons in the
produced gas was very low and substantially less than 10 mg/Nm
3
. This is lower than the
tar content in most of non-plasma gasifiers, where the tar content for various types of
reactors varies in the range from 10 mg/Nm
3
to 100 g/Nm
3
.
material % H2 % CO % CO2 %CH4 % O2 C
out
/C
in
1wood 44,
8
39,2 15,0 0,9 0,1 1,0
2wood 41,
5
42,5 14,
9
1,0 0,1 0,9
3 wood 34,6 51,4 12,6 0 ,4 1,0 1 ,0
4wood 41,
5
54,1 3,3 0,3 0,
8
1,0
5
wood 43,
6
52,0 3,3 0,3 0,
8
1,0
6
pellets 4 8,1 40,0 11,0 0,1 0,
8
0,7
7 pellets 36,5 59,1 3,4 0,1 1,0 0,8
8
pellets 4 1,
5
52,7 4,8 0,2 0,
8
0,8
9 PE 29,9 41,3 27,1 0,0 1,7 1,0
10 PE 35,
3
41,5 21,
7
0,1 1,4 1,0
11 plastics 4 1,6 49,7 7,4 0,0 1,3 0,7
Table 5. Composition of syngas and carbon yield for conditions in Table 4.
0
50
100
150
200
250
300
350
torch power [kW] torch loss [kW]
reactor loss [kW] gasification [kW]
dissociation CO2 [kW] syngas enthalpy [kW]
s
y
n
g
as LHV
[
kW
]
Fig. 19. Power balance of gasification of wooden pellets in the run 8.
Analysis of power balance for experimental run with the highest material feed rate (run 8) is
shown in Fig. 19. Torch power, power loss in the torch, power loss to the reactor walls and
total power spent for process of gasification were determined from current and voltage
Progress in Biomass and Bioenergy Production
60
measurements and calorimetric measurements on cooling circuits of the system. Power
spent for dissociation of CO
2
was calculated from flow rate of added CO
2
, power
corresponding to low heating value of syngas was calculated from measured composition
and flow rate of syngas. Heating value of produced syngas is more than two times higher
than power of the torch.
It can be seen that in case of gasification with CO
2
most of power needed for production of
syngas was dissociation power of CO
2
. Energy needed for dissociation of CO
2
is deposited
in calorific value of produced syngas. The process thus can act as an energy storage –
electrical energy is transferred to plasma energy and then stored in produced syngas. This
can be used for storage of energy produced by new renewable sources of electrical energy
that are often characterized by large fluctuations of energy production. Moreover, the
process offers utilization and transformation of CO
2
produced by industrial technologies.
5. Conclusions
The research of plasma biomass gasification has been started as a response for a need of
more efficient utilization of biomass for energy and fuel production. Classical ways of
biomass gasification, based on partial combustion, do not produce synthesis gas with
quality demanded by advanced technologies of fuel and energy production, mostly due to
contamination of syngas by CO
2
, methane, tars and other components. The necessity of
production of clean syngas with controlled composition leads to technologies based on
external energy supply for material gasification. Plasma is medium with the highest energy
content and thus substantial lower plasma flow rates are needed to supply sufficient energy
compared with other media used for this purpose. This result in minimum contamination of
produced syngas by plasma gas and easy control of syngas composition. Especially high
enthalpy steam plasma produced in water and water-gas torches offers excellent
characteristics.
The experiments with gasification of wood, wooden pellets, polyethylene and plastic waste
were performed on the reactor with hybrid gas-water plasma torch. The composition of
produced syngas was close to the calculated equilibrium composition, determined for the
case of complete gasification. The heating value of produced syngas was in good agreement
with calculated equilibrium values. In all cases the content of tar and higher hydrocarbons
in the produced gas was very low and usually less than 10 mg/Nm
3
. This is substantially
lower than the tar content in most of non-plasma gasifiers, where the tar content for various
types of reactors varies in the range from 10 mg/Nm
3
to 100 g/Nm
3
[Hasler 1999, Jun Han
2008].
It has been experimentally verified that for small particles and higher feeding rates all
supplied material was gasified. Heating value of produced syngas was for the highest
material feed rates more than two times of power of plasma torch. In case of gasification
with carbon dioxide as oxidizing medium, most of power needed for gasification process
was power for dissociation of CO
2
. The process can be used as an energy storage – electrical
energy is transferred to plasma energy and then stored in produced syngas. This can be
utilized for storage of energy produced by sources of electrical energy with large
fluctuations of energy production. Moreover, the process offers utilization and
transformation of CO
2
generated by industrial technologies.
If energy balances of plasma gasification are compared with the conventional autothermal
reactors, where only very low power is supplied to ignite the process of partial combustion,
Thermal Plasma Gasification of Biomass
61
the energy gain in plasma systems is smaller. However, the LHV of produced syngas for
autothermal reactors is usually between 35% and 60% of its theoretical value, and moreover,
quality of produced syngas is low especially due to the production of tars and other
contaminants. Thus, plasma can offer advantages if high quality syngas with high heating
value is needed. Moreover, possibility of electrical energy storage can be utilized in
combination with new renewable power production technologies.
6. Acknowledgment
The author gratefully acknowledges the financial support of the Grant Agency of the Czech
Republic under the project No. 205/11/2070.
7. References
Bird, R.B.; Stewart, W.E., Lightfoot, E.N. 2002. Transport Phenomena. J. Willey&Sons, Inc.,
New York/Chichester/Weinheim/Brisbane/Singapore/Toronto.
Boerrigter H.; van der Drift, B. 2005. “Biosyngas“ key-intermediate for production of
renewable transportation fuels, chemicals and electricity. ECN report ECN-RX 05-
181, presented 14
th
European Biomass Conf.&Exhibition, Paris.
Boulos, M.I.; Fauchais, P., Pfender, E. 1994. Thermal Plasma Fundamentals and
Applications. Plenum Press, New York-London.
Brothier, M., et al. 2007. Syngas production from the biomass gasification by plasma torch.
Proc. of 18
th
ISPC (ed. K Tachibana et al), Kyoto, Book of Abstracts: 193, full paper
on CD.
Coufal, O. 1994. Composition of the reacting mixture SF6 and Cu in the range from 298.15 to
3000 K and 0.1 to 2 Mpa. High Temp. Chem. Processes, 3: 117-139.
Coufal O.; Sezemsky P., Zivny O. 2005. Database system of thermodynamic properties of
individual substances at high temperatures. J. Phys. D: Appl. Phys., 38: 1265-1274.
Dietenberger M. 2002. Update for combustion properties of wood components. Fire Mater.,
26: 255 – 267.
Hasler P.; Nussbauer Th. 1999. Gas cleaning for IC engine applications from fixed bed
biomass gasification. Biomass and Bioenergy, 16: 385-395.
Jun Han; Heejoon Kim 2008. Renewable and Sustainable Energy Reviews, 12: 397- 416.
Hrabovsky M.; Konrad M., Kopecky V., Hlina M. 2006. Pyrolysis of wood in arc plasma for
syngas production. J. of High Temperature Material Processes, 10: 557-570.
Kezelis R.; Mecius V., Valinciute V., Valincius V. 2004. Waste and biomass treatment
employing plasma technology. J. of High Temp. Mat. Process., 8: 273-282.
Krenek P. 2008. Thermophysical properties of H2O-Ar plasmas at temperatures 400-50000K
and pressure 0,1 MPa. Plasma Chem. Pl. Process, 28: 107-122.
Miller R.S.; Bellan J. 1997. A generalized biomass pyrolysis model based on superimposed
cellulose, hemicellulose and lignin kinetics. Comb. Sci. and Technol., 126: 97-137.
Rutberg P.G.; Bratsev A.N., Ufimtsev A.A. 2004. Plasmochemical technologies for
processing of hydrocarbonic raw material with syngas production. J. of High Temp.
Mat. Process., 8: 433-446.
Tang L.; Huang H. 2005. Plasma pyrolysis of biomass for production of syngas and carbon
adsorbent. ENERGY & FUELS, 19: 1174-1178.
Progress in Biomass and Bioenergy Production
62
Tang L.; Huang H. 2005. Biomass gasification using capacitively coupled RF plasma
technology. Fuel, 84: 2055–2063.
Tu, Wen-Kai et al. 2008. Pyrolysis of rice straw using radio-frequency plasma.
ENERGY&FUELS, 22: 24-30.
Xiu S.N.; Yi W.M., Li B.M. 2005. Flash pyrolysis of agricultural residues using a plasma
heated laminar entrained flow reactor. BIOMASS BIOENERG, 29: 135-141.
Zasypkin I.M.; Nozdrenko G.V. 2001. Production of acetylene and synthesis gas from coal
by plasma chemical methods. Thermal Plasma Torches and Technologies, Vol II., ed.
O.P. Solonenko, Cambridge Interscience Publish.: 234-243.
Zhao Z.L.; Huang H.T., Wu C.Z., Li H.B., Chen Y. 2001. Biomass pyrolysis in an
argon/hydrogen plasma reactor. Chem. Engineering & Technology, 24: 197-199.
Zhao Z.L. 2003. Plasma gasification of biomass in a downflow reactor. Abstract of Papers of
the American Chemical Society, 226: U536-U536 048-FUEL Part 1.
4
Numerical Investigation of
Hybrid-Stabilized Argon-Water
Electric Arc Used for Biomass Gasification
J. Jeništa
1
, H. Takana
2
, H. Nishiyama
2
, M. Bartlová
3
, V. Aubrecht
3
,
P. Křenek
1
, M. Hrabovský
1
, T. Kavka
1
, V. Sember
1
and A. Mašláni
1
1
Institute of Plasma Physics, AS CR, v.v.i., Thermal Plasma Department, Praha
2
Institute of Fluid Science, Tohoku University, Sendai, Miyagi,
3
Brno University of Technology, Brno
1,3
Czech Republic
2
Japan
1. Introduction
Plasma generators with arc discharge stabilization by water vortex exhibit special
performance characteristics; such as high outlet plasma velocities (up to 7 000 m⋅ s
-1
),
temperatures (~ 30 000 K), plasma enthalpy and, namely, high powder throughput,
compared to commonly used gas-stabilized (Ar, He) torches (Hrabovský et al., 1997). In a
water-stabilized arc, the stabilizing wall is formed by the inner surface of water vortex
which is created by tangential water injection under high pressure (~ 10 atm.) into the arc
chamber. Evaporation of water is induced by the absorption of a fraction of Joule power
dissipated within the conducting arc core. Further heating and ionization of the steam are
the principal processes which produce water plasma. The continuous inflow and heating
lead to an overpressure and plasma is accelerated towards the nozzle exit. The arc
properties are thus controlled by the radial energy transport from the arc core to the walls
and by the processes influencing evaporation of the liquid wall.
A combination of gas and vortex stabilization has been utilized in the so-called hybrid-
stabilized electric arc, its principle is shown in Fig.1. In the hybrid H
2
O-Ar plasma arc the
discharge chamber is divided into the short cathode part where the arc is stabilized by
tangential argon flow in the axial direction, and the longer part which is water-vortex-
stabilized. This arrangement not only provides additional stabilization of the cathode region
and protection of the cathode tip, but also offers the possibility of controlling plasma jet
characteristics in wider range than that of pure gas or liquid-stabilized torches (Březina et
al., 2001; Hrabovský et al., 2003). The arc is attached to the external water-cooled rotating
disc anode a few mm downstream of the torch orifice. The characteristics of the hybrid-
stabilized electric arc were measured and the effect of gas properties and flow rate on
plasma properties and gas-dynamic flow characteristics of the plasma jet were studied.
Experiments (Březina et al., 2001; Hrabovský et al., 2006) proved that plasma mass flow rate,
Progress in Biomass and Bioenergy Production
64
velocity and momentum flux in the jet can be controlled by changing mass flow rate in the
gas-stabilized section, whereas thermal characteristics are determined by processes in the
water-stabilized section. The domain for numerical calculation is shown in Fig. 1 by a
dashed line and includes the discharge area between the outlet nozzle for argon and the
near-outlet region of the hybrid plasma torch.
Fig. 1. Principle of hybrid plasma torch WSP
®
H with combined gas (Ar) and vortex
(water) stabilizations. Water is injected tangentially and creates vortex in the chamber.
The arc burns between the cathode, made of a small piece of zirconium pressed into a
copper rod, and the water-cooled anode rotating disc. The calculation domain is shown by
a dashed line.
The hybrid arc has been used at IPP AS CR, v.v.i., in the plasma spraying torch WSP
®
H (160
kW) for spraying metallic or ceramic powders injected into the plasma jet (Fig. 2). Recently,
an experimental plasmachemical reactor PLASGAS (Fig. 3) equipped with the spraying
torch WSP
®
H has been started for the innovative and environmentally friendly plasma
treatment of waste streams with a view to their sustainable energetic and chemical
valorization and to a reduction of the emission of greenhouse gases (Van Oost et al., 2006,
2008). Pyrolysis of biomass was experimentally studied in the reactor using crushed wood
and sunflower seeds as model substances. Syngas with a high content of hydrogen and CO
was produced.
This work aims to study properties and processes in the hybrid arc for high currents (300-
600 A) and argon mass flow rates (22.5-40 standard liters per minute, slm). In contrast to our
previous investigation (Jeništa, 2004; Jeništa et al., 2007), a special attention is devoted to the
flow structure and temperature field in the discharge when the local Mach number is higher
than one. Our former results indicated the possibility (Jeništa, 2004) and also proved the
existence (Jeništa et al., 2008) of supersonic flow regime for currents higher or equal to 500
A. In addition, a detailed comparison of the calculated results with experiments is presented
in this study.
Numerical Investigation of
Hybrid-Stabilized Argon-Water Electric Arc Used for Biomass Gasification
65
Section 2 gives information about the model assumptions, plasma properties, boundary conditions
and the numerical scheme. Section 3 reveals the most important findings such as thermal and
fluid dynamic characteristics of plasma within the discharge and in the near-outlet regions,
along with power losses from the arc and comparison of calculated results (temperature and
velocity profiles near the nozzle exit) with experiments.
Fig. 2. The plasma spraying torch WSP
®
H with hybrid stabilization (left), i.e. the combined
stabilization of arc by axial gas flow (Ar or N
2
) and water vortex. The external rotating disk
anode is made of copper. Images of plasma jets produced by WSP
®
H (right) from the
mixture of steam and argon for different operational conditions: 300 A and 24 slm of argon
(top), spraying of Cu particles at 500 A and 36 slm of argon (middle), supersonic jet at 300 A,
12 slm of argon at 10 kPa of surrounding atmosphere (bottom).
2. Physical model and numerical implementation
2.1 Assumptions and the set of equations
The following assumptions for the model are applied:
1. the numerical model is two-dimensional with the discharge axis as the axis of
symmetry,
2. plasma flow is laminar/turbulent and compressible in the state of local thermodynamic
equilibrium,
3. argon and water create a uniform mixture in the arc chamber,
4. only self-generated magnetic field by the arc itself is considered,
5. gravity effects are negligible,
6. the partial characteristics and the net emission coefficients methods (models) for
radiation losses from the arc are employed,
7. all the transport, thermodynamic and radiation properties are dependent on
temperature, pressure and argon molar content.
Progress in Biomass and Bioenergy Production
66
Fig. 3. Schematic diagram of the experimental reactor for plasma pyrolysis and gasification.
A few comments should be mentioned on these assumptions:
1. The cylindrical discharge chamber (Fig. 1) is divided into several sections by the baffles
with central holes. Water is injected tangentially into the chamber by three sets of three
inlet holes (totally 9 holes) placed equidistantly along the circumference at angles of
120°. The inner diameter of the water vortex is determined by the diameter of the holes
in the baffles. Water is usually pumped under pressures of 0.39 MPa (0.6 MPa) with
flow rates of 10 l min
-1
(16 l min
-1
). Higher pressures insure better hydrodynamic
stability of the arc. Since water flows in a closed circuit, it is also exhausted at two
positions along the arc chamber.
In order to see the flow structure near the outlet, we included in our calculation domain
also the near-outlet region which extends up to 20 mm from the nozzle exit. In
experiment, the distance from the nozzle exit to the anode can be changed from 5 to 20
mm. It can be expected that regions close to the nozzle exit will remain undisturbed by
the presence of the anode, while the more distant regions (15-20 mm) will be influenced
by 3D effects (the anode jet and anode processes), provided the anode is placed
somewhere 20 mm from the nozzle exit.
It comes out from these considerations that the two-dimensional assumption is valid in
major part of the domain due to a) cylindrical symmetry of the discharge chamber
setup, b) tangential injection of water through the holes along the circumference, and c)
the flexible distance between the nozzle exit and anode.
Numerical Investigation of
Hybrid-Stabilized Argon-Water Electric Arc Used for Biomass Gasification
67
2. The assumption of laminar flow is based on experiments, showing the laminar structure
of the plasma flowing out of the discharge chamber in the space between the nozzle exit
and the anode. The laminar flow has been observed for currents up to 600 A. It comes
out from our previous calculation that Reynolds number based on the outlet diameter 6
mm reaches in the axial region 13 000 at maximum and decreases to 300 in arc fringes.
The type of flow inside the discharge chamber is questionable since no diagnostics is
able to see inside the chamber and it is not clear if the laminar plasma stream is a result
of laminarization of the plasma flow at the outlet. To check possible deviations from the
laminar model, we have employed Large Eddy Simulation (LES) with the Smagorinsky
sub-grid scale model. It was proved that simulations for laminar and turbulent regimes
give nearly the same results, so that the plasma flow can be considered more or less
laminar for the operating conditions and simplified discharge geometry in the present
study. The maximum detected discrepancy between the turbulent and laminar models
is 7 % for the relative temperature difference at the arc axis 2 mm downstream of the
nozzle exit for 500 A and 40 slm of argon. For reasons of generality, all the results
presented here were calculated using the LES turbulent model.
3. The assumption of a complete (uniform) mixing is a simplification of a reality since,
based on experiments, argon and water species do not mix homogeneously in the
hybrid torch, especially at lower currents. This assumption was discusssed in more
detail in (Jeništa, 2004) and it was concluded that this assumption can underestimate
temperature and velocity in the axial discharge region to some extent.
The complete set of conservation equations representing the mass, electric charge, momentum
and energy transport of such plasma can be written in the vector notation as follows:
continuity equation:
() ()
1
0vr u
trr z
ρ
ρρ
∂∂ ∂
++=
∂∂ ∂
(1)
momentum equations:
() () () ()
21
3
1
2
r
pu
uuvuu jB rv
tr z z zrrz
uuv
r
zzrr rz
ρρ ρ μ
μμ
θ
∂∂ ∂ ∂ ∂
∂∂
++=−+− ++
∂∂ ∂ ∂ ∂∂∂
∂∂∂
∂∂
++
∂∂ ∂ ∂∂
(2)
() () () ()
2
2
21
3
12
2
x
pu
w
vvvuv jB rv
tr z r rrrzr
vuv
v
r
rr r z r z
r
ρ
ρρ ρ μ
μ
μμ
θ
∂∂ ∂ ∂ ∂
∂∂
++=−−− +++
∂∂ ∂ ∂ ∂∂∂
∂∂∂
∂∂
−+ +
∂∂ ∂∂∂
(3)
energy equation:
() ()
()()
1
1
rr rz rz zz r r z z
eTT
repv epu
trr r z z
rv u v ujEjER
rr z
λλ
ττ ττ
∂∂ ∂ ∂ ∂
++−++−=
∂∂ ∂ ∂ ∂
∂∂
++ +++−
∂∂
(4)
Progress in Biomass and Bioenergy Production
68
charge continuity equation:
1
0r
rr r z z
σσ
∂∂Φ∂∂Φ
+=
∂∂∂∂
(5)
equation of state:
g
p
RT
ρ
= . (6)
Here
z and r are the axial and radial coordinates, u , v and w are the axial, radial and
tangential components of the velocity respectively,
ρ
is the mass density,
μ
is the viscosity
(in the case of LES model, the turbulent contribution
turb
μ
is also added)
p
is the pressure,
B
Θ
is the magnetic field strength, e is the density of energy produced or dissipated in the
unit volume (internal and kinetic),
T is the temperature,
τ
is the viscous stress tensor,
z
j
and
r
j are the axial and radial components of the current density,
z
E and
r
E are the axial
and radial components of the electric field strength,
Φ
is the electric potential, R is the
source term for the radiation losses and
g
R
is the molar gas constant. The magnetic field
strength
B
Θ
is calculated from the Biot-Savart law, the current density
j
from the Ohm’s
law
j
E
σ
=⋅
.
2.2 Properties of argon-water plasma mixture
The water–argon mixture can be described by the formula
()
2
1
()
q
q
HO Ar
−
where the argon
molar amounts q were chosen from 0 to 1 with the step of 0.1. The total number of 35
chemical species was considered (Křenek, 2008). For the temperature range 400 – 20 000
K we supposed the following decomposition products:
e (electrons), H , O , Ar ,
O
+
,
2
O
+
,
3
O
+
,
O
−
,
2
O ,
2
O
+
,
2
O
−
,
3
O , H
+
, H
−
,
2
H ,
2
H
+
,
3
H
+
, OH ,
OH
+
,
OH
−
,
2
HO ,
2
HO
−
,
2
HO,
2
HO
+
,
3
HO
+
,
22
HO ,
A
r
+
,
2
A
r
+
,
3
A
r
+
. For the temperature range 20 – 50 000 K the set of
products is somewhat different, including also multiply charged ions:
e (electrons), H , O ,
Ar ,
O
+
,
2
O
+
,
3
O
+
,
4
O
+
,
5
O
+
,
6
O
+
, H
+
,
A
r
+
,
2
A
r
+
,
3
A
r
+
,
4
A
r
+
,
5
A
r
+
,
6
A
r
+
. The
calculations were performed using the modified Newton method for the solution of
nonlinear equations system which is composed of equations of Saha and mass action law
type expressing individual complex components by the help of basic ones (
,,,eHOAr). The
system is completed by the usual particle and charge balance assuming quasineutrality and
equilibrium.
The thermodynamic properties and the transport coefficients of this gas mixture were
calculated according to the Chapman–Enskog method in the 4th approximation described
e.g. in (Křenek & Něnička, 1984) for temperatures 400–50 000 K (Křenek, 2008) and pressures
0.1-0.3 MPa in the local thermodynamic equilibrium.
Two radiation models are implemented in the energy equation for energy losses from the
argon-water plasma: 1) the net emission coefficients for the required arc radius of 3.3 mm,
and 2) the partial characteristics method, both of them for different molar fractions of argon
and water plasma species in dependence on temperature and pressure. Continuous
radiation due to photorecombination and “bremsstrahlung” processes has been included in
the calculation as well as discrete radiation consisting of thousands of spectral lines.
Broadening mechanisms of atomic and ionic spectral lines due to Doppler, resonance and
Stark effects have been considered. The numbers of oxygen and argon lines included in the
Numerical Investigation of
Hybrid-Stabilized Argon-Water Electric Arc Used for Biomass Gasification
69
calculation are O (93 lines), O
+
(296),
2
O
+
(190), Ar (739), Ar
+
(2781),
2
Ar
+
(403),
3
Ar
+
(73). In addition, molecular bands of
2
O (Schuman-Runge system),
2
H (Lyman and Verner
systems), OH (transition
22
i
AX
+
Σ→ Π) and
2
HO (several transitions) have been also
implemented (Bartlová & Aubrecht, 2006). Absorption coefficient as a function of
wavelength has been calculated from infrared to far ultraviolet regions and the tables of
partial characteristics for 1 000 – 35 000 K. The net emission coefficients model used here is a
special case of the partial characteristics model with zero partial sink, 0Sim
Δ=.
2.3 Boundary conditions and numerical scheme
The calculation region and the corresponding boundary conditions are presented in Fig. 4.
The dimensions are 3.3 mm for the radius of the discharge region, 20 mm for the radius of
the outlet region and 78.32 mm for the total length. These dimensions agree with the hybrid
torch experimental setup.
a.
Inlet boundary (AB) is represented by the nozzle exit for argon. Along this boundary we
assume the zero radial velocity component, 0v
= . Because of the lack of experimental
data, the temperature profile
()
,0Trz= and the electric field strength
.
z
Ezconst=−∂Φ ∂ =
for a given current are calculated at this boundary, before the start
of the fluid-dynamic calculation itself, iteratively from the Elenbaas-Heller equation
including the radiation losses from the arc (our previous numerical experiments proved
a weak dependence of the form of the boundary temperature profile on the overall
solution). The inlet velocity profile
()
ur for argon plasma for the obtained temperature
profile
()
,0Trz= is pre-calculated from the axial momentum equation under the
assumption of fully developed flow.
b.
Axis of symmetry (BC). The zero radial velocity and symmetry conditions for the
temperature, axial velocity and electric potential are specified here, i.e.
0Tr ur r∂ ∂=∂ ∂=∂Φ∂=
, 0v = .
c.
Arc gas outlet plane (CD). The zero electric potential 0Φ= (the reference value) and zero
axial derivatives of the temperature and radial velocity are defined at CD,
0Tz vz∂∂=∂∂=
. Values of the axial velocity are interpolated from the inner grid
points.
d.
Arc gas outlet plane (DE). The zero radial velocity and zero radial derivatives of the
temperature, axial velocity and electric potential are defined here,
0Tr ur r∂ ∂=∂ ∂=∂Φ∂=
, 0v = . Pressure is fixed at 1 atmosphere, p = 1 atm.
e.
Outlet wall and the nozzle (EF). We specify no slip conditions for velocities, 0uv==,
constant values of
r
E
and
z
E
(
0zr∂Φ ∂ = ∂Φ ∂ =
) and
()
, 773Trz K= (500° C ) for the
temperature of the nozzle.
f.
Water vapor boundary (FA). Along this line we specify the so-called “effective water
vapor boundary”, named in Fig. 4 as the “water vapor boundary” with a prescribed
temperature of water vapor
()
3.3 ,TR mmz==773 K. This is a numerical
simplification of a more complex physical reality assumed near the phase transition
water-vapor in the discharge chamber. The shape of the phase transition between
water and vapor in the discharge chamber is not experimentally known and it is
unclear so far if the structure of the transition is simple or very complicated, for
example, with a time-dependent form. Various irregularities in the transition such as
Progress in Biomass and Bioenergy Production
70
splitting of the phase transition or water drops in the vapor phase can increase
complexity of the transition. In (Jeništa, 2003a) the iteration procedure for
determination of the mass flow rate and the radius of the “water vapor boundary” for
each current was proposed, based on comparison with available experimental
temperature and velocity at the outlet and the electric potential drop in the chamber.
It was concluded that the best fit between experiment and numerical simulation for
all currents exists for a mean arc radius of 3.3 mm. The corresponding values of water
mass flow rates are 0.228 g s
-1
(300 A), 0.286 g s
-1
(350 A), 0.315 g s
-1
(400 A), 0.329 g s
-1
(500 A), 0.363 g s
-1
(600 A). The magnitude of the radial inflow velocity is calculated
from the definition of mass flow rate
()
()
2,
z
m
vR
RRzz
πρ
Δ
=
Δ
,
where
()
,Rzρ is a function of pressure and thus dependent on the axial position z ,
zΔ is the distance between the neighboring grid points.
Because of practically zero current density in cold vapor region (no current goes outside
of the lateral domain edges), the radial component of the electric field strength is put zero,
i.e.,
0
r
E = . The axial velocity component is set to zero, 0u = . Since we do not solve here
the equation for tangential velocity component
w , distribution of w in the discharge for
the presented results was taken from our previous calculations (Jeništa et al., 1999a)
solved by the SIMPLER iteration procedure (Patankar, 1980) which enables calculation of
w for axisymmetric case, i.e., w as a function of z and r coordinates. The w velocity
acts here only through the centrifugal force
2
wrρ in the radial momentum equation (3).
Fig. 4. Discharge area geometry. Inlet boundary (AB) is represented by the nozzle exit for
argon. The length of the discharge region is 58.32 mm, the length of the outlet is 20 mm.
Along the line FE we specify the outlet nozzle and the wall of the hybrid plasma torch
equipment.
Numerical Investigation of
Hybrid-Stabilized Argon-Water Electric Arc Used for Biomass Gasification
71
For time integration of (1)-(4), LU-SGS (Lower-Upper Symmetric Gauss-Seidel) algorithm
(Jameson & Yoon, 1987; Yoon & Jameson, 1988), coupled with Newtonian iteration method
are used for the integration of discretized equations in time and space. To resolve
compressible phenomena accurately, the Roe flux differential method (Roe, 1981) coupled
with the third-order MUSCL-type (Monotone Upstream-centered Schemes for Conservation
Laws) TVD (Total Variation Diminishing) scheme (van Leer, 1979) are used for convective
term. The electric potential from (5) is solved in a separate subroutine by the TDMA (Tri-
Diagonal Matrix Algorithm) line-by-line method. From (1-4) we obtain
ρ
, u
ρ
, e and Φ .
Pressure is determined from the pressure dependence of the internal energy
()()
2
,,0.5U
p
Te
p
Tu=−ρ
and temperature is calculated from the equation of state (6)
()
,
g
p
RpTT
ρ
=⋅
, using the pre-calculated values of the product
()
,
g
RpTT⋅
as a function
of temperature, pressure and argon molar fraction in the mixture (Křenek, 2008).
The computer program is written in the FORTRAN language. The task has been solved on
an oblique structured grid with nonequidistant spacing. The total number of grid points was
38 553, with 543 and 71 points in the axial and radial directions respectively.
3. Results of calculation
3.1 Thermal, fluid flow and electrical characteristics of the plasma
Calculations have been carried out for the currents 300, 400, 500 and 600 A. Mass flow rate
for water-stabilized section of the discharge was taken for each current between 300 and 600
A from our previously published work (Jeništa, 2003a; Jeništa, 2003b), where it was
determined iteratively as a minimum difference between numerical and experimental outlet
quantities. The resulting values are 0.228 g
⋅ s
-1
(300 A), 0.315 g⋅ s
-1
(400 A), 0.329 g⋅ s
-1
(500
A), 0.363 g
⋅ s
-1
(600 A). Argon mass flow rate was varied in agreement with experiments in
the interval from 22.5 slm to 40 slm, namely 22.5, 27.5, 32.5 and 40 slm. It was proved in
experiments (Kavka et al., 2007) that part of argon is taken away before it reaches the torch
exit because argon is mixed with vapor steam and removed to the water system of the torch.
The amount of argon transferred in such a way from the discharge is at least 50 % for
currents studied. Since the present model does not treat argon and water as separate gases
and the mechanism of argon removal is not included in the model, we consider in the
calculations that argon mass flow rate present in the discharge equals one-half of argon
mass flow rate at the torch inlet. A relatively high values of argon mass flow rate, used also
in experiment, were chosen here to demonstrate compressible phenomena.
Fig. 5 shows velocity, temperature, pressure and the Mach number in the outlet nozzle and
near-outlet regions for 600 A, water mass flow rate of 0.363 g s
-1
and 40 slm of argon. The
partial characteristics method for radiation losses is employed. The results shown here
demonstrate the largest magnitude fluctuations of velocity, temperature, pressure and the
Mach number just after the jet exhausts from the torch nozzle among all the studied currents
and argon mass flow rates. Supersonic flow structure in the near-outlet region is obvious
with clearly distinguished shock diamonds with the maximum Mach number about 1.6 with
10 500 m s
-1
. The corresponding velocity and the Mach number maxima overlap with the
temperature and pressure minima and vice versa. Since the pressure decreases at the torch
exit to a nearly atmospheric pressure, the computed contours correspond to an under-
expanded atmospheric-pressure plasma jet.
Progress in Biomass and Bioenergy Production
72
The corresponding axial profiles of the Mach number, pressure, temperature and velocity
along the arc axis downstream from the nozzle orifice (the axial position 58.32 mm) for the
same run are presented in Fig. 6. Several successive wave crests and troughs along the axis
for each of the physical parameters is a typical feature of supersonic fluid flow. The
fluctuation of presented quantities is between 1.1-1.7 for the Mach number, 0.7-1.4 atm. for
the pressure, 7 200-10 000 m
⋅ s
-1
for the velocity and 18 000-23 500 K for the temperature.
Fig. 5. Velocity, temperature, pressure and the Mach number contours in the outlet nozzle
and near-discharge regions for the 600 A arc discharge. Water mass flow rate is 0.363 g s
-1
,
argon mass flow rate is 40 slm (standard liters per minute). Partial characteristics
radiation model is employed. Supersonic flow structure is obvious with clearly
distinguished shock diamonds. The maximum Mach number reaches 1.6. Contour
increments are 500 m s
-1
for velocity, 1 000 K for temperature, 0.1 atm for pressure and 0.1
for the Mach number.
Fig. 6. Profiles of the Mach number, pressure, temperature and velocity along the arc axis
from the nozzle orifice. Supersonic outlet with distinguished shock diamonds. 600 A, argon
mass flow rate 40 slm, partial characteristics radiation model.
Numerical Investigation of
Hybrid-Stabilized Argon-Water Electric Arc Used for Biomass Gasification
73
Fig. 7 displays temperature and velocity fields in the discharge and the near-outlet regions
for a) 500 and b) 600 A with water mass flow rates of 0.329 g
⋅ s
-1
(500 A), 0.363 g⋅ s
-1
(600 A)
(Jeništa, 2003a) and argon mass flow rate of 0.554 g
⋅ s
-1
(one half of 40 slm). The net emission
coefficients radiation model is employed. Orientation of the calculation domain is the same
as in Figs. 1, 4. Since the ratio of the axial to the radial dimensions of the calcualtion domain
is ~ 24 the scaling of the radial and axial coordinates is not proportional to make the
contours inside the discharge region clearly visible. Argon flows axially into the domain,
whereas water evaporates in the radial direction from the “water vapor boundary”. Both the
results for 500 and 600 A exhibit supersonic under-expanded plasma flow regime but a
progression from weak to highly-pronounced shock diamonds structure at 600 A is obvious.
The maximum velocities are 7 200 m
⋅ s
-1
(500 A) and 9 400 m ⋅ s
-1
(600 A) near the axial
position of 60 mm. Further downstream the velocity amplitudes decrease due to viscosity
dissipation and due to the reduction of the difference between the jet static pressure and
back pressure.
Fig. 7. Temperature and velocity contours for a) 500 A and b) 600 A arcs, net emission
coefficients model. Water mass flow rates are 0.329 g
⋅ s
-1
(500 A) and 0.363 g⋅ s
-1
(600 A);
argon mass flow rate is 40 slm for both currents. Progression of a supersonic flow structure
at the outlet is clearly visible. Contour increments are 1 000 K for temperature and 500 m
⋅ s
-1
for velocity.