Progress in Biomass and Bioenergy Production Part 13 ppt
Bạn đang xem bản rút gọn của tài liệu. Xem và tải ngay bản đầy đủ của tài liệu tại đây (956.14 KB, 30 trang )
Activated Carbon from Waste Biomass
349
Binder:
Pyrolysis oil
Char/Binder
ratio
Pressing
temperature
Pressure [bar] Force [N]
Coconut press
residue
1.5 / 1
cold
250 33.7
350 73.6
200 °C 200 38.7
Wheat straw 1.5 / 1 200 °C 200 205
Table 7. Break strength of pellets made from olive stone char. Bold: best combinations.
The stability of the pellets was not only influenced by the type of binder but as well by the
type of biomass. Pellets from olive stone chars were very hard to form, due to the melting
effects after pressing. Stable pellets could only be attained by the use of wheat straw tar as
binder.
4. Rotary kiln reactor for char activation
The advantage of the lab-scale pyrolysis and activation facilities is the easy way of handling
and the short heat-up times. Many experiments can be made in a short time interval.
Unfortunately the possibility of treating larger amounts of biomass is not given. Likewise
these facilities do not serve for an up-scale to an industrial production process neither for
biomass pyrolysis nor for char activation. For this a new concept of an activated carbon
production process had to be worked out.
For the pyrolysis step an already existing screw driven rotary kiln reactor (Hornung et al.
2005; Hornung & Seifert, 2006) was used to transfer the lab-scale experiments into a
continuous production process. Unfortunately the pyrolysis temperature was limited to
500°C within this reactor. Tests were run with wheat straw pellets, olive stones, coconut
press residues, rape seeds and spent grain. The chars were activated in the lab-scale facility.
No influence of the chars from lab-scale experiments and rotary kiln pyrolysis was found
after the activation step. The surface area of the chars from rotary kiln pyrolysis was similar
to the area of the chars from lab-scale pyrolysis. The mass loss during activation was higher
when the rotary kiln chars were used due to the lower pyrolysis temperature of 450°C–
500°C. The lab-scale pyrolysis was run at 600°C. For this at lot of volatiles were left in the
rotary kiln chars. Nevertheless, this type of reactor serves for the pyrolysis of biomass
matters with respect of activated carbon production due to the latter heating of the chars to
higher temperatures during activation.
The charcoal activation still needed a new upscale concept but some requirements had to be
confirmed. First the production process had to be a continuous process with automatically
operating feed and discharge systems. Second the char pellets had to be mixed with the
steam quite well to ensure that partial char oxidation takes place over the entire particle´s
surface. Third the stirring of the particles had to be made softly because the char pellets
were not stable enough to withstand high mechanical forces. Forth the residence time of the
char inside of the reactor should be well controlled as well as the steam flux. Fifth the
reactor should operate at 1000 °C and the possibility of changing the heat system from
electrical heating to the use of gas burners should be taken into account.
Progress in Biomass and Bioenergy Production
350
As a result of these requirements the use of a further rotary kiln reactor seemed to be the
most appropriate method for the scale-up of the activation process. To control the
residence time of the char in the rotary kiln, it should be equipped with a rotating screw.
The temperature control of the char is realized by the installation of five thermocouples
along the screw axis. Although the principles of the rotary kiln pyrolysis reactor
(Hornung et al. 2005; Hornung & Seifert, 2006) was used for the activation step, a total
redesign of this reactor type was necessary in order to run the experiments at higher
temperatures.
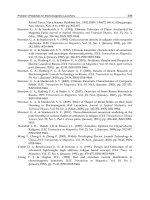
A sketch of the new, high temperature rotary kiln is shown in Fig. 24. It consists of a tube
which is 2 meters long and the outer diameter amounts to 110 mm. The wall thickness is 6
mm. Inside of this tube a screw is located. Both parts consist of heat resistant steel. The tube
and the screw can be turned independently from each other. The rotation of the tube insures
the particle mixing whereas the rotation of the screw controls the char residence time. The
tube is heated electrically by an oven over a length of one meter but it can be changed to gas
burner heating if necessary. The axis of the screw is equipped with an electric heater and in
the small gap between heater and wall of the screw axis the steam is flowing. Holes in the
screw axis assure that the steam enters the reactor room. The steam itself is generated
separately by a steam generator. In addition five thermocouples are fixed to the screw to
allow for the char temperature control. The rotation speed of the screw is measured and
controlled as well as the rotation speed of the tube. Both, the screw and the tube are driven
by electric motors. Two valves, one at the feed system and one at the outlet prevent the air
from entering the reactor. At the outlet steam, condensed water and the activated char is
separated. The activated carbon is cooled to room temperature after leaving the reactor. The
heat-up of the rotary kiln to 950°C needs about 3 hours and has to be run carefully due to
the thermal expansion of the metal components. The reactor was designed for a char
throughput of ~ 1 kg/hour. The valve on the right hand side of the reactor enables the char
input. The steam flows through the screw axis and enters the reactor from the right. The
steam and the exhaust gases leave the reactor via a small valve which is located close to the
activated carbon outlet on the left hand side.
Fig. 24. Sketch of the high temperature rotary kiln reactor for char activation. The
operation temperature is 950°C with steam flow and the char throughput amounts to
max. 1 kg/h.
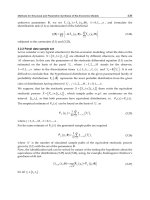
Fig. 25 gives an impression of the build-up of the activation rotary kiln reactor.
Activated Carbon from Waste Biomass
351
Fig. 25. Photograph of the high temperature rotary kiln reactor for char activation.
To proof whether this reactor is useful for char coal activation batch wise tests were run
with char from wheat straw pellets and beech wood cubes. For this 80-100 g of char were
inserted into the 950°C hot reactor. The residence time was varied between 40 min and 90
min and the steam flow was adapted to the lab-scale experiments and amounted to 1,7 – 2
m
3
/h. After collecting the activated carbon at the reactor outlet, the mass balance was
established and the surface area measured. These results were compared with the lab-scale
activation results and are given in Fig. 26 and 27. As shown from Fig. 26 and 27 the same or
even higher surface areas could be attained with the rotary kiln activation. Only little mass
got lost in the reactor as a result of particle destruction. Most of the particles left the reactor
in the same shape as they got in but shrinkage due to the chemical reactions could be
detected. As expected the particles were not pulverized due to the smooth transport and
rotation.
The results are promising and this concept seems to have a good perspective for the
activation of the biomass char. This principle allows for the scale-up of the activation step
into a continuous production process. For the up-scale of the rotary kiln to a technical plant
much attention has to be paid on the heat impact. Inner and outer heating ensures that the
steam flux and the char reach the operating temperature.
Fig. 26. Comparison of lab-scale and pilot-scale activation in the case of wheat straw pellets.
The half-filled pentagons are the pilot scale results of the rotary kiln.
rotar
y
kiln
Progress in Biomass and Bioenergy Production
352
Fig. 27. Comparison of lab-scale and pilot-scale activation in the case of beech wood cubes.
Experiment 1: 600 g char input Experiment 2: 600 g char input
gas
component
[vol%]
(1)
[wt%]
(1)
[vol%]
(2)
[wt%]
(2)
[vol%]
(3)
[wt%]
(3)
[vol%]
(4)
[wt%]
(4)
H
2
52,78 6,87 56,14 7,49 55,56 7,36 58,62 8,07
O
2
0,31 0,65 0,20 0,43 0,01 0,03 0,26 0,58
N
2
1,45 2,62 0,97 1,80 0,05 0,10 1,12 2,13
CO 19,52 35,29 23,27 43,12 23,12 42,52 22,46 42,94
CH
4
10,33 10,70 4,95 5,25 5,97 6,29 3,31 3,63
CO
2
15,18 43,12 14,26 41,52 14,82 42,84 14,18 42,57
C
2
H
2
0,01 0,01 0,00 0,00 0,01 0,02 0,00 0,00
C
2
H
4
0,41 0,75 0,21 0,38 0,46 0,84 0,05 0,09
H
u
[MJ/kg] 17,5 16,15 16,67 15,87
H
o
[MJ/kg] 19,6 18,08 18,85 17,83
BET [m
2
/g] 516 482 474 519
Table 8. Composition of water free gas atmosphere during steam activation of 600 g
wheat straw pellet pyrolysis char. The values are based on the volume resp. mass of water
free gas samples. The numbers indicate sampling after 25 min (1), 30 min (2), 37 min (3),
46 min (4).
To proof whether the exhaust gases which were produced during activation of the char in
the rotary kiln reactor have the potential of being used energetically, the composition of the
gas and steam atmosphere was analyzed by gas chromatography, (Agilent 6890A Plus,
packed column CarboxenTM 1000 from Supelco with helium flow of 20 mL/min).
This method required a water free gas sample. For this, the exhaust gas flow was cooled to
(-50) °C in several cooling units. An additional filter unit allowed for a water free gasflow.
Activated Carbon from Waste Biomass
353
At the outlet of the cooling section, gas samples were collected at different instants of time.
The experiments were run with 600 g of wheat straw pellets and a steam flow of 1,7 – 2
m
3
/h. Prior to activation the wheat straw pellets were pyrolysed at 600 °C in the pyrolysis
rotary kiln reactor for 20 min. The composition of the water free exhaust gas is documented
in (Barth, 2009) and given in Table 8. The experiments were run batch-wise. The reason for it
was the better control of the process due to the fact, that the in- and outlet valves did not
operate automatically at this instant of time. As shown in Table 8 the calorific value is
mainly determined by the gas contents of H
2
, CO and by small amounts of CH
4
. This gas
composition corresponds to a typical synthesis gas which is produced during gasification of
hydrocarbons and carbon matters. Behind the cooling unit, the gas flow was measured and
amounted to 0.8 m
3
/h. Compared to the steam flow of around 2 m
3
/h the dilution of the
exhaust gas was quite high. Therefore the steam flow should be reduced and its influence on
activated carbon quality should be investigated.
5. Conclusion
The generation of activated carbon in a two step process of pyrolysis and steam activation
from different waste biomass matters was investigated in both, lab-scale and pilot-scale
facilities. The lab-scale experiments provided a database for the production parameters of best
quality carbons with high surface areas. The surface measurements were determined by BET
method. Activated carbons with high BET surface area can be generated with any kind of nut
shells, like pistachio, walnut or coconut. The BET surface amounts to more than 1000 m
2
/g.
Intermediate values of 800 – 1000 m
2
/g can be accomplished with beech wood, olive stones,
spent grain, sunflower shells, coffee waste and oak fruits. Straw matters and rape seeds do not
serve well for activated carbon production due to their low BET surface of 400–800 m
2
/g.
Especially rice straw leads to low surface values unless it is not treated with alkaline solvents
prior to pyrolysis. The activated carbons are mainly dominated by micro- and mesopores of
40–60 Å. Macropores are as well present in rice straw and pistachio shell carbons.
The composition of the exhaust gases which occur during char activation is determined
mainly by H
2,
CO, Methane and CO
2
. This corresponds to a typical synthesis gas, which
occurs during gasification of carbon matters. Due to the high amount of combustible
components (50-80 vol%) the dry exhaust gas may serve for energy recovery of the activated
carbon production process.
Investigations were made to prove whether pyrolysis tars can be used as binder material for
granulated activated carbon production. The pelletizing conditions were worked out and
the influence of the binder on the quality and stability of the pellets was tested as well as the
influence of char mixing. Heating and pressing of the char/binder mixtures led to stable
pellets by the use of pyrolysis oils of coconut press residues, wheat straw and coffee
grounds. Mixing of different kinds of chars resulted in intermediate BET surface areas.
Finally a concept for a continuous production process was given. For this a new high
temperature rotary kiln reactor was designed which can be heated to 1000 °C. An inner
screw allows for a smooth transport of the pelletized material. The char residence time was
controlled by the rotation speed of the screw. The experiments showed, that the activated
carbons which were produced in the rotary kiln were of same quality than the carbons from
the lab-scale facility with respect to surface area. It demonstrates that this type of reactor is
suitable for a continuous activated carbon production process.
Progress in Biomass and Bioenergy Production
354
6. Acknowledgment
We acknowledge support by Deutsche Forschungsgemeinschaft and Open Access
Publishing Fund of Karlsruhe Institute of Technology.
7. References
Ahmedna, M., Marshall, W.E. & Rao, R.M. (2000). Production of granular activated
carbons from select agricultural by-products and evaluation of their physical,
chemical and adsorption properties. Bioresource Technology, Vol.71, (2000), pp.
113–123
Aygün, A., Yenisoy-Karakas, S. & Duman, I. (2003). Production of granular activated carbon
from fruit stones and nutshells and evaluation of their physical, chemical, and
adsorption properties. Microporous and Mesoporous Materials, Vol.66, (2003), pp. 189–
195.
Barth, N.K. (2009). Herstellung von Aktivkohle aus biogenen Materialien, Projektarbeit
Forschungszentrum Karlsruhe/Duale Hochschule Baden-Württemberg, 2009
Daifullah, A. A. M. & Girgis B. S. (2003). Impact of surface characteristics of activated carbon
on adsorption of BTEX. Colloids and Surfaces A.: Physiochem. Eng. Aspects, Vol.214,
(2003), pp. 181-193
Di Blasi, C., Branca, C. & D’Errico, G. (2000). Degradation characteristics of straw and
washed straw. Thermochimica Acta, Vol.364, (2000), pp. 133–142
El-Sheikh, A.H., Newman, A.P., Al-Daffaee, H.K., Phull, S. & Cresswell, N. (2004).
Characterization of activated carbon prepared from a single cultivar of Jordanian
Olive stones by chemical and physicochemical techniques. Journal of Analytical and
Applied Pyrolysis, Vol.71, (2004), pp. 151–164.
Evans R., Marconi, U. M. B. & Tarazona, P. (1986). Fluids in narrow pores: Adsorption,
capillary condensation, and critical points. Journal of Chemical Physics, Vol.84, (1986),
2376-2399
Finch, H.E. & Redlick, R. (1969) US Patent 3, 451, 944
Fütterer, L. (2008) Untersuchung von aktivierten Pellets auf die spezifische Oberfläche und
von nicht aktivierten Pellets auf die Druckfestigkeit in Abhängigkeit von den
Parametern bei der Pelletherstellung, Projektarbeit Forschungszentrum
Karlsruhe/Berufsakademie Mannheim, 2008
Gonzalez, M. T., Molina-Sabio, M. & Rodriguez-Reinoso F. (1994) Steam activation of
olive stone chars, development of porosity. Carbon, Vol.32, No.8, (1994), pp. 1407-
1413
Gou, Y., Yang, S., Yu, K.,, Zhao, J., Wang, Z. & Xu, H. (2002). The preparation and
mechanism studies of rice husk based porous carbon. Materials Chemistry and
Physics, Vol.74, (2002), pp. 320-223
Hornung, A., Apfelbacher, A., Koch, W., Linek, A., Sagi, S., Schöner, J., Stöhr, J., Seifert, H.,
Tumiatti, V. & Lenzi F. (2005). Thermochemical conversion of straw - Haloclean® -
Intermediate pyrolysis. Proceedings of the 14th European Biomass Conference and
Exhibition, Paris, October 17 – 21, 2005, p. 913.
Activated Carbon from Waste Biomass
355
Hornung, A. & Seifert, H. (2006) Rotary kiln pyrolysis of polymers containing heteroatoms.
In: Feedstock Recycling and Pyrolysis of Waste Plastics : Converting Waste Plastics into
Diesel and Other Fuels, Scheirs, J. (Ed.), S.549-67, Wiley & Sons Ltd., Chichester,
ISBN 0-470-02152-7.
Hornung, U., Schneider, D., Seifert, H., Wiemer, H J. & Hornung, A. (2009a). Gekoppelte
Pyrolyse und Niedrigtemperatur-Reformierung. Chemie Ingenieur Technik Special
Issue: ProcessNet-Jahrestagung und 27. Jahrestagung der Biotechnologen, Vol.81, No.8,
(August, 2009), pp. 1215–1216
Hornung, U., Schneider, D., Hornung, A., Tumiatti, V. & Seifert, H. (2009b). Sequential
pyrolysis and catalytic low temperature reforming of wheat straw. Journal of
Analytical and Applied Pyrolysis, Vol.85, (2009), pp. 145-50
Huang, S., Jing, S., Wang, J., Wang, Z. & Jin, Y. (2001). Silica white obtained from rice husk
in a fluidized bed. Powder Technology, Vol.117, No.3, (2001), pp. 232–238.
Jensen, P.A., Sander, B. & Dam-Johansen, K. (2001a). Pretreatment of straw for power
production by pyrolysis and char wash. Biomass Bioenergy, Vol.20, (2001), pp. 431–
446
Jensen, P.A., Sander, B. & Dam-Johansen, K. (2001b). Removal of K and Cl by leaching of
straw char. Biomass and Bioenergy, Vol.20, (2001), pp. 447–457
Klank, D. (2006). Surface and Pores/particle size and shape/Zeta potential. Seminar at
University of Zürich, Zürich, October 17-19, 2006
Lopez-Gonzalez, J. de D., Martinez-Vilchez, F. & Rodriguez-Reinoso, F. (1980). Preparation
and characterization of active carbons from olive stones. Carbon, Vol.18, (1980), pp.
413-418
Molina-Sabio, M., Gonzales, M. T., Rodrigues-Reinoso, F. & Sepulveda-Escribano, A. (1996).
Effect of steam and carbon dioxid activation in the micropore size distribution of
activated carbon. Carbon, Vol.34, No.4, (1996), pp. 505-509
Oh, G.H. & Park, Ch. R. (2002). Preparation and Characteristics of rice-straw-based porous
carbons with high adsorption capacity. Fuel, Vol.81, (2002), pp 327–336.
Pendyal, B., Johns, M. M., Marshall, W. E., Ahmedna, M. & Rao, R. M. (1999). The effect of
binders and agricultural by-products on physical and chemical properties
of granular activated carbons. Bioresource Technology, Vol.68, (1999), pp. 247-
254
Qipeng, J & Aik Chong, L. (2008). Effects of pyrolysis conditions on the physical
characteristics of oil-palm-shell activated carbons used in aqueous phase
phenol adsorption. Journal of Analytical and Applied Pyrolysis, Vol.83, (2008), pp.
175–179
Sing, K. S. W., Everett, D. H., Haul, R. A. W., Moscou, L., Pierotti, R. A., Rouquerol, J. &
Siemieniewska, T. (1985). Reporting Physisorption Data for gas/solid Systems with
Special Reference to the Determination of Surface Area and Porosity. Pure & Applied
Chemistry, Vol.57, No.4, (1985), pp. 603—619
Sütcü H. & Demiral H. (2009). Production of granular activated carbons from loquat stones
by chemical activation. Journal of Analytical and Applied Pyrolysis, Vol.84, (2009), pp.
47–52
Progress in Biomass and Bioenergy Production
356
Sun, R., Thomkinson, J., Mao, F.C. & Sun, X.F. J. (2001). Physiochemical Characterization of
Lignins from rice straw by hydrogen peroxide treatment. Journal of Applied Polymer
Science, Vol.79, (2001), pp. 719–732.
Wu, F C., Tseng, R L., Hu, C C. & Wang, C C. (2005). Effects of pore structure
and electrolyte on the capacitive characteristics of steam- and KOH-activated
carbons for supercapacitors. Journal of Power Sources, Vol.144, (2005), pp. 302–
309.
Yun, Ch. H., Park, Y. H. & Park, Ch. R. (2001). Effects of pre-carbonization on porosity
development of activated carbons from rice straw. Carbon, Vol.39, (2001), pp. 559–
567.
Part 6
Fuel Production
19
Ethanol and Hydrogen
Production with Thermophilic
Bacteria from Sugars and Complex Biomass
Maney Sveinsdottir,
Margret Audur Sigurbjornsdottir and Johann Orlygsson
University of Akureyri, Borgir, Nordurslod, Akureyri
Iceland
1. Introduction
The increase in carbon dioxide (CO
2
) emissions has clearly much more profound effects on
global climate than earlier anticipated. The main source of CO
2
is by combustion of fossil fuel
but its concentration has increased from 355 ppm in 1990 to 391 ppm in 2011 (Mauna Loa
Observatory: NOAA-ASRL, 2011). Production of biofuels from biomass has emerged as a
realistic possibility to reduce fossil fuel use and scientists have increasingly searched for new
economically feasible ways to produce biofuels. The term biofuel is defined as fuel produced
from biomass that has been cultivated for a very short time; the opposite of fuel that is derived
from fossil fuel biomass (Demirbas, 2009). Plants and autotrophic microorganisms fix gaseous
CO
2
into volatile (sugars) and solid compounds (lignocellulose, starch) during growth. These
compounds can thereafter be converted to biofuels which, by combustion, releases CO
2
back to
atmosphere. This simplified way of carbon flow is not completely true, because growing,
cultivating, harvesting and process conversion to biofuels will, in almost all cases, add more
CO
2
to atmosphere although less as compared to fossil fuels.
There are several types of biofuels produced and used worldwide today. The most common
are methane, ethanol (EtOH) and biodiesel but also, to a lesser extent, hydrogen (H
2
),
butanol and propanol. There are also several methods to produce biofuels, ranging from
direct oil extraction from fat-rich plants or animal fat (biodiesel) to complex fermentations of
various types of carbohydrate rich biomass (H
2
, EtOH, butanol). Fermentation processes can
be performed by both bacteria and yeasts. This overview mainly focuses on the production
of EtOH and H
2
from biomass with thermophilic bacteria.
2. Production of EtOH and H
2
from biomass
EtOH as a vehicle fuel originated in 1908 when Henry Ford‘s famous car, Ford Model T
was running on gasoline and EtOH or a combination of both (Gottemoeller &
Gottemoeller, 2007). Biomass was however not used as a source for EtOH production until
in the early thirties of the 20th century when Brazil started to extract sugar from
sugarcane for EtOH production. During the World War II, EtOH production peaked at 7 7
million liters in Brazil (mixed to gasoline at 42%) (Nardon & Aten, 2008). After the war,
cheap oil outcompeted the use of EtOH and it was not until the oil crisis in the mid 70‗s
Progress in Biomass and Bioenergy Production
360
that interest in EtOH rose again. The program ―Pro-Alcool‖ was launched in 1975 to
favour EtOH production from sugarcane. In US, there has been a steady increase in EtOH
production from starch based plant material, e.g. corn, since the late 1970‘s (Nass et al.,
2007). Perhaps the main reason for the increase in EtOH production is the discovery that
methyl tert-butyl ether (MTBE), earlier used in gasoline as an additive, was contaminating
groundwater, leading to search for alternative and more environmentally friendly source
(Vedenov & Wetzsstein, 2008). Today, US and Brazil produce more than 65.3 billion liters
of EtOH which corresponds for 89% of the world production (Renewable Fuel
Association, 2010).
Production of EtOH from lignocellulose rich biomass has recently been focused upon. The
main reason is the fact that EtOH production from starch and sugar based biomasses is in
direct competition with food and feed production. This has been criticized extensively
lately, because of the resulting rise in the prizes of food and feed products (Cha & Bae,
2011). Production of EtOH from sugars and starch is called first generation production,
opposite to second generation production where lignocellulosic biomass is used.
Lignocellulose is composed of complex biopolymers (lignin, cellulose and hemicelluloses)
that are tightly bound together in plants. The composition of these polymers varies in
different plants (cellulose, 36-61%; hemicellulose, 13-39%; lignin 6-29%) (Olsson & Hahn-
Hagerdal, 1996). Of these polymers, only cellulose and hemicelluloses can be used for EtOH
production. However, before fermentation, the polymers need to be separated by
physiological, chemical or biological methods (Alvira et al., 2010). The most common
method is to use chemical pretreatment, either weak acids or bases but many other methods
are known and used today (see Alvira et al., 2010 and references therein). This extra
pretreatment step has been one of the major factors for the fact that EtOH production from
complex biomass has not been commercialized to any extent yet compared to first
generation ethanol production. Also, after hydrolysis, expensive enzymes are needed to
convert the polymers to monosugars which can only then be fermented to EtOH.
Conventionally, most of the EtOH produced today is first generation EtOH but lately,
especially after US launched their large scale investment programs (US Department of
Energy, 2007), second generation of EtOH seems to becoming a reality within the next few
years or decades.
The sugars available for fermentation after the pretreatment and hydrolysis of biomass
(when needed) can be either homogenous like sucrose and glucose from sugarcane, and
starch, respectively or heterogeneous when originating from lignocellulosic biomass. Thus,
the main bulk of biomass used for EtOH production today are two types of sugars, the
disaccharide sucrose and the monosugar glucose, both of whom can easily be fermented to
EtOH by the traditional baker‘s yeast, Saccharomyces cerevisae. This microorganisms has
many advantages over other known EtOH producing microorganisms. The most important
are high EtOH yields (>1.9 mol EtOH/mol hexose), EtOH tolerance (> 12%), high
robustness and high resistance to toxic inhibitors. However, the wild type yeast does not
degrade any pentoses (Jeffries, 2006). The use of genetic engineering to express foreign
genes associated with xylose and arabinose catabolism have been done with some success
(van Maris et al., 2007) and a new industrial strain with xylose and arabinose genes was
recently described (Sanchez et al., 2010). Also, no yeast has been reported to have cellulase
or hemicellulase activity. The mesophilic bacterium Zymomonas mobilis is a highly efficient
EtOH producer. The bacterium is homoethanolgenic, tolerates up to 12% EtOH and grows
2.5 times faster compared to yeasts (Rogers et al., 1982). The bacterium utilizes the Entner-
Ethanol and Hydrogen Production with
Thermophilic Bacteria from Sugars and Complex Biomass
361
Doudoroff pathway with slightly higher EtOH yields than yeasts but lacks the pentose
degrading enzymes. Many attempts have however been made to insert arabinose and xylose
degrading genes in this bacterium (Deanda et al., 1996; Zhang et al., 1995). The company
DuPont has recently started to use a genetically engineered Z. mobilis for cellulosic EtOH
production (DuPont Danisko Cellulosic Ethanol LLC, 2011).
Especially, the lack of being able to utilize arabinose and xylose, both major components in
the hemicellulosic fraction of lignocelluloses, has lead to increased interest in using other
bacteria with broader substrate spectrum. Bacteria often possess this ability and are capable
of degrading pentoses, hexoses, disaccharides and in some cases even polymers like
cellulose, pectin and xylans (Lee et al., 1993; Rainey et al., 1994). The main drawback of
using such bacteria is their lower EtOH tolerance and lower yields because of production of
other fermentation end products like acetate, butyrate, lactate and alanine (Baskaran et al.,
1995; Klapatch et al., 1994; Taylor et al. 2008). Additionally, most bacteria seem to tolerate
much lower substrate concentrations although the use of fed batch or continuous culture
may minimize that problem. On the opposite however, many bacteria show good EtOH
production rates. The use of thermophilic microorganisms has especially gained increased
interest recently. The main reasons are, as previously mentioned, high growth rates but also
less contamination risk as well as using bacteria that can grow at temperatures where ―self
distillation‖ is possible, thus eliminating low EtOH tolerance and high substrate
concentration problems. Also, the possibilty to use bacteria with the capacity to hydrolyze
lignocellulosic biomass and ferment the resulting sugars to EtOH simultaneously is a
promising method for EtOH production.
The production of H
2
is possible in several ways but today the main source of H
2
is from
fossil fuels and, to a lesser extent, by electrolysis from water. H
2
is an interesting energy
carrier and its combustion, opposite to carbon fuels, does not lead to emission of CO
2
.
Biological production of H
2
is possible through photosynthetic or fermentative processes
(Levin et al., 2004; Rupprecht et al., 2006). This chapter will focus on biological H
2
production by dark fermentation by thermophilic bacteria only. Fermentative production of
H
2
has been known for a long time and has the advantage over photosynthetic processes of
simple operation and high production rates (Chong et al., 2009). Also, many types of organic
material, e.g. wastes, can be used as substrates. Thus, its production possesses the use of
waste for the production of renewable energy. Fermentative hydrogen production has
though not been commercialized yet but several pilot scale plants have been started (Lee &
Chung, 2010; Lin et al., 2010).
3. Physiology of thermophilic EtOH and H
2
producing bacteria
Thermophilic bacteria can degrade many carbohydrates and produce various end products,
among them both EtOH and H
2
. Figure 1 shows the carbon flow from glucose by
fermentation by the use of Embden-Meyerhof pathway (EMP). The majority of
microorganisms degrade hexoses through this pathway or the Entner-Douderoff pathway
(ED). The degradation of glucose with EMP generates two NADH, two pyruvates, the key
intermediate in most organisms, together with the formation of two ATP by substrate level
phosphorylation. The ED pathway, however, is more restricted to Gram-negative bacteria
and Archaea and generates only one mol of ATP, which explains its low distribution among
anaerobic bacteria. Some bacteria, especially hyperthermophiles, are known to be able to use
both pathways simultaneously (Moat et al., 2002; Siebers & Schönheit, 2005).
Progress in Biomass and Bioenergy Production
362
There are also some variations of the classical EMP among thermophilic microorganisms.
Some archaea e.g. Pyrococcus and Thermococcus use ADP instead of ATP to transfer
phosphate groups to hexoses in the preparation steps of the glycolysis. These bacteria also
use ferredoxin-dependent glyceraldehyde-3-phosphate ferredoxin oxidoreductase (GAPOR)
for converting glyceraldehyde-3-phosphate to 3-phosphoglycerate in one step (Chou et al.,
2008). Thermophilic bacteria, however, use the common glyceraldehydes-3-phosphate
dehydrogenase (GAPDH) and reduce glyceraldehydes-3-phosphate to 1,3-glycerate which is
thereafter converted to 3-phosphoglycerate. Thus, both groups produce two molecules of
ATP by substrate level phosphorylation but the archaea ―sacrifice‖ one and use it to
together with two molecules of AMP to produce two molecules of ADP, needed for hexose
phosphorylation. Consequently, the amount of energy conserved in glucose to acetate
conversion is 3.2 instead of the expected 4.0 ATP/glucose (Sapra et al., 2003).
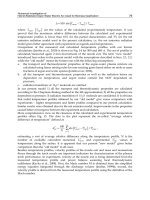
Fig. 1. Simplified scheme of glucose degradation to various end products by strict anaerobic
bacteria. Enzyme abbreviations: ACDH, acetaldehyde dehydrogenase; ADH, alcohol
dehydrogenase; AK, acetate kinase; Fer:NAD(P), ferredoxin:NAD(P) oxidoreductase; H
2
-
ase, hydrogenase; LDH, lactate dehydrogenase; PFOR, pyruvate:ferredoxin oxidoreductase;
PTA, phosphotransacetylase.
Pyruvate is the end product of glycolysis and can be converted to fermentation products
like H
2
, EtOH and many more (Fig. 1). The carbon flow depends on the microorganisms
involved and the environmental conditions. Pyruvate can e.g. be reduced to lactate by
lactate dehydrogenase (LDH) but the most favorable pathway for anaerobic bacteria is to
Ethanol and Hydrogen Production with
Thermophilic Bacteria from Sugars and Complex Biomass
363
oxidize pyruvate to acetyl-CoA and CO
2
by using pyruvate:ferredoxin oxidoreductase
(PFOR) which can be converted to acetate with concomitant ATP synthesis from the
acetyl-phosphate intermediate. Acetate is thus the oxidized product but the main
advantage for the microorganism is the extra ATP produced. The electrons are
transported to reduced ferredoxin which acts as an electron donor for hydrogenases and
H
2
is produced as the reduced product. There are mainly two types of hydrogenases;
NiFe hydrogenases and the FeFe hydrogenases. Recent overview articles have been
published on the subject (Chou et al., 2008; Kengen et al., 2009). Acetyl Coenzyme A can
also be converted to acetaldehyde by acetaldehyde dehydrogenase (ACDH) and further to
EtOH by alcohol dehydrogenase.
Strict anaerobes can produce H
2
from two major breakpoints during degradation of glucose.
Firstly, from a NAD(P)H by GAPDH and from pyruvate ferredoxin oxidoreductase (PFOR)
(Jones, 2008). The principal H
2
pathway is through PFOR because of thermodynamics
hindrance of reoxidizing NADH (Jones, 2008). It is a well known phenomenon that the low
H
2
yields observed by mesophilic and moderate thermophilic bacteria are due to the fact
that H
2
production from either ferredoxin or NAD(P)H are thermodynamically unfavorable
(Jones, 2008; Hallenbeck, 2009). The redox potential of Fd
red
/Fe
ox
couple depends on the
microorganism and temperature involved. In nature, high partial pressures of H
2
are
relatively uncommon because of the activity of H
2
scavenging microbes, e.g. methanogens
or sulfate reducing bacteria (Cord-Ruwisch et al., 1988). This results in a low partial pressure
of H
2
which is favorable for a complete oxidation of glucose to acetate and CO
2
. At high
temperatures, the influence of the partial pressure of H
2
is less on the key enzymes
responsible for H
2
production. This is the main reason why extremophilic bacteria have been
reported to produce up to 4 moles of H
2
together with 2 moles of acetate in pure cultures
and also for the fact that microorganisms growing at lower temperatures direct their end
product formation to other reduced products. At lower temperatures, the NADH ferrodoxin
oxidoreductase (NOR) that converts NADH to Fd
red
is strongly inhibited. The E° is – 400 mV
for Fd
red
/Fd
ox
couple but -320 mV for the NADH/NAD
+
couple (Jones, 2008; Hallenbeck,
2009). Therefore, at low temperatures, elevated H
2
concentrations inhibit H
2
evolution at
much lower concentrations as compared to extreme temperatures. Mesophilic and moderate
thermophilic bacteria respond to this by directing their reducing equivalents to other more
favorable electron acceptors and consequently produce reduced products like EtOH, lactate,
butyrate and alanine (Fig. 1).
Following are the main stoichiometry equations for the degradation of glucose to various
end products by microorganisms with special focus on H
2
and EtOH production.
The amount of H
2
produced depends on the fermentation pathways used and end product
formation. For example, if acetic acid is the final product the theoretical yield for one mole
of glucose is four moles of H
2
:
C
6
H
12
O
6
+ 4 H
2
O 2CH
3
COO
-
+ 4H
2
+ 2HCO
3
-
+ 4H
+
(1)
If on the other hand the final product is butyric acid, the theoretical yield of H
2
is only two
moles of H
2
per mole of glucose:
C
6
H
12
O
6
+ 2 H
2
O CH
3
CH
2
CH
2
COO
-
+ 2H
2
+ 2HCO
3
-
+ 3H
+
(2)
The production of EtOH by Saccharomyces cerevisae and Zymomonas mobilis occurs according
to:
Progress in Biomass and Bioenergy Production
364
C
6
H
12
O
6
+ 4 H
2
O 2CH
3
COH
-
+ 2HCO
3
-
+ 4H
+
(3)
Bacteria however, usually produce a mixture of EtOH together with other end products.
This results in lower EtOH yields and, in some cases, production of H
2
. If lactate is the only
end product, no H
2
is formed:
C
6
H
12
O
6
+ 4 H
2
O Lactate
-
+ 2HCO
3
-
+ 4H
+
(4)
4. Thermophilic anaerobic bacteria – classification and physiology
In recent years, thermophilic anaerobic bacteria have gained increased attention as potential
EtOH and H
2
producing microorganisms. Depending on optimal growth temperatures,
thermophilic bacteria can be divided into several categories, e.g. moderate thermophiles
(T
opt
between en 45 to 55°C), true thermophiles (T
opt
between 55 to 75°C) and extremophiles
with optimum temperature above 75°C (Brock, 1986). The ability of thermophiles to live at
high temperatures is mainly due to their thermostable proteins; the cell membrane of
thermophilic bacteria contains more saturated fatty acids which make it stiffer and more
heat resistant as compared to mesophiles (Brock, 1986).
Thermophilic bacteria are capable of adapting to environmental conditions and are able to
thrive in geothermal areas although the temperature might be slightly higher than the
optimum growth temperature. Geothermal areas offer stability in heat and are thus
favorable habitats for thermophilic bacteria (Brock, 1986; Kristjansson & Alfredsson, 1986).
Generally, most known thermophilic species are obligate or facultative anaerobes since
geothermal areas have low oxygen concentrations (Amend & Shock, 2001). Less variety
seems to be of strict anaerobic, heterotrophic thermophilic bacteria (see review of Wagner &
Wiegel, 2008 and references therein).
4.1 Thermophilic EtOH and H
2
producing bacteria
There are relatively few genera of thermophiles that include bacteria with good H
2
and
EtOH producing capacities. Among good EtOH producers are bacteria that belong to the
genera of Clostridium, Thermoanaerobacter and Thermoanaerobacterium but good H
2
producers
are the extremophiles like Caldicellulosiruptor and Thermotoga and the archaeon Thermococcus
and Pyrococcus. It varies to a great extent how much data is available in literature concerning
pure culture studies of individual species on biofuel production. Much data is not on the
efficiency of these bacteria to produce H
2
and EtOH but merely on phylogenetic status and
basic physiological properties. Also, the data on biofuel production properties from these
bacteria on hydrolysates from lignocellulosic biomass is scarce but more is known on yields
from monosugars. Below, the discussion will be on the major phylogenetic and
physiological characteristics of most of the ―good‖ EtOH and H
2
producing thermophiles
known today. Later chapters deal with H
2
and EtOH production rates and yields from both
sugars and from complex lignocellulosic biomasses by these bacteria and more.
4.1.1 Clostridium
The genus Clostridium belongs to the family Clostridiaceae, order Clostridiales, class
Clostridia and phylum Firmicutes. These bacteria are spore forming and often present in
environments which are rich in plant decaying material. It is thus not surprising that many
species are capable of polymer hydrolyzation and this is one of the main reasons for
Ethanol and Hydrogen Production with
Thermophilic Bacteria from Sugars and Complex Biomass
365
extensive research on biofuel production from complex biomass by these bacteria
(Canganella & Wiegel, 1993; Carreira & Ljungdahl, 1993). Several cellulose-degrading
enzymes form a structure called cellulosome, located and embedded on the external surface
of the cell membrane (Demain et al., 2005). The genus contains a very diverse group of
bacteria as shown by a phylogenetic analysis of Collins and co-workers where Clostridium
species were compared both within species belonging to the genus and to related taxa
(Collins, et al., 1994). This investigation and others lead to the conclusion that more than half
of the species currently assigned to the genus Clostridium are in fact not closely related to the
type species C. butyricum and should therefore not be included in the newly defined genus
Clostridium. The genus contains more than 200 validly described species but only about 15
are thermophilic. Two of those thermophilic Clostridia, C. thermocellum and C.
thermohydrosulfuricum (now Thermoanaerobacter thermohydrosulfuricum) have attracted the
most attention and the cellulosome of C. thermocellum has been characterized extensively
(Demain et al., 2005). Among other well known thermophilic Clostridia are C.
thermobutyricum (Wiegel et al., 1989), C. thermosucciongenes (Drent et al., 1991) and C.
clariflavum (Shiratori et al., 2009) and several others.
4.1.2 Thermoanaerobacterium
Thermoanaerobacterium together with genus Thermoanaerobacter falls within clusters V, VI and
VII in phylogenetic interrelationships of Clostridium species (Collins et al., 1994). The genus
was first described in 1993 when two thermophilic, xylan degrading strains were isolated
from Frying Pan Springs in Yellowstone National Park (Lee et al., 1993). They were
compared with other xylan degrading bacteria and new taxonomic assignments were
proposed thereafter. Today the genus consists of nine validly described species; T.
aciditolerans, T. aotearoense, T. saccharolyticum, T. thermosaccharolyticum, T. thermosulfurigenes,
T. xylanolyticum, T. fijiensis, T. polysaccharolyticum and T. zeae (German Collection of
Microorganisms and Cell Cultures and references therein). Most Thermoanaerobacterium
species have been isolated from hot springs or leachate of waste from canning factories.
Thermoanaerobacterium species are known for their abilities to convert carbohydrates to
various end products like acetate, EtOH, lactate, H
2
and CO
2
. Some species have shown
promising EtOH and H
2
production capacity but production of mixed end products limit
their use (Ren et al., 2008; 2009; 2010; Romano et al., 2010; Sveinsdottir et al., 2010). T.
saccharolyticum has however been genetically engineered and both acetate and lactate
formation has been knocked out (Shaw et al., 2008). According to the description, members
of this genus reduce thiosulfate to elemental sulfur while members of Thermoanaerobacter
reduce thiosulfate to H
2
S (Lee et al., 1993).
4.1.3 Thermoanaerobacter
Bacteria within this genus were originally classified within the genus Clostridium because of
close phylogenetic relationship and physiological properties. These bacteria use the classical
EMP pathway for sugar degradation and produce EtOH, acetate and lactate as major end
products (Lee et al., 1993). Most species have broad substrate range and can degrade both
pentoses and hexoses. The genus consists of 24 species (subspecies included) originating
from various environments like hot springs and oil fields (Collins et al., 1994; Larsen et al.,
1997; Lee et al., 1993; German Collection of Microorganisms and Cell Cultures and
references therein). Most species produce EtOH and H
2
as well as lactate, and in some cases
alanine as end products. The type species, Thermoanerobacter ethanolicus and several other
Progress in Biomass and Bioenergy Production
366
species within the genus has been extensively studied for EtOH production (Fardeau et al.,
1996; Georgieva & Ahring, 2007; Georgieva et al., 2008a. b; Lacis & Laword 1988a,b; Lamed
& Zeikus, 1980a,b). H
2
production is usually low compared to EtOH by Thermoanaerobacter
although Thermoanaerobacter tengcongensis has been described to produce up to 4 moles of H
2
from one mole of glucose under nitrogen flushed fermentor systems (Soboh et al., 2004).
4.1.4 Caldicellulosiruptor
The genus Caldicellulosiruptor was first proposed in 1994 by Rainey and co-workers on the
basis of physiological characteristics and phylogenetic position of a strain they isolated,
Caldicellulosiruptor saccharolyticus (Tp8T 6331) (Rainey et al., 1995). Today the genus holds
nine different species; C. acetigenus, C. bescii, C. hydrothermalis, C. kristjanssonii, C.
kronotskyensis, C. lactoaceticus, C. obsidiansis, C. owensensis and C. saccharolyticus (German
Collection of Microorganisms and Cell Cultures and referenses therein). All species are
extremely thermophilic, cellulolytic, non-spore-forming anaerobes that have been isolated
from geothermal environments such as hot springs and lake sediments (Rainey et al., 1994;
Yang et al., 2010). Caldicellulosiruptor species have a relatively broad substrate spectrum
capable to utilize e.g. cellulose, cellobiose, xylan and xylose. Extreme thermophiles, have
been shown to have superior H
2
production yields and rates compared to mesophiles and
produce few other byproduct besides acetate. This makes Caldicellulosiruptor species
excellent candidates for H
2
production. C. saccharolyticus and C. owensis have been
extensively studied for H
2
production from sugar and hydrolysates from lignocellulosic
biomass (Kadar et al., 2004; Vrije et al., 2007; Zeidan & van Niel, 2010).
4.1.5 Thermotoga
The genus of Thermotoga was first described in 1986 when a unique extremely thermophilic
bacteria was isolated from geothermally heated sea floors in Italy and the Azores (Huber et al.,
1986). Today, nine different species have been identified; T. elfii, T. hyphogea, T. lettingae, T.
maritima (type species), T. naphthophila, T. neapolitana, T. petrophila, T. subterranean and T.
thermarum (German Collection of Microorganisms and Cell Cultures and references therein).
These species are extremophiles, growing at temperatures that are highest reported for
bacteria. All are strictly anaerobic and the cells are rod-shaped with an outer sheethlike
structure called toga. (Huber et al., 1986; Jannasch et al., 1988). Most species have been isolated
from deep environments, high temperature and pressure environments like oil reservoirs,
often rich of sulfur-compounds. Most of them are thus able to reduce either elemental sulfur,
thiosulfate or both. Members of Thermotoga ferment sugars to mainly acetate, CO
2
and H
2
like
Caldicellulosiruptor species. Only three species have been reported producing traces of EtOH.
Most strains have shown the property of reducing pyruvate to alanine from sugar
fermentation and T. lettingae produces alanine from methanol (in the presence of elemental
sulfur or thiosulfate) (Balk et al., 2002). Other special feature within the genus is the ability of
T. lettingae to degrade xylan at 90°C and its property of methanol metabolism (Balk et al.,
2002). Hydrogen production has been extensively studied for T. elfi, T. maritima and T.
neapolitana (d‘Ippolito et al., 2010; Nguyen et al., 2008a,b; van Niel et al., 2002).
4.1.6 Other thermophilic bacteria producing H
2
and EtOH
Apart from the above mentioned genera the capacity to produce EtOH and H
2
has been
reported for many other genera. Examples are species within Caloramator, Caldanaerobacter,
Ethanol and Hydrogen Production with
Thermophilic Bacteria from Sugars and Complex Biomass
367
Caldanerobius and the archaeon Thermococcus and Pyrococcus. Some species within these
genera will be discussed in later chapters.
5. Production of EtOH by thermophilic bacteria
The interest in EtOH production by thermophilic bacteria originates shortly after the oil
crisis in the mid 70‗s of the twentieth century. Earliest reports on EtOH production from
sugars include work on Thermoanaerobacter brockii and Clostridium thermocellum (Ben Bassat
et al., 1981; Lamed et al., 1980; Lamed & Zeikus, 1980a, 1980b) but later on other
Thermoanaerobacter species, e.g. T. finnii, (Faredau et al., 1996), T. thermohydrosulfuricus
(Lovitt et al., 1984; Lovitt et al., 1988), T. mathrani (Larsen et al., 1997) and
Thermoanaerobacterium species (Koskinen et al., 2008a; Sveinsdottir et al., 2009; Zhao et al.,
2009, 2010). It was however not until recently that the use of thermophilic bacteria for EtOH
production from lignocellulosic biomass arises. The earliest reports on EtOH production of
more complex nature are from 1981 on starch (Ben Bassat et al., 1981) and 1988 on avicel
(Lamed et al., 1988). The first study on lignocellulosic biomass (hemicellulose fraction of
birch- and beechwood) was in 1983 by Thermoanaerobacter ethanolicus and several other
thermophilic bacteria (Wiegel et al., 1983). Following chapters are divided into two main
subchapters; 1) studies of EtOH production from sugars both in batch and continuous
cultures with either pure or cocultures of thermophilic bacteria and 2) studies of EtOH
production from lignocellulosic biomass by mixed or pure cultures of thermophilic bacteria.
5.1 Production of EtOH from sugars
Although it has been known for a long time that thermophilic bacteria produce EtOH from
various carbohydrates it was not until 1980 the first papers appeared in literature with the
focus on EtOH production. Earlier investigations include work on Thermoanaerobacter brockii,
Thermoanaerobacter thermohydrosulfuricus and Clostridium thermocellum (Ben Bassat et al., 1981;
Lamed & Zeikus, 1980a; 1980b; Lovitt et al., 1984). Ethanol yields by T. brockii were only
moderate or between 0.38 (Lamed & Zeikus, 1980b) to 0.44 mol EtOH mol glucose
-1
equivalents (Ben Bassat et al., 1981). In the latter investigation the focus was mostly on the
effects of additional acetone and H
2
on end product formation. Much higher yields were
later observed by Thermoanaerobacter thermohydrosulfuricus, or 0.9 to 1.9 mol EtOH mol
glucose
-1
. (Lovitt et al., 1984; 1988), also with the main focus on the effect of solvents on
EtOH production, e.g. EtOH tolerance. Thermoanerobacter ethanolicus was described in 1981
(Wiegel & Ljungdahl., 1981) showing extremely good yields of ethanol from glucose
(1.9 mol EtOH mol glucose
-1
). Later this strain has been extensively studied by Lacis and
Lawford (Lacis and Lawford 1988a, 1988b, 1989, 1991). Early observation was on high EtOH
yields on xylose at low substrate (4.0 g L
-1
) concentrations. The yields were 1.30 and 1.37 mol
EtOH mol xylose
-1
in batch and continuous cultures, respectively (Lacis & Lawford, 1988a)
but only at low substrate concentrations. At higher concentrations (27.5 g L
-1
) the yields
lowered to 0.6 mol EtOH mol xylose
-1
. Further studies by using xylose limiting continuous
cultures, indicated that EtOH yields were more dependent on length of cultivation than
upon growth rate and higher yields were presented (1.43 mol mol xylose
-1
) (Lacis &
Lawford, 1988b, 1989). Later data from this strain on glucose showed lower EtOH yields and
the direction of the carbon flow was towards lactate formation by increasing substrate
concentrations (Lacis & Lawford, 1991). Thermoanerobacter ethanolicus JW200 showed also
very good EtOH yields from xylose and glucose at low (10 g L
-1
) substrate concentrations, or
Progress in Biomass and Bioenergy Production
368
1.45 and 1.95 mol, respectively (Carreira et al., 1982). A mutant strain was later developed
(JW200Fe(4)) that showed similar yields but at higher (30 g L
-1
) substrate concentrations
(Carreira et al., 1983). Other investigations on this species on sucrose showed between
1.76 to 3.60 mol EtOH mol sucrose
-1
with high substrate concentrations (15 to 30 g L
-1
)
(Avci et al., 2006). Recent study on Thermoanerobacter ethanolicus strain interestingly shows
that the addition of external acetate increases EtOH yields from xylose, glucose and
cellobiose (He et al., 2010). EtOH yields on xylose were 1.0 mol EtOH mol glucose
-1
without
any acetate added but increased to 1.17 by adding 150 mM of acetate. Similar increase was
observed on glucose, or from 1.16 to 1.34 mol EtOH mol glucose
-1
without and with added
acetate, respectively. It has been suggested that acetate may disrupt energy production
through accelerated fermentation (Russel, 1992) which may lead to lower biomass
production and higher end product formation. Fardeau et al. (1996) investigated the effect
of thiosulfate as electron acceptor on sugar degradation and end product formation
by Thermoanaerobacter finnii. This strain shows good EtOH yields on xylose or 1.76 mol
EtOH mol xylose
-1
which is actually higher than the theoretical yield (1.67) from this sugar.
Yields on glucose were however lower or, 1.45 mol EtOH mol glucose
-1
. Not surprisingly,
the addition of thiosulfate shifted end product formation towards acetate with higher cell
yield and lower EtOH production. A study of bacteria isolated from Icelandic hot spring
shows that a Thermoanerobacter sp. AK33 showed good EtOH yields on monosugars
(Sveinsdottir et al., 2009). Glucose and xylose fermentations resulted in 1.5 and 0.8 mol
EtOH from one mole of glucose and xylose, respectively. Thermoanaerobacterium AK17,
isolated from Icelandic hot spring, has been extensively studied for EtOH production
(Koskinen et al., 2008a; Orlygsson & Baldursson, 2007; Sveinsdottir et al., 2009). This strain
produces 1.5 and 1.1 mol EtOH from one mole of glucose and xylose, respectively.
A moderate thermophile, Paenibacillus sp. AK25 has also been shown to produce 1.5 mol
EtOH mol glucose
-1
(Sveinsdottir et al., 2009).
One of the main drawbacks for the use of thermophilic bacteria for EtOH production from
biomass is their low tolerance towards EtOH. Several studies have been done with
Clostridium thermosaccharolyticum (Baskaran et al., 1995; Klapatch et al., 1994) and
Thermoanaerobacter sp. (Georgieva et al., 2008b) to increase EtOH tolerance. The highest
EtOH tolerance is by a mutant strain of Thermoanaerobacter ethanolicus, or 9% (wt/vol) at
69°C (Carriera & Ljungdahl, 1983) but later studies with JW200 Fe(4), one of its derivatives,
show much less tolerance (Hild et al., 2003). Georgieva and co-workers published very high
EtOH tolerance (8.3%) for Thermoanerobacter BG1L1, a highly efficient xylose degrader in
continuous culture studies (Georgieva et al., 2008b). Thermoanerobacter thermohydrosulfuricus
degrades various pentoses and hexoses as well as starch to high concentrations of EtOH (Ng
et al., 1981). By transferring the parent strain (39E) to successively higher concentrations of
EtOH, an alcohol tolerant strain (39EA) was obtained (Lovitt et al., 1984). The mutant strain
grows at 8% EtOH concentrations (wt/vol) at 45°C but only up to 3.3% at 68°C. The parent
strain produces 1.5 mol EtOH mol glucose
-1
without any addition of EtOH but the yield
lowered to 0.6 mol at 1.5% initial EtOH concentrations. The mutant strain showed lower
EtOH yields without any addition of EtOH, or 0.9 mol EtOH mol glucose
-1
but the yields did
not decrease to any extent by increasing initial EtOH concentrations up to 4%. Further
experiments with the wild type also indicated the role of H
2
production and its influence on
EtOH production (Lovitt et al., 1988). Thus, by changing the gas phase from nitrogen to H
2
or carbon monoxide, EtOH yields increased from 1.41 mol EtOH mol glucose
-1
to 1.60 and
1.90 mol, respectively.
Ethanol and Hydrogen Production with
Thermophilic Bacteria from Sugars and Complex Biomass
369
Table 1. EtOH production from sugars by defined and mixed cultures of thermophilic
bacteria. Cultivation was either in batch or continuous (con). EtOH yields as well as
substrate concentrations and incubation temperature are also shown.
Recent studies with mixed cultures (batch) were conducted on glucose (Zhao et al., (2009)
and xylose (Zhao et al., 2010) where various environmental parameters were optimized for
both EtOH and H
2
production. The main bacterial flora, originating from biohydrogen
reactor operated at 70°C and fed with xylose and synthetic medium, was identified as
various species of Thermoanaerobacter, Thermoanaerobacterium and Caldanaerobacter. Highest
yields observed to be 1.53 and 1.60 mol EtOH mol glucose
-1
and xylose
-1
respectively.
Several efforts have recently been made to enrich for new ethanologenic thermoanerobes.
Two surveys have been done from Icelandic hot springs where several interesting bacteria
were isolated with EtOH yields of > 1.0 mol EtOH from one mol glucose and xylose
(Koskinen et al., 2008; Orlygsson et al., 2010).
T. brockii Cellobiose Batch 10.0 0.38 60 Lamed & Zeikus (1980)
T. brockii Glucose Batch 5.0 0.44 nd Ben Bassat et al. (1981)
T. ethanolicus Glucose Batch 8.0 1.90 72 Wiegel & Ljungdahl. (1981)
T. ethanolicus Glucose Batch 20.0 1.90 68 Carreira et al. (1983)
T. thermohydrosulfuricus Glucose Batch 5.0 1.60 60 Lovitt et al. (1984)
T. thermohydrosulfuricus Glucose Batch 5.0 0.90 60 Lovitt et al. (1984)
T. thermohydrosulfuricus Glucose Batch 10.0 1.40-1.90 60 Lovitt et al. (1988)
T. ethanolicus Xylose Batch 4.0-27.5 0.60-1.30 60 Lacis & Lawford (1988a)
T. ethanolicus Xylose Con 4.0 1.37 60 Lacis & Lawford (1988a)
T. ethanolicus Xylose Con 4.0 1.43 60 Lacis & Lawford (1988b)
T. ethanolicus Xylose Con 4.0 1.37 68 Lacis & Lawford (1989)
T. ethanolicus Xylose Con 4.0 1.37 67-69 Lacis & Lawford (1991)
T. ethanolicus Xylose Con 20.0 1.06 67-69 Lacis & Lawford (1991)
T. finnii Glucose Batch NA 1.45 60 Fardeau et al. (1996)
T. finnii Xylose Batch NA 1.76 60 Fardeau et al. (1996)
C. thermocellum Cellobiose Batch 2.6 1.60 60 Knutson et al. (1999)
T. ethanolicus Xylose Con 4.0 1.30 69 Hild et al. (2003)
T. ethanolicus Sucrose Batch 15-30 1.80-3.60 65 Avci et al. (2006)
T. thermohydrosulfuricus Sucrose Batch 15-30 1.10 - 3.00 65 Avci et al. (2006)
Thermoanaerobacter ap 65-2 Sucrose Batch 15-30 1.30-3.20 65 Avci et al. (2006)
Thermoanaerobacter BG1L1 Xylose Con 10.0 1.28 70 Georgieva at al. (2008)
Enrichment cultures Glucose Batch 18.0 0.10-1.70 50-78 Koskinen et al. (2008)
Coculture Glucose Con 12.6-25.2 1.37 60 Koskinen et al. (2008a)
Thermoanaerobacterium AK17 Glucose Batch 3.6 1.50 60 Sveinsdottir et al. (2009)
Thermoanaerobacterium AK17 Xylose Batch 3.0 1.10 60 Sveinsdottir et al. (2009)
Thermoanaerobacter Ak33 Glucose Batch 3.6 1.50 70 Sveinsdottir et al. (2009)
Thermoanaerobacter Ak33 Xylose Batch 3.0 0.80 70 Sveinsdottir et al. (2009)
Paenibacillus AK25 Glucose Batch 3.6 1.50 50 Sveinsdottir et al. (2009)
Paenibacillus AK25 Xylose Batch 3.0 0.90 50 Sveinsdottir et al. (2009)
Mixed culture Glucose Batch 5.0 1.53 70 Zhao et al. (2009)
Mixed culture Xylose Batch 2.0 1.60 70 Zhao et al. (2010)
Enrichment cultures Glucose Batch 9.0 1.34 50-75 Orlygsson et al. (2010)
Enrichment cultures Xylose Batch 7.5 1.30 50-75 Orlygsson et al. (2010)
T. ethanolicus Xylose Batch 5.0 1.00-1.20 65 He et al. (2010)
T. ethanolicus Glucose Batch 5.0 1.20-1.30 65 He et al. (2010)
Ethanol yield
(mol EtOH mol
sugar
-1
)
Temp.
(°C)
Reference
Organisms
Sugar
Cultivation
method
Sugar conc.
(gL
-1
)
Progress in Biomass and Bioenergy Production
370
5.2 Production of EtOH from complex biomass
Production of EtOH from lignocellulosic biomass has gained increased interest in recent
years. The type of biomass used has varied to a great extent, e.g. wheat straw, barley
straw, hemp, grass, paper and more. Also, the type of pretreatment used is different from
one experiment to another. Most data is on biomass pretreated with dilute sulfuric acid or
with alkaline pretreatment. The concentration of hydrolysates made from the biomass is
also very broad, mostly varying from 0.2 % (w/v) to 15% (w/v). Finally, either pure or
mixed cultures are used and either batch or continuous mode. The maximum yield of
EtOH from glucose fermentation is 0.51 g EtOH g glucose
-1
. This corresponds to 2 mol
EtOH/mol hexose or 11.1 mM g
-1
. Considering the complex structure of lignocellulosic
biomass, it is not surprising that EtOH yields are usually considerable lower from such
substrates (Table 2). Earliest available data on thermophilic bacteria using polymeric
biomass originates from studies on Thermoanaerobacter ethanolicus and Clostridium
thermocellum on hemicellulose from birch- and beechwood (Wiegel et al., 1983). These
early reports showed promising results but highest yields were observed from the mutant
strain T. ethanolicus, 4.5 mM g
-1
xylose equivalent used. Three strains of Clostridium
thermocellum produced between 1.40 to 2.60 mM EtOH g avicel
-1
(Lamed et al., 1988).
Higher yields (5.0 mM g
-1
and 5.5 mM g
-1
) by this bacterium were shown on the same
substrate by others (Ahn et al., 1996; Lynd et al., 1989). Rani and co-workers studied
EtOH production from both cellulose and lignocellulosic biomass by C. thermocellum (Rani
et al., 1998). EtOH yields on avicel and Whatman paper was up to 7.2 and 8.0 mM g
-1
EtOH, respectively. Similar yields were obtained from paddy straw, sorghum stover and
corn stubs, pretreated with alkali. The highest yields of EtOH production from cellulosic
biomass by C. thermocellum are from filter paper, 8.2 mM g
-1
substrate (Balusu et al., 2004;
2005). In all studies mentioned above with C. thermocellum the concentration of cellulose
was below 8.0 g L
-1
. Lin and co-workers recently investigated degradation of napier grass
and cellulose (avicel) by C. thermocellum and a mixed enrichment culture (Lin et al., 2010).
They used from 2.0 to 40.0 g L
-1
substrate concentrations. The pure culture produced
merely 0.72 mM g
-1
avicel but up to 3.87 mM g
-1
Napier grass. The mixed culture
produced between 0.7-0.9 mM g
-1
Napier grass and 0.4–5.7 mM g
-1
avicel. A dramatic
decrease in yields was observed by increasing substrate concentrations.
Ahring and co-workers (Ahring et al., 1996) investigated the potential of five
thermoanaerobes for EtOH production from the hemicelluloses fraction of wheat straw
hydrolysates. Three of the strains produced only minor amounts of EtOH from xylan but
Thermoanaerobacterium saccharolyticum HG8 and strain A3 produced 6.30 and 5.43 mM g
xylan
-1
, respectively. Strain A3 was further investigated on hydrolysates made from wheat
straw, pretreated with wet oxidation. EtOH yields were lower as compared to xylan, or 2.61
mM g wheat straw
-1
pretreated without oxygen.
Thermoanerobacter mathranii was isolated in 1993 from Hveragerdi in Iceland (Larsen et al.,
1997) and has been adapted by Ahring et al., (1996). The strain has been investigated for
EtOH production capacity on wet oxidized wheat straw (Ahring et al., 1999). By using very
high substrate concentrations (60 g L
-1
) and wet oxidation with different amounts of sodium
carbonate the amount of total sugars released varied from 3.5 to 9.9 g L
-1
. A fermentation of
the strain on undiluted hydrolysate by the strain resulted in the production of
approximately 9 mM of EtOH, or 1.3 mM g sugar
-1
. This strain was also investigated for the
effects of inhibitory compounds and hydrolysate concentration on the fermentation of wheat
straw hydrolysates (Klinke et al., 2001). The main outcome was that the addition of
Ethanol and Hydrogen Production with
Thermophilic Bacteria from Sugars and Complex Biomass
371
hydrolysate to a medium containing 4 g L xylose
-1
did not inhibit EtOH production and it
produced 5.5 mM g xylose
-1
. Increased concentrations of aromatic compounds and
hydrolysates however, severely inhibited EtOH production by the strain. Wheat straw
hydrolysates have also been investigated by other thermophilic bacteria (Sommer et al.,
2004) but with lower EtOH yields.
Table 2. EtOH production from lignocellulosic biomass by defined and mixed cultures of
thermophilic bacteria. Cultivation was either in batch or continuous (con). EtOH yields
given in mM/g substrate degraded as well as substrate concentrations and incubation
temperature are also shown. * = sugar concentration, ** = 30 to 50% as hydrolysate.
Fermentation of beet molasses by three thermophilic Thermoanaerobacter species (T.
ethanolicus, Thermoanaerobacter sp. and T. thermohydrosulfuricus) were recently investigated
T. ethanolicus Wood hydrolysate Batch 8.0 3.30-4.50 70 Wiegel et al. (1983)
C. thermocellum (3 strains) Avicel Batch 20.0 1.40-2.60 60 Lamed et al. (1988)
C. thermocellum Avicel Batch 2.5 5.00 60 Lynd et al. (1989)
C. thermocellum Wood hydrolysate Batch 4.8 3.10 60 Lynd et al. (1989)
C. thermocellum Avicel Con 5.0 5.48 60 Ahn et al. (1996)
C. thermocellum Avicel Batch 5.0 3.66 60 Ahn et al. (1996)
C. thermocellum Whatman paper Batch 8.0 7.20-8.00 60 Rani et al. (1997)
C. thermocellum Avicel Batch 8.0 6.50-7.20 60 Rani et al. (1997)
C. thermocellum Paddy straw Batch 8.0 6.10-8.00 60 Rani et al. (1997)
C. thermocellum Sorghum stover Batch 8.0 4.80-8.10 60 Rani et al. (1997)
C. thermocellum Corn stubs Batch 8.0 4.60-7.80 60 Rani et al. (1997)
Thermophilic strain A3 Xylan Batch 10.0 5.43 70 Ahring et al. (1996)
T. saccharolyticum Xylan Batch 10.0 6.30 60 Ahring et al. (1996)
Thermophilic strain A3 Wheat straw Batch 60.0 (10.0)* 2.61 70 Ahring et al. (1996)
T. mathranii Wheat straw Batch 60.0 (6.7)* 2.61 70 Ahring et al. (1999)
T. mathranii Wheat straw Batch 60.0 5.30 70 Klinke et al. (2001)
Several Wheat straw Batch 30.0 0.30-0.50 70 Sommer et al. (2004)
Several Wheat straw Batch 60.0 0.20-0.40 70 Sommer et al. (2004)
C. thermocellum Filter paper/Corn steep liq. Batch 45.0/8.0 8.18 60 Balusu et al. (2005)
T. ethanolicus Beet molasses Batch 40.0 (19.5)* 4.81 65 Avci et al. (2006)
T. thermohydrosulfuricus 70-1 Beet molasses Batch 40.0 (19.5)* 2.95 65 Avci et al. (2006)
Thermoanaerobacter sp. 65-2 Beet molasses Batch 40.0 (19.5)* 7.25 65 Avci et al. (2006)
Thermoanaerobacter BG1L1 Corn stover Batch 25.0-150.0 8.50-9.20 70 Georgieva et al. (2007)
Thermoanaerobacter BG1L1 Wheat straw Batch 30.0-120.0 8.50-9.20 70 Georgieva et al. (2008)
Thermoanaerobacter BG1L1 Corn stover Con 25.0-150.0 8.50-9.20 70 Georgieva et al. (2008)
Clostridium thermocellum Avicel Batch 300-700** 0.70 60 Chinn et al. (2008)
T. ethanolicus Been card HL Batch 10.0 1.80 60 Miyazaki et al. (2008)
Clostridium sp. Been card HL Batch 10.0 0.85 60 Miyazaki et al. (2008)
Thermoanaerobacterium sp. Been card HL Batch 10.0 0.90 60 Miyazaki et al. (2008)
Thermoanaerobacterium AK17 Cellulose Batch 7.5 5.81 60 Sveinsdottir et al. (2009)
Thermoanaerobacterium AK17 Grass Batch 7.5 2.91 60 Sveinsdottir et al. (2009)
Thermoanaerobacterium AK17 Paper Batch 7.5 2.03 60 Sveinsdottir et al. (2009)
Mixed Napier grass Batch 2.0-40.0 0.70-0.90 60 Lin et al. (2010)
Mixed Avicel Batch 2.0-40.0 0.40-5.70 60 Lin et al. (2010)
C. thermocellum Napier grass Batch 2.0-40.0 0.80-3.90 60 Lin et al. (2010)
C. thermocellum Avicel Batch 10.0 0.70 60 Lin et al. (2010)
Mixed (C. thermocellum) Banana waste Batch 10.0-100.0 5.50-9.20 60 Harish et al. (2010)
Reference
Substr. conc.
(gL
-1
)
Organisms
Biomass
Cultivation
method
Ethanol yield
(mM g sugar
-1
)
Temp.
(°C)
Progress in Biomass and Bioenergy Production
372
(Avci et al., 2006). The concentration of sugars were 19.5 g L
-1
and and fermentation resulted
in yields between 3.0 (T. thermohydrosulfuricus) and 7.26 mM g
-1
(Thermoanaerobacter sp. ).
The highest reported EtOH yields reported from complex biomass are by Thermoanaerobacter
BG1L1 on corn stover and wheat straw (Georgieva & Ahring, 2007; Georgieva et al., 2008a).
The biomass was pretreated with acid or wet oxidation and EtOH yields were up to 9.2 mM
g
-1
for biomass hydrolysates.
Studies on Thermoanaerobacterium sp and Clostridium sp. on been curd refuse hydrolysates
were investigated by Miyazaki and co-workers (Miyazaki et al., 2008) with emphasis on
cooperation between aerobic cellulose degrading Geobacillus with the anaerobes.
EtOH yields in this study were relatively low, or between 0.72 to 1.80 mM g substrate
-1
.
Studies on EtOH production by Thermoanaerobacterium sp. AK17, isolated from Icelandic hot
spring, on various types of lignocellulosic biomass were reported recently (Sveinsdottir et
al., 2009). Batch culture studies on 7.5 g L
-1
of cellulose, grass and newspaper, pretreated
with heat and enzymes, showed EtOH yields of 2.0 (paper), 2.91 (grass) to 5.81 (cellulose)
mM/g biomass. Optimization experiments were recently done on this strain where EtOH
yields on grass and cellulose were increased to 4.0 and 8.6 mM g
-1
, respectively. The main
environmental factors concerning increasing EtOH yields were the use of acid/alkali for
pretreatment and by lowering the substrate concentration from 7.5 to 2.5 g L
-1
(unpublished
results).
6. Production of H
2
from thermophilic bacteria
H
2
production from various organic materials by fermentation has been known for a long
time. Firstly, the focus was mainly on facultative mesophilic bacteria within the genera of
e.g. Enterobacter, Citrobacter and strict anaerobes like the typical acetate/butyrate
fermentative Clostridia. There are numerous publications which focus on mesophilic bacteria
that will not be dealt with in this paper. It has not been until relatively recently that H
2
production by thermophiles has gained increased interest and in the past three years there
has been an explosion of number of publications within this field of research. Thermophilic
bacteria have many advantages as compared to mesophiles concerning H
2
production,
however, have remained less studied. High temperatures favor the stoichiometry of H
2
production resulting in higher H
2
yields compared to mesophilic systems (van Groenestijn
et al., 2002; van Niel et al., 2003). Furthermore, thermophilic fermentation results in less
variety of end products as compared to those of mesophilic fermentation (van Niel et al.,
2003). The discussion below is divided into production of H
2
from sugars and from other
biomass.
6.1 Production of H
2
from sugars
Pure cultures are, for the most part, used to study effects of environmental factors affecting
commercial H
2
production. Several studies on H
2
production on sugars, using pure
thermophilic cultures have been reported. The most common are dealing with bacteria
belonging to the genera of Thermoanaerobacterium, Caldicellulosiruptor and Thermotoga. Table 3
summarizes studies using pure cultures for H
2
production from sugars.
Thermotoga neopolitana was first described by Jannasch and co-workers (1988) but earliest
data of H
2
production is from 2002 where the bacterium produced 2.0 ml L
-1
h
-1
on glucose
in batch cultures (van Ootegehem et al., 2002). H
2
production capacity from glucose by this
species has since then been investigated in detail by others (Eriksen et al., 2008; d‘Ippolito et
Ethanol and Hydrogen Production with
Thermophilic Bacteria from Sugars and Complex Biomass
373
al., 2008; Nguyen et al., 2008, 2010; Munro et al., 2009) showing yields between 1.84 to 3.85
mol H
2
mol glucose
-1
. Xylose can also be used by the bacterium with good yields, or 2.20
mol H
2
mol xylose
-1
(Nguyen et al., 2010b). Most studies reported on H
2
production by T.
neopolitana have been conducted in batch experiments with relatively low sugar
concentrations (5 to 7 g L
-1
). The only experiment in continuous culture is reported by
d‘Ippolito et al., (2010) on glucose but very high yields were reported (3.85 mol H
2
mol
glucose
-1
). Other studies on species within the genus have been on T. elfii (van Niel et al.,
2002) and T. maritima (Nguyen et al., 2008; Schröder et al., 1994) with H
2
yields varying
from 1.67 to 4.00 (maximum) mol H
2
mol glucose
-1
.
Table 3. H
2
production from sugars by pure cultures of thermophilic bacteria. Cultivation
was either in batch or continuous (con). Volumetric H
2
production rates, H
2
yields as well as
substrate concentrations and incubation temperature are also shown.
Species belonging to genus Caldicellulosiruptor have been intensively investigated for H
2
production. C. saccharolyticus grown on sucrose showed good yields in continuous culture,
or 6.6 mol H
2
mol sucrose
-1
(= 3.3 mol H
2
mol hexose
-1
) (van Niel et al., 2002) and between
2.5 and 3.0 mol H
2
for one mole of xylose and glucose in batch (Kadar et al., 2004; Willquist
et al., 2009). Higher yields were observed in continuous culture, or 3.6 as well as high H
2
production rates (Vrije et al., 2007). Recently C. owensis has also been shown to be a good H
2
producer both in continuous culture with H
2
yields of 3.8 and 2.7 from glucose and xylose,
P. furiosus Maltose Con 0.22 5.5-22.0 2.90 98 Schicho et al. (1993)
T. maritima Glucose Batch 0.1 6.9 4.00 80 Schroder et al. (1994)
T. elfii Glucose Con 10.0 0.6 3.30 65 van Niel et al. (2002 )
C. saccharolyticus Sucrose Con 10.0 0.6 3.30 70 van Niel et al. (2002)
T. neapolitana Glucose Batch 5.0 0.6 N/A 70 Van Ooteghem et al. (2002)
T. tengcongensis Glucose Con 4.5 N/A 4.00 75 Soboh et al. (2004)
C. saccharolyticus Glucose Batch 1.7 N/A 2.50 70 Kadar et al. (2004)
C. saccharolyticus Xylose Batch 1.6 11.3 2.70 70 Kadar et al. (2004)
C. saccharolyticus Xyl/Glu Batch 1.0 9.2 2.40 70 Kadar et al. (2004)
C. saccharolyticus Glucose Con 4.0 2.5 3.60 70 Vrije et al. (2007)
T. thermosaccharolyticum sucrose Batch 20.0 3.0 2.53 60 O-Thong et al. (2008)
T. thermosaccharolyticum Glucose Batch 10.0 1.6 2.42 60 Ren et al. (2008)
T. thermosaccharolyticum Xylose Batch 10.0 1.6 2.19 60 Ren et al. (2008)
T. neapolitana Glucose Batch 5.0 N/A 2.40 80 Eriksen et al. (2008)
T. neapolitana Glucose Batch 7.5 N/A 1.84 80 Nguyen et al. (2008a)
T. maritima Glucose Batch 7.5 N/A 1.67 80 Nguyen et al. (2008a)
T. neapolitana Glucose Batch 2.5 0.1 3.85 77 Munro et al. (2009)
C. thermocellum Cellobiose Batch 1.1 N/A 1.73 60 Levin et al. (2006)
C. saccharolyticus Glucose Con 10.0 N/A 3.00 70 Willquist et al. (2009)
T. neapolitana Glucose Batch 7.0 N/A 3.24 77 Nguyen et al. (2010b)
T. neapolitana Xylose Batch 4.0 N/A 2.20 77 Nguyen et al. (2010b)
T. thermosaccharolyticum Xylose Batch 12.2 N/A 2.37 60 Cao et al. (2010)
T. neapolitana Glucose Con 5.0 6.3 3.85 80 d'Ippolito et al. (2010)
C. ownsensis Glucose Con 10.0 1.9 3.80 70 Zeidan & van Niel (2010)
C. ownsensis Xylose Con 10.0 1.4 2.70 70 Zeidan & van Niel (2010)
C. thermolacticum Lactose Batch 10.0 N/A 1.80 58 Collet et al. (2003)
Clostridium AK14 Glucose Batch 3.6 N/A 2.21 50 Almarsdottir et al. (2010)
Clostridium AK14 Xylose Batch 3.0 N/A 2.55 50 Almarsdottir et al. (2010)
Organisms
Substrate
Reference
Temp.
(°C)
Cultivation
method
Biomass conc.
(g L
-1
)
Volumetric H
2
productivity (mL
L
-1
h
-1
)
H
2
yield
(mol H
2
mol
glu
-1
equiv.)