Six Sigma Projects and Personal Experiences Part 2 pdf
Bạn đang xem bản rút gọn của tài liệu. Xem và tải ngay bản đầy đủ của tài liệu tại đây (539.16 KB, 15 trang )
Six Sigma Projects and Personal Experiences
6
4. Why six sigma?
4.1 Does 99.9% yield is good enough for an organization?
With 99.9 % yield, we say the organization operates at 4 to 5 Sigma level. Taking into
account some real world examples, with 99.9 % yield, we come across the following example
scenarios which are surely unacceptable in customer’s point of view :
Unsafe drinking water almost 15 minutes each day
5400 arterial by pass failures each year
Visas issued to 50 dangerous persons each year
By moving to Six Sigma level with 99.9997% yield, significant improvements have taken
place resulting in very high quality with almost nil defects and very good customer
satisfaction as shown below :
Unsafe drinking water only few seconds a day
18 arterial bypass failures
No visas issued to dangerous persons
The following real world examples explain the importance and need for achieving six sigma
level quality.
Comparison of performace improvement with 99.9% and 99.9997 acceptence
Scenarios
99.9% acceptance
(Sigma Level : 4 to
5 Sigma)
99.9997 % acceptance
(Sigma Level : 6
Sigma)
Arterial bypass failures in an year 5400 18
Commercial aircraft take off
aborted each year
31,536 107
Train wrecks a year 180 < 1
Visa issued to dangerous persons 50 none
Table 2. Comparison of performance improvement at different sigma levels
5. Lean
5.1 Lean thinking
Lean Thinking was an another quality and productivity improvement methodology
introduced in Toyota Production Systems (TPS) which is based on the concept of
elimination of waste in processes which had resulted in productivity gain and improvement of
speed and flow in the value stream. The principle of Lean can be stated as a relentless pursuit
of the perfect process through wastage elimination in the value stream. Lean identifies three
different kinds of wastes, using Japanese terminology from the Toyota Production System
where lean originated: muda (waste of time and materials), mura (unevenness/variation),
and muri (the overburdening of workers or systems).
Every employee in a lean manufacturing environment is expected to think critically about
his or her job and make suggestions to eliminate waste and to participate in kaizen, a process
of continuous improvement involving brainstorming sessions to fix problems.
5.2 Lean in a nutshell
Lean is a business transformation methodology and it is derived from the Toyota
Production System (TPS). Within the Lean methodology, there is a relentless focus on
Lean Six Sigma
7
increasing customer value by reducing the cycle time of product or service delivery through
the elimination of all forms of muda (a Japanese term for waste) and mura (a Japanese term
unevenness in the workflow).
5.3 Six sigma in a nutshell
Six Sigma was a concept developed in 1985 by Bill Smith of Motorola, who is known as “ the
Father of Six Sigma.” This concept contributed directly to Motorola’s winning of the U.S.
Malcolm Baldrige National Quality Award in 1988. Six Sigma is a business transformation
methodology that maximizes profits and delivers value to customers by focusing on the
reduction of variation and elimination of defects by using various statistical, data-based
tools and techniques.
5.4 Six sigma vs lean
Both methodologies focus on business processes and process metrics while striving to
increase customer satisfaction by providing quality, on time products and services. Lean
takes a more holistic view. It uses tools such as value-stream mapping, balancing of
workflow, or kanban pull signaling systems to trigger work, streamline and improve the
efficiency of processes, and increase the speed of delivery.
Six Sigma takes a more data-based and analytical approach by using tools to deliver error-
free products and services, such as the following examples:
Voice Of the Customer (VOC)
Measurement Systems Analysis (MSA)
Statistical hypothesis testing
Design of Experiments (DoE)
Failure Modes and Effects Analysis (FMEA)
Six Sigma uses an iterative five-phase method to improve existing processes. This method is
known as Define, Measure, Analyze, Improve, Control (DMAIC), and normally underpins Lean
Six Sigma (LSS).
Fig. 4. Lean vs Six Sigma
Six Sigma Projects and Personal Experiences
8
Over the last 10 to 15 years, an increased need for accelerating the rate of improvement for
existing processes, products, and services has led to a combination of these two approaches.
As shown in Fig. 4, Lean Six Sigma combines the speed and efficiency of Lean with the
effectiveness
of Six Sigma to deliver a much faster transformation of the business.
6. Lean six sigma
Lean Six Sigma came into existence which is the combination of Lean and Six Sigma.
The fusion of Lean and Six Sigma is required because :
Lean cannot bring process under statistical control, and
Six Sigma alone cannot dramatically improve process speed or reduce invested
capital.
Lean Six Sigma is a disciplined methodlogy which is rigorous, data driven, result-oriented
approach to process improvement. It combines two industry recognized methodologies
evolved at Motorola, GE, Toyata, and Xerox to name a few. By integrating tools and
processes of Lean and Six Sigma, we’re creating a powerful engine for improving quality,
efficiency, and speed in every aspect of business.
Cindy Jutras,Vice President, Research Fellow and Group Director Enterprise Applications
Aberdeen Group says ,” Lean and Six Sigma are initiatives that were born from the pursuit of
operational excellence within manufacturing companies. While Lean serves to eliminate
waste, Six Sigma reduces process variability in striving for perfection. When combined, the
result is a methodology that serves to improve processes, eliminate product or process
defects and to reduce cycle times and accelerate processes”.
Embedding a rigourous methodology like lean six sigma into organizational culture is not a
short journey, but it is a deep commitment not only to near-term results but also a long-
term, continuous, even break-through results.
7. Six sigma DMAIC methodology
Motorola developed a five phase approach called ‘DMAIC Model’ to achieve the highest
level in the Six Sigma, i.e., 3.4 defects per million. The five phases are:
Define process goals in terms of key critical parameters (i.e. critical to quality or critical
to production) on the basis of customer requirements or Voice Of Customer (VOC)
Measure the current process performance in context of goals
Analyze the current scenario in terms of causes of variations and defects
Improve the process by systematically reducing variation and eliminating defects
Control future performance of the process
Table 3 lists the important deliverables and tools used in each step of ‘DMAIC Model’. The
subsequent sections brief the process involved in each phase.
7.1 Define
In the Define phase of the project, the focus is on defining the current state by making the
Problem statement which specifies what the team wants to improve upon which illustrates
the need for the project and potential benefit. The type of things that are determined in this
phase include the Scope of the project, the Project Charter.
Lean Six Sigma
9
7.1.1 Project charter
The problem statement and goal statement are the part of Project Charter. The following
deliverables should be part of the project charter :
Business Case (Financial Impact)
Problem statement
Project Scope (Boundaries)
Goal Statement
Role of team members
Mile Stones/deliverables (end products of the project)
Resources requiered
Strategic
Steps
Deliverables Tools used
Define Project Charter or Statement of
Work(SoW)
Gantt Chart/Time Line
Flow Chart/Process Map
Quality Function Deployment (QFD)
Measure Base Line figures SIPOC (Suppliers, Inputs, Process,
Outputs, and Customers ) or IPO (Input-
Process-Output) diagram
Analyze Identified Root Causes Cause-and-Effect Diagram
5-Why
Scatter Diagram
Regression
ANOVA
Improve Selected root causes and counter
measures
Improvement Implementation Plan
Affinity Diagram
Hypothesis Testing
DoE
Failure Mode Effect Analysis (FMEA)
Control Control Plan
Charts & Monitor
Standard Operating Procedures
(SOP)
Corrective Actions
Control Charts
Poka-Yokes
Standardization
Documentation
Final Report
Presentation
Table 3. DMAIC Methodology
The metrics to be used are developed at this phase. The basic metrics are cycle time, cost,
value, and labor. Some of the methods used for identifying the metrics are Pareto diagram,
SIPOC, voice of the customer, affinity diagram, critical to quality tree.
SIPOC stands for Suppliers, Inputs, Process, Outputs, and Customers. This approach helps
us to identify characteristics that are key to the process which in term facilitates identifying
appropriate metrics to be used to effect improvement.
To create a SIPOC diagram:
Identify key process activities
Identify outputs of the process and known customers
Identify inputs to the process and likely suppliers
Six Sigma Projects and Personal Experiences
10
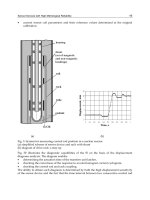
Fig. 5 shows an example SIPOC Diagram of Husband making wife a cup of tea. A SIPOC
diagram is a tool that is used to gather a snapshot view of process information. SIPOC
diagrams are very useful at the start of a project to provide information to the project team
before work commences.
An IPO (Input-Process-Output) diagram is a visual representation of a process or activity as
shown in Table 4. It lists input variables and output characteristics. It is useful in defining a
process and recognizing the input variables and responses or outputs. It helps us to
understand what inputs are needed to achieve each specific output.
Input Process Output
Centigrade Prompt for centigrade value fahrenheit
Compute fahrenheit value
Table. 4 An IPO diagram
Fig. 5. SIPOC Diagram
7.2 Measure
The Measure is the second step of the Six Sigma methodology. A base line measure is taken
using actual data. This measure becomes the origin from which the team can guage
improvement.
It is within the Measure phase that a project begin to take shape and much of the hands-on
activity is performed. The goal of Measure phase is to establish a clear understanding of the
current state of the process you want to improve. For example, a medical practioner
prescribes various tests like blood test, ECG test etc for a patient admitted in a hospital. The
test reports of various laboratorical tests reflect the current state of health of the patient.
Similarly, a Six Sigma practioner, determines current state of health of the system under
consideration in this phase.
The deliverables in this phase are refined process map, and refined Project Charter. Some of
the tools used in Measure phase are :
Flow Charts
Lean Six Sigma
11
Fish bone diagrams
Descriptive Statistics
Scatter diagrams
Stem and Leaf plots
Histograms
These metrics will establish the base line of the current state. The outcome of applying these
tools in the form of charts, graphs or plots helps the Six Sigma Practitioner to understand
how the data is distributed. He or she is able to know what the data are doing. The
distribution that is associated with data related to a process speaks volumes. The data
distribution can be categorized into:
Normal distribution
Weibul
Poison
Hypergeometric
Chi Square
The data can be continuous or discrete.
7.3 Analyze
In this step, the team identify several possible causes (X’s) of variation or defects that are
affecting the outputs (Y’s) of the process. One of the most frequently used tools in the
analyze phase is the ‘Cause and Effect Diagram’. The Cause & Effect Diagram is a technique
to graphically identify and organize many possible causes of a problem (effect). They help
identify the most likely ROOT CAUSES of a problem. This tool can help focus problem
solving and reduce subjective decision making. Fig. 6 illustrates a cause and effect diagram
which helps to find out possible causes for software not being reliable. Root cause is the
number one team deliverable coming out of the analysis step. Causes can be validated
usingnew or existing data and applicable statistical tools such as scatter plots, hypotheses
testing, ANOVA, regression or Design of Experiments. Some of the tools used in root cause
analysis are shown in Fig. 7.
Fig. 6. Cause and Effect Diagram
Six Sigma Projects and Personal Experiences
12
Fig. 7. Tools used in Root cause analysis
7.4 Improve
In this step, the team would brainstorm to come up with counter measures and lasting
process improvements that address the validated root causes. The most preferred tool used
in this phase is affinity diagram.
We have measured our data and performed some analysis on the data to know where our
process is, it is time to improve it.
One of the important methods used for improvement of a process is Design of Experiments
(DoE).
7.4.1 Affinity diagram
A pool of ideas, generated from a brainstorming session, needs to be analyzed, prioritized
before they can be implemented. A smaller set of ideas are easy to sift through and evaluate
without applying any formal technique. Affinity diagramming is an effective technique to
handle a large number of ideas. It is typically used when
1. Large data set is to be traversed, like ideas generated from brainstorming and sieve for
prioritization.
2. Complexity due to diverse views and opinions.
3. Group involvement and consensus. The process of affinity diagramming requires the
team to categorize the ideas based on their subject knowledge thereby making it easy to
sift and prioritize ideas. Fig. 8 shows an example affinity diagram with prioritized ideas
categorized into different headings.
Lean Six Sigma
13
7.4.2 Design of experiments (DoE)
With DoE, you look at multiple levels of multiple factors simultaneously and make
decisions as to what levels of the factor will optimize your output.
A statistics-based approach to designed experiments
A methodology to achieve a predictive knowledge of a complex, multi-variable process
with the fewest trials possible
An optimization of the experimental process itself
7.5 Control
In this step, our process has been measured, our data analyzed, and our process improved.
The improvement we have made will be sustained. We need to build an appropriate level of
control so that it does not enter into an undesirable state. One of the important tool that can
be used to achieve this objective is Statistical Process Control (SPC). The purpose of SPC is
to provide the practitioner with real-time feedback which indicates whether a process is
under control or not.
There are also some lean tools like the 5S’s, the Kaizen blitz, kanban, poka-yoke etc.
Fig. 8. Affinity Diagram
Six
Si
g
ma
Tools
Advanced
Tools
Pareto
Anal
y
sis
Flow Process Chart
Upper Control Limit (UCL) /
Lower Control Limit (LCL) Control
Chart
Cause and Effect Diagram
Input-Process-Output Diagrams
Brain Storming
Scatter Diagram
Histogram
The Seven Wastes
The
Five
Ss
Failure
Mode
Effect
Anal
y
sis
(FMEA)
Design of Experiments (DoE)
Design For Six Sigma (DFSS)
Table 5. Six Sigma Tools
Six Sigma Projects and Personal Experiences
14
8. Six sigma and lean tools
Table 5. summarizes some of the important Six Sigma tools used for easy reference. Pareto
analysis, Control charts and Failure Mode Effect Analysis are explained in detail with
examples.
8.1 Pareto Analysis
Pareto Analysis is a statistical technique in decision making that is used for the selection of a
limited number of tasks that produce significant overall effect. It uses the Pareto Principle
(also know as the 80/20 rule) the idea that a large majority of problems (80%) are produced
by a few key causes (20%). This is also known as the vital few and the trivial many.The
80/20 rule can be applied to almost anything:
80% of customer complaints arise from 20% of your products or services.
80% of delays in schedule arise from 20% of the possible causes of the delays.
20% of your products or services account for 80% of your profit.
20% of your sales-force produces 80% of your company revenues.
20% of a systems defects cause 80% of its problems.
Fig. 9. Pareto diagram
The Pareto Principle has many applications in quality control. It is the basis for the Pareto
diagram, one of the key tools used in total quality control and Six Sigma. Seven steps to
identifying the important causes using Pareto Analysis :
1. Form a table listing the causes and their frequency as a percentage.
2. Arrange the rows in the decreasing order of importance of the causes, i.e. the most
important cause first.
3. Add a cumulative percentage column to the table.
4. Plot with causes on x-axis and cumulative percentage on y-axis.
5. Join the above points to form a curve.
6. Plot (on the same graph) a bar graph with causes on x-axis and percent frequency on y-
axis.
7. Draw a line at 80% on y-axis parallel to x-axis. Then drop the line at the point of
intersection with the curve on x-axis. This point on the x-axis separates the important
causes on the left and less important causes on the right.
Lean Six Sigma
15
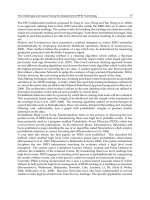
8.2 Control charts
A control chart is a statistical tool used to distinguish between variation in a process
resulting from common causes and variation resulting from special causes. It presents a
graphic display of process stability or instability over time as shown in Fig. 10. Every
process has variation. Some variation may be the result of causes which are not normally
present in the process. This could be special cause variation. Some variation is simply the
result of numerous, ever-present differences in the process. This is common cause variation.
Control Charts differentiate between these two types of variation. One goal of using a
Control Chart is to achieve and maintain process stability.
Process stability is defined as a state in which a process has displayed a certain degree of
consistency in the past and is expected to continue to do so in the future. This consistency is
characterized by a stream of data falling within control limits based on plus or minus 3
standard deviations (3 sigma) of the centerline.
A stable process is one that is consistent over time with respect to the center and the spread
of the data. Control Charts help you monitor the behavior of your process to determine
whether it is stable. Like Run Charts, they display data in the time sequence in which they
occurred. However, Control Charts are more efficient that Run Charts in assessing and
achieving process stability. Your team will benefit from using a Control Chart when you
want to monitor process variation over time.
1. Differentiate between special cause and common cause variation.
2. Assess the effectiveness of changes to improve a process.
3. Communicate how a process performed during a specific period.
Fig. 10. Control Charts
8.3 Failure mode and effects analysis (FMEA)
Failure Mode and Effects Analysis (FMEA) is a model used to prioritize potential defects
based on their severity, expected frequency, and likelihood of detection. An FMEA can be
performed on a design or a process, and is used to prompt actions to improve design or
process robustness. The FMEA highlights weaknesses in the current design or process in
terms of the customer, and is an excellent vehicle to prioritize and organize continuous
improvement efforts on areas which offer the greatest return.
The next step is to assign a value on a 1-10 scale for the severity, probability of occurrence,
and probability of detection for each of the potential failure modes. After assigning a value,
the three numbers for each failure mode are multiplied together to yield a Risk Priority
Number (RPN). The RPN becomes a priority value to rank the failure modes, with the
highest number demanding the most urgent improvement activity. Error-proofing, or poka-
yoke actions are often an effective response to high RPN's.
Following is an example of a simplified FMEA for a seat belt installation process at an
automobile assembly plant.
Six Sigma Projects and Personal Experiences
16
Fig. 11. FMEA
As you can see, three potential failure modes have been identified. Failure mode number
two has an RPN of 144, and is therefore the highest priority for process improvement.
FMEA's are often completed as part of a new product launch process.
RPN minimum targets may be established to ensure a given level of process capability before
shipping product to customers. In that event, it is wise to establish guidelines for assessing the
values for Severity, Occurrence, and Detection to make the RPN as objective as possible.
9. Case studies on lean six sigma
Having seen Six Sigma Methodology and Lean Six Sigma tools elaborately, it is appropriate
to look into some case studies on Six Sigma implementations. We present two case studies
on Six Sigma implementation by two leading companies in this section. These studies
reinforce Lean and Six Sigma Concepts as well as demonstrate the the tools used by them
for implementing the same. The importance of achieving operational excellence by way of
reducing defects and variations in processes as well as eliminations of non value adding
steps in processes can be inferred from these case studies . One more case study on
“Mumbai Dabba walahs” also presented at the end of the chapter to clearly demonstrate
that Six Sigma is a tool not only for coporates but also it is for common man who are capable
of achieving Six Sigma level in their services in execution of their daily tasks by fulfilling
their customer needs.
9.1 Honeywell aerospace electronics system, singapore – implementing six sigma
quality
Honeywell is a US$ 254 billion diversified technology and manufacturing leader, serving
customers worldwide with aerospace products and services One of its business units,
Aerospace Electronics System in Singapore, uses Six Sigma as a best practice to improve
processes in most of its operations. The organisation, which has 150 employees, was set up
in Singapore in 1983. It manufactures high quality avionics and navigation equipment and
systems. Its principal customers include Cessna, Bell Helicopters, Raytheon, Learjet,
Mooney Aircraft, Piper Aircraft, FedEx and Singapore Aerospace.
Lean Six Sigma
17
Six Sigma Plus is Honeywell's overall strategy to accelerate improvement in all processes,
products and services, and to reduce the cost of poor quality by eliminating waste and
reducing defects and variations. Six Sigma is already understood worldwide as a measure of
excellence. The "Plus" is derived from Honeywell's Quality Value assessment process and
expanded former AlliedSignal's Six Sigma strategic tools.
The strategy requires that the organisation approach every improvement project with the
same logical method of DMAIC:
Define the customer critical parameters
Measure how the process performs
Analyse causes of problems
Improve the process to reduce defects and variations
Control the process to ensure continued, improved performance
9.1.1 Implementing six sigma plus
The tools and skills that help in the implementation of the DMAIC method include:
Process mapping which helps to identify the order of events in producing a product or
service and compares the "ideal" work flow to what actually happens.
Failure mode and effect analysis which helps to identify likely process failures and
minimises their frequency.
Measurement system evaluation which helps in the assessment of measurement
instruments to enable the better separation of important process variations from
measurement "noise".
Statistical tests which assist in the separation of significant effects of variable from
random variation.
Design of experiments which is used to identify and confirm cause and effect
relationships.
Control plans which allow for the monitoring and controlling of processes to maintain
the gains that have been made.
Quality function deployment which is a tool for defining what is important to
customers; it enables better anticipation and understanding of customer needs.
Activity based management to look at product and process costs in a comprehensive
and realistic way by examining the activities that create the costs in the first place and
hence allowing for better subsequent management.
Enterprise resource planning which uses special computer software to integrate,
accelerate and sustain seamless process improvements throughout an organisation.
Lean enterprise with skills to enhance the understanding of actions essential to
achieving customer satisfaction. These skills simplify and improve work flow, help
eliminate unnecessary tasks and reduce waste throughout a process.
9.1.2 Impact of six sigma plus
In the past, generic and low-end competencies such as the manufacture of printed circuit
boards were outsourced. With Six Sigma Plus, core competencies were redefined and control
plans established.
Presently, Aerospace Electronics System, Singapore focuses on core competencies that are
unique to itself, such as final assembly and test and final alignment. This helped to stabilise
the workforce for the organisation, which once experienced high turnover for its front-end
and low-skill jobs. Waste has also been reduced from key business processes. For example,
Six Sigma Projects and Personal Experiences
18
inspection, which is considered as non-value added, has been eliminated. Instead, Reliance
on Operators' Inspection (ROI) is practised and this has helped to increase the value added
per employee.
In the past, all Honeywell Singapore's products were 100% inspected by a team from the US.
Currently, the Federal Aviation Agency (FAA) certifies its products for manufacturing in
Singapore; and 100% of its products are shipped direct to stock to Kansas, US, saving $1
million in inspection cost. In addition, audits by FAA involve only observations and not all
processes need to be audited. This is achieved by ensuring that the necessary quality
procedures are built into the process. Six Sigma Plus in Honeywell has led to the following
results:
Increased Rolled Throughput Yield (RTY)
Reduced variations in all processes
Reduced cost of poor quality (COPQ)
Deployment of skilled resources as change agents.
9.1.3 Key learning points
Some of the key learning points are:
Strong management commitment and support.
Well-structured approach and deployment process
Team-based approach.
Sharing Six Sigma Plus knowledge.
9.2 Lean six sigma in higher education: applying proven methodologies to improve
quality, remove waste, and quantity opportunities in college and universities
9.2.1 Lean flow today
This is another case study which highlights the experiences of Ms Xerox Corporation in
implementing Six Sigma in higher education. The case study starts with discussion on the
importance of Lean Principles and then elaborately discuss Six Sigma implementation
strategies. While Lean Flow began as a manufacturing model, today’s definition has been
extended to include the process of creating an “optimized flow” anywhere in an
organization. The only requirement is that this “flow” challenge current business practices
to create a faster, cheaper, less variable, and error prone process. Lean Flow experts have
found that the greatest success can be achieved by methodically seeking out inefficiencies
and replacing them with “leaner”, more streamlined processes. Sources of waste commonly
plaguing most business processes include:
Waste of worker movement (unneeded steps)
Waste of making defective products
Waste of over production
Waste in transportation
Waste of processing
Waste of time (idle)
Waste of stock on hand
9.2.2 Putting lean flow to work
Implementing a Lean Flow requires having the right data and knowing how to use it. There
are a number of different approaches taken by organizations, but fundamentally, Lean Flow
is achieved by:
Lean Six Sigma
19
Analyzing the steps of a process and determining which steps add value and which do
not.
Calculating the costs associated with removing non-value-added steps and comparing
those costs versus expected benefits.
Determining the resources required to support
9.2.3 Six sigma today
While the concept of Six Sigma began in the manufacturing arena decades ago, the idea that
organizations can improve quality levels and work “defect-free” is currently being
incorporated by higher education institutions of all types and sizes. So what is today’s
definition of Six Sigma? It depends on whom you ask. In his book Six Sigma: SPC and TQM
in Manufacturing and Services, Geoff Tennant explains that "Six Sigma is many things… a
vision; a philosophy; a symbol; a metric; a goal; a methodology.” Naturally, as Six Sigma
permeates into today’s complex, sophisticated higher education landscape, the methodology
is “tweaked” to satisfy unique needs of individual schools. But no matter how it is
deployed, there is an overall framework that drives Six Sigma toward improving
performance. Common Six Sigma traits include:
A process of improving quality by gathering data, understanding and controlling
variation, and improving predictability of a school’s business processes.
A formalized Define, Measure, Analyze, Improve, Control (DMAIC) process that is the
blueprint for Six Sigma improvements.
A strong emphasis on value. Six Sigma projects focus on high return areas where the
greatest benefits can be gained.
Internal cultural change, beginning with support from administrators and champions.
value-added steps while eliminating non-value added steps.
Taking action.
Lean Six Sigma is the application of lean techniques to increase speed and reduce waste,
while employing Six Sigma processes to improve quality and focus on the Voice of the
Customer. Lean Six Sigma means doing things right the first time, only doing the things that
generate value, and doing it all quickly and efficiently.
Xerox Global Services imaging and repository services leverage the Lean Six Sigma-based
DMAIC approach:
Define
The Define phase of the DMAIC process is often skipped or short-changed, but is vital to the
overall success of any Lean Six Sigma project. This is the phase where the current state,
problem statement, and desired future state are determined and documented via the Project
Charter. Xerox asks questions like: What problem are we trying to solve? What are the expected
results if we solve the problem? How will we know if the problem is solved? How will success be
measured? In most cases where imaging and repository services are involved, the problem
relates to document management and access. Schools look to improve the ways documents
are created, stored, accessed, and shared so they may accelerate and enhance work
processes, share information more conveniently, and collaborate more effectively. As the
project progresses and more information is collected in future phases, the problem
statement developed in the Define phase is refined.
Measure
The Measure phase is where Xerox gathers quantitative and qualitative data to get a clear
view of the current state. This serves as a baseline to evaluate potential solutions and
Six Sigma Projects and Personal Experiences
20
typically involves interviews with process owners, mapping of key business processes, and
gathering data relating to current performance (time, volume, frequency, impact, etc.).
Analyze
In the Analyze phase, Xerox studies the information gathered in the Measure phase,
pinpoints bottlenecks, and identifies improvement opportunities where non-value-add tasks
can be removed. A business case is conducted, which takes into account not only hard costs
but also intangible benefits that can be gained, such as user productivity and satisfaction, to
determine if the improvement is cost-effective and worthwhile. Finally, the Analyze phase is
when technological recommendations are provided.
Improve
The Improve phase is when recommended solutions are implemented. A project plan is
developed and put into action, beginning with a pilot program and culminating in full-scale,
enterprise-wide deployment. Where appropriate, new technology is implemented,
workflows are streamlined, paper-based processes are eliminated, and consulting services
are initiated. Key factors of success during this phase are acceptance by end users and
enterprise-wide change without any degradation of current productivity levels.
Control
Once a solution is implemented, the next step is to place the necessary “controls” to assure
improvements are maintained long-term. This involves monitoring—and in many cases,
publicizing—the key process metrics to promote continuous improvement and to guard
against regression. In many cases, Xerox will revisit the implementation after 3-6 months to
review key metrics and evaluate if the initial progress has been sustained. A common
practice is to put key metrics, including hard cost savings and achievement of pre-defined
Service Level Agreements, in full view “on the dashboard” to provide continuous feedback
to the organization and so decision-makers can assess the project’s level of success as it
moves forward.
9.3 Dabbawalas and six sigma
A Six Sigma practioner need not be an educated individual. One interesting case study
quoted for Six Sigma application is dabbawalas of Mumbai, India. Dabbawallas (also known
as Tiffinwallahs) are persons employed in a service industry in Mumbai whose primary job
is collecting the freshly cooked food in lunch boxes from the residences of office workers
(mostly in the suburbs), delivering it to their respective work places and returning the
empty boxes to the customer’s residence by using various modes of transport. Around 5000
dabbawalas in Mumbai transport around 200,000 lunch boxes every day. The reliability of
their services meet Six Sigma standard as per study by Forbes Magazine in the year 2002. It
has been found that they make less than one mistake in every 6 million deliveries. The tiffin
boxes are correctly delivered to their respective destinations as the dabbawalls use an
unique identifying coding scheme inscribed on the top of each tiffin box.
10. Conclusion
Six Sigma was a concept developed in 1985 by Bill Smith of Motorola.
Six Sigma is a business transformation methodology that maximizes profits and delivers
value to customers by focusing on the reduction of variation and elimination of defects by
using various statistical, data-based tools and techniques.