Six Sigma Projects and Personal Experiences Part 5 pdf
Bạn đang xem bản rút gọn của tài liệu. Xem và tải ngay bản đầy đủ của tài liệu tại đây (255.68 KB, 15 trang )
Quality Function Deployment in Continuous Improvement
51
Understanding Customer Choice Decisions: The Voice of the Customer
One of the essential strategies for successful functioning of any organization is delivering
superior service or product quality to their customers. Understanding what exactly the
customer’s needs and wants (voice of the customer) are is a key criterion in total quality
management (Griffin and Hauser, 1991). The first step towards understanding customer
needs is to identify attributes and customer consequences. Attributes are defined as the
physical or abstract characteristics of a service or product. They are objective, measurable,
and reflect the provider’s perspective. Consequences are a result of using attributes;
basically, an end result in what a customer “gets” from using a service or product.
Customers judge services and products based on their consequences, not their attributes. In
other words, customers judge a service or product on its outcome, or affect of use on them.
A service or product has many attributes, and each may have more than one consequence
(Fisher and Schutta, 2003).
To gather the VOC, a cross-functional team must conduct focus groups or interviews with a
select group of potential, existing, or past customers and ask them what is important to
them in the service or product being offered. “Why” is asked numerous times until the
respondent responds with the same answer each time. This is the fundamental customer
consequence that the customer wants from using the service or product. These responses are
grouped using an affinity diagram and used to develop a meaningful survey questionnaire
that captures all things important to the customers. To ensure that the appropriate number
of responses is gathered (90%), a standard sample size calculation can be performed.
Development of Customer Consequences
During the survey, the respondents are asked to evaluate the particular product or service
provider on each customer consequence on a standard 5 point Likert scale. The respondent
is also asked to weight each consequence on how important it is to them on a 5 point Likert
scale. These ratings and weightings will be multiplied to derive a weighted rating to
encompass both the performance rating and the importance for each consequence. With this
information, the team can determine which of the consequences are the most important and
also the worst in performance and assign priorities.
If respondents for other similar types of products or services are available, the same survey
can gather data regarding customer consequences for those competitors. If respondents are
not available, the team will use available data (i.e., website published information, annual
reports, technical reports, financial statements) to determine which competitor being
evaluated is “best” and assign it a value of “5”. The team will also identify which competitor
is “worst” at each consequence and sign them a value of “1”. All competitors will be
assigned a value relative to “best” and “worst” using team or industry expertise in the
subject area. This information will be used to “benchmark” the product or service being
directly evaluated by the team to see how they compare to similar competitors.
Development of Technical Requirements
After the customer consequences are analyzed, the next step in the construction of the HOQ
is the development of the technical requirements. The technical requirements are the design
specifications that satisfy customer consequences. These technical requirements are on the
top of the HOQ and are referred to as the “how” of the HOQ. They describe “how” to meet
the customer consequences and improve a product or service. The technical requirements
must be within the control of the product or service provider and must be measurable (i.e.,
Six Sigma Projects and Personal Experiences
52
quantitative measurements, “yes/no”). Each customer consequence can have more than one
technical requirement, and each technical requirement may fulfill the need of more than one
customer consequence.
The development of technical requirements often requires expertise in the area regarding
the service or product and requires creativity to develop. This area of the HOQ is the
“thinking outside the box” aspect and there is no definite “right or wrong” answer. Any
reasonable technical requirement should be considered. Often times ambiguous research
and information collected from many sources (i.e., experts, websites, technical reports) may
be used to spark brainstorming and creativity to develop technical requirements.
Relationship Matrix: The Body of the House of Quality
Once the customer consequences are developed, survey results are gathered, and the
technical requirements are developed, a matrix to highlight relationships between the
customer consequences and the technical requirements is constructed. This matrix is the
“body” of the House of Quality. The matrix defines the correlations between the customer
consequences and technical requirements as strong, moderate, or weak using a 9-3-1 scale.
For this scale the following notations are used Strong (H) = 9, Moderate (M) = 3, and Weak
(S) = 1. Each customer consequence is matched with any applicable technical requirement;
make note that relationships should not be forced, leaving a blank if no relationship is
determined. Here again, this assignment of relationships requires the expertise of the
researchers or industry members. Normally only the strongest relationships are specified
leaving approximately 60-70% of the matrix blank (Griffin and Hauser, 1991). Although
some indicate that ideally in the QFD analysis, no more than 50% of the relationship matrix
should be filled, and a random pattern should result (Fisher and Schutta, 2003). This matrix
identifies the technical requirements that satisfy most customer consequences. The technical
requirements that address the most customer consequences should be a main priority in the
design process to ensure a product or service that satisfies the stated customer expectations.
Planning Matrix (Customer Competitive Analysis)
After the completion of the relationship matrix, the focus of the analysis shifts to the
construction of the planning matrix. The planning matrix defines how each customer
consequence has been addressed by the competition. It provides market data, facilitates
strategic goal setting for the new product, and permits comparison of the customer desires
and needs. It also compares the service to its key competitors. For the competitive analysis,
research should be conducted regarding similar products or services. Researchers may have
to assert a level of expertise in drawing meaningful information from the information
available, as many competitors will not openly aid their competition by providing market
data and design specifications. The researchers will use available data (i.e., website
published information, annual reports, technical reports, financial statements) to determine
which competitor being evaluated is “best” and assign it a value of “5”. The researchers will
also identify which competitor is “worst” at each consequence and sign them a value of “1”.
All competitors will be assigned a value relative to “best” and “worst” using researcher or
industry expertise in the subject area. This information will be used to “benchmark” the
product or service being directly evaluated by the researcher to see how they compare to
similar competitors.
Technical Correlations
Following the completion of the relationship and planning matrices, the technical
correlations are determined. These correlations are depicted in the roof of the HOQ. The
Quality Function Deployment in Continuous Improvement
53
roof maps the relationships and interdependencies among the technical requirements. The
analysis of which informs the development process, revealing the existence and nature of
service or product design bottlenecks. The relationships among technical requirements are
plotted and given a value. Relationships among the technical requirements are important to
evaluate, as one technical requirement could either aid or hinder the success of another
crucial technical requirement in meeting customer consequences. Past experience and
publicly available data (i.e., website information, technical reports, financial reports) can be
used to complete the roof of the HOQ. Symbols are used to represent the strength of the
relationship between the technical requirements and are assigned by the team.
Technical Matrix
The last step in the formation of the HOQ is the foundation or bottom of the house. This
foundation is referred to as the technical matrix. This matrix depicts the values assigned by
the team of the direction of improvement and/or standard values of each technical
requirement needed to be competitive in the industry. Often times, if a numerical value
cannot be absolutely determined, the team and/or industry experts use judgment based on
expertise in the subject area to assign “targets.” The direction of improvement indicates the
type of action needed to ensure that the technical requirements are sufficient to make the
product or service competitive for each entity evaluated. For example, if a technical
requirement’s target value is 5, and a product or service provider’s mean for that
requirement is 4, the direction of improvement would be up to aim for the higher target
value.
Prioritizing Resource Allocations: The Importance/Performance Grid
The collected information from the above methods enables the development of strategic
decisions, one of which is the allocation of resources. An importance-performance grid can
be developed to prioritize the usage of resources to improve the most critical customer
benefits. The mean importance ratings (gathered from the survey) can be plotted on the
vertical axis (importance) and the mean customer competitive ratings (gathered from the
survey) on the horizontal axis (performance). Using the importance rating values, the mean
importance rating (for all consequences) should be calculated. The consequences with an
importance rating higher than that of the mean importance rating should be placed above
the horizontal line and those lower should be placed below this line. After these values are
plotted, the focus can shift to the distribution of consequences on either the left or right side
of the vertical line. For this purpose, the mean performance rating is used and labeled for
the vertical axis. Each consequence with a lower mean should be plotted to the left of the
axis, and each consequence with a performance mean higher than the mean should be
plotted to the right of the vertical axis. Using this grid, the level of priority can be assigned
to each consequence from the customer’s point of view, and subsequently resource
allocation decisions can be influenced.
4. QFD tools
There are two main tools utilized in quality function deployment: the Kano model and
SERVQUAL. This section describes each of these tools in detail.
The Kano model is a theory of customer satisfaction developed in the 1980s by Noriaki Kano
(Kano et al., 1984). During interviews and focus groups, it can be difficult to elicit from
customers clear expressions of the consequences that are important to them. Attributes are
Six Sigma Projects and Personal Experiences
54
the physical or abstract characteristics of the product or service where as consequences are
the results of using the service. Sometimes customers are not even aware of important
consequences (Fisher and Schutta, 2003).
The Kano model is a theory of product development and customer satisfaction. Kano et al.
(1984) distinguish three types of product or service requirements that influence customer
satisfaction in various ways: ‘‘must be,” ‘‘one-dimensional,’’ and ‘‘attractive’’ quality
requirements. Must be requirements can be defined as the basic attributes of quality in terms
of customer satisfaction. In other words, they are a necessary but insufficient condition for
customer satisfaction (Busacca and Padula, 2005).
One-dimensional requirements are related to product or service performance; they create
customer satisfaction when present and dissatisfaction when absent (Redfern and Davey,
2003). The higher the perceived product or service quality, the higher the customer’s
satisfaction and vice versa. One-dimensional requirements are both a necessary and
sufficient condition for customer satisfaction (Busacca and Padula, 2005).
Attractive requirements can be defined as the product or service attributes that satisfy or
even excite customers when present but do not dissatisfy when absent (Berger et al., 1993).
Such attributes have the greatest influence on customer satisfaction with a given service
(Matzler et al., 1996). They are a sufficient, but unnecessary condition for satisfaction (Busacca
and Padula, 2005). Attractive attributes can be used as an element of an aggressive marketing
strategy to attract competitors’ customers. QFD normally deals with satisfiers not delighters.
Zhao and Dholakia (2009) have reported that although one-dimensional (i.e., linear)
relationships are common, other relationships between attribute-level performance and
customer satisfaction also exist that change dynamically over time and with user experience.
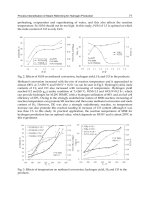
Figure 2 illustrates the three different consequences and indicates the extent to which they
can affect customer satisfaction.
Fig. 2. Kano Model
Quality Function Deployment in Continuous Improvement
55
Berry, Parasuraman, and Zeithaml developed SERVQUAL in 1988. It is a service quality tool
based on the customer’s perceptions of and expected performance. It is one of the most
widely used models for the evolution of service quality (Pawitra & Tan, 2003). Initially,
Parasuraman et al. (1985) proposed ten service quality attributes: reliability, responsiveness,
competence, access, courtesy, communication, credibility, security, understanding/knowing
the customer, and tangibles. However, in the early 1990s, these were condensed into five.
The five dimensions of service quality, commonly known as RATER, include (Lim, Tang, &
Jackson, 2003):
1. Reliability - ability to perform the promised service dependably and accurately.
2. Assurance - knowledge and courtesy of staff and their ability to convey trust and
confidence.
3. Tangibles - physical facilities, equipment, and appearance of staff.
4. Empathy - caring, individualized attention provided to its customers.
5. Responsiveness - willingness to help customers and provide prompt service.
With the help of SERVQUAL, customer satisfaction can be measured in terms of the
difference, or gap, between the expected and perceived level of performance. This approach
can be applied to any service organization to evaluate the standards of quality for the
services provided. “Services are different from goods in many ways: they are intangible,
require participation of the customer, simultaneous production and consumption” (Oliveira
et al., 2009).
Research conducted by Baki et al. (2008) concluded that the integration of SERVQUAL, the
Kano model, and QFD could serve as an effective tool in assessing quality of services
provided by an organization. The linearity assumption in SERVQUAL can be eliminated by
integrating SERVQUAL with the Kano model and QFD to develop a way to satisfy customer
needs, thus leading to increased customer satisfaction and higher profits.
SERVQUAL is a reliable and valid scale used to measure the perceived and expected levels
of performance in any service organizations and thus results in improved service offerings.
SERVQUAL is most effective when administered periodically to monitor new trends in the
service quality. By calculating the average of the differences between the scores on the
questions that make up a given dimension, and by calculating an average across all
dimensions, an organization’s quality standards can be administered (Parasuraman et al.,
1988).
SERVQUAL has also been used in the house of quality design process to evaluate customer
satisfaction with an organization’s services. It can be used to identify and analyze customer
requirements and thus forms the first stage in the construction of an HOQ. As noted by
Parasuraman et at. (1988), the SERVQUAL dimensions can be modified based on the
requirements and needs of an organization to make them more relevant to the context in
which they are used (Paryani et al., 2010).
The following sections present two case studies for the Kano model and SERVQUAL
methodology.
5. Kano model case study
This case study integrates quality function deployment and the Kano model to examine the
application of quality function deployment in the new product development process by
using the production of a fuel efficient vehicle. An integrated team of marketers, design
engineers, and business experts developed a House of Quality for the fuel efficient vehicle
Six Sigma Projects and Personal Experiences
56
that provided an insight into the customer preferences to be concentrated on and the
technical requirements that helped achieve desired results in the prototyping of a Hydrogen
Fuel Cell Vehicle (HFCV).
The product that was being developed was a plug-in hybrid. The vehicle’s power source
consists of a battery and a hydrogen fuel cell. The first step in obtaining the VOC for this
case study was to conduct interviews, which was used to derive a customer survey. The
interviews were one-on-one conversations conducted with customers to determine their
expectations from a vehicle. Only 30 interviews were conducted, as past research has shown
that this captures 90% of customer consequences for the general customer base (Griffin and
Hauser, 1991).
The interview questions included:
1. What do you look for in purchasing a vehicle?
2. What is your main need in a vehicle?
3. What is your main use for your car now?
4. What is important to you in your current vehicle?
5. What brands of vehicles are you currently familiar with?
6. What brands of environmentally friendly vehicles are you familiar with?
7. Of those vehicles, what do you know about them?
8. What is your opinion of environmentally friendly vehicles?
9. What would be your ideal environmentally friendly vehicle?
10. Name, Age, Occupation?
The purpose of the interview process was not to ask each customer all ten questions, but to
promote the customer to talk. When the subject stopped talking, the next question would get
the conversation flowing again. To elicit consequences from a customer, the interviewer
used a probing technique repeatedly by asking “why” to determine the attributes
responsible for making a specific feature appealing to them. Seventeen customer
consequences were developed from the interview data.
Affinity Diagram
After the VOC had been gathered via the interview process, the collected data was
organized using affinity diagrams. Affinity diagrams group the consequences gathered
based on similarity to clarify customer input. The 17 consequences were grouped into six
similar categories, and each category was given a title. The left side of the HOQ was
completed with customer consequences and attributes. The affinity diagram is shown in
Table 1.
Survey
The next step was to obtain the importance rating and rankings of each consequence from
the customer base. A survey was conducted of 104 customers regarding the relative
importance of the 17 consequences. The reason behind this was to avoid misinterpretation of
the customer’s overall attitude or satisfaction towards the product that could lead to poor
prediction of the customer’s purchase behavior. Customers do not place equal importance
on all consequences. Three vehicles were chosen for this purpose including a Toyota Prius
(Vehicle A), a BMW 335 advanced diesel (Vehicle B), and the HFCV (Vehicle C). In addition,
the survey respondent’s current car was used to allow comparison. The identities of the
three vehicles were not disclosed to the survey respondents. A brief description of each
vehicle was provided however, to allow them to make a nonbiased decision on ratings and
Quality Function Deployment in Continuous Improvement
57
rankings of each consequence, relative to each vehicle. Each respondent was asked to read
the descriptions and provide rating and rankings for each vehicle.
Attributes Consequences
Safety The vehicle provides accurate safety warnings.
The vehicle has high safety and standard ratings.
Efficiency The vehicle gets good mileage.
The vehicle is energy efficient.
The vehicle has high horsepower.
Cost The vehicle is affordable.
The vehicle has an extensive warranty.
The vehicle is a hybrid (i.e., it splits power between electric and gas).
Performance The vehicle has towing capabilities.
The vehicle does not compromise speed and handling.
The vehicle can be driven for longer distances (>400 miles).
Comfort The vehicle provides a comfortable ride.
The vehicle has a quality audio system.
The vehicle is climate controlled.
The vehicle comfortably fits a sufficient number of people.
Eco-friendliness The vehicle has low emissions.
The vehicle is environmentally friendly.
Table 1. Affinity Diagram
The survey was conducted in two parts. First, the respondents were asked to identify the
most important consequence to them and label it as “10”. All other consequences were to be
assigned a value (rank) between 1 and 10, relative to the consequence labelled as most
important. Therefore, some consequences may be just as important as the first consequence
assigned a value of “10”, and they too would be assigned a value of “10.” Consequences that
were almost as important as the first consequence assigned a value of “10” may be assigned
values of “9” or below, relative to how important the customer felt they were in relation to
the first “10” consequence. The mean of the rankings was calculated for the results of each
consequence that constituted the importance column in Table 2.
The second part of the survey involved rating each consequence as it applies to each of
the four vehicles on a Likert scale from 1 to 5. The mean of the ratings was calculated for
each consequence and noted in the rating column in Table 2. The weighted rating values
were obtained by multiplication of the importance (rank) and rating together. The
weighted rating is a means of obtaining an optimal solution by evaluating both what is
important to a customer and how well the customer thinks each product is doing on what
is important to them. This is also used as a means to evaluate resource allocations, as if
the customer base feels that a company is lacking on a consequence that they deem very
important, more focus can be applied to improving this, which may ultimately improve
market share. Conversely, if a customer base feels that a product excels on consequences
that are of no importance to them, resources can be directed away from these areas and
applied to areas needing improvement. The survey’s main purpose was to gather more
specific information on potential customer desires and needs. The results of the survey are
tabulated in Table 2.
Six Sigma Projects and Personal Experiences
58
Vehicle A Vehicle B Vehicle C Current
Vehicle
Importa-
nce
Rating Wei-
ghted
Rating
Rating Weigh
ted
Rating
Rating Wei-
ghted
Rating
Rating Wei-
ghted
Rating
1
This
vehicle is
climate
controlled.
6.6 4.2 27.51 4.2 27.51 3.6 23.58 4.0 26.20
2
This
vehicle
has a
quality
audio
s
y
stem.
6.7 3.4 22.64 3.5 23.31 3.3 21.98 3.7 24.64
3
This
vehicle
provides a
comfortab
le ride.
7.5 3.3 24.65 3.9 29.13 3.6 26.89 3.7 27.64
4
This
vehicle
gets good
gas
milea
g
e.
7.6 4.4 33.44 3.9 29.64 4.4 33.44 3.3 25.08
5
This
vehicle
has low
emissions.
4.7 4.2 19.57 3.5 16.31 4.4 20.50 2.9 13.51
6
This
vehicle
has low
emissions.
5.4 4.2 22.64 3.5 18.87 4.4 23.72 2.9 15.63
7
This
vehicle is
good for
the
enviro-
nment.
5.1 4.1 20.87 3.6 18.32 4.3 21.89 2.8 14.25
8
This
vehicle
has a lot
of
horsepo-
wer.
6.5 2.3 15.04 3.8 24.85 2.9 18.97 3.0 19.62
9
This
vehicle has
towing
ca
p
abilities.
5.2 1.9 9.79 3.1 15.97 2.5 12.88 2.7 13.91
Quality Function Deployment in Continuous Improvement
59
10
This
vehicle
does not
compromi
se speed
and
handlin
g
.
7.1 2.9 20.51 3.4 24.42 2.9 20.58 3.5 24.78
11
This
vehicle is
affordable.
8.0 3.7 29.77 2.5 19.87 2.3 18.03 3.7 29.77
12
This
vehicle
has an
extensive
warrant
y
.
6.2 3.2 20.06 3.3 20.49 3.0 18.69 2.9 17.70
13
This
vehicle
can drive
for long
distances
(>400
miles
)
.
7.1 3.7 26.66 3.6 25.60 3.0 21.68 3.7 26.52
14
This
vehicle
has a high
safety and
standard
ratin
g
.
7.0 3.8 26.63 3.8 26.56 3.7 25.65 3.5 24.12
15
This
vehicle
provides
accurate
safety
warnin
g
s.
5.7 3.6 20.51 3.7 21.13 3.6 20.51 3.5 19.78
16
The
vehicle is
a hybrid
(split
powers
between
electric
and
g
as
)
.
3.2 3.6 11.70 2.1 6.74 3.8 12.21 1.7 5.44
17
This
vehicle
comfortab
ly fits a
family of
all sizes.
4.7 2.4 10.95 3.7 17.06 3.3 15.56 2.8 13.23
Six Sigma Projects and Personal Experiences
60
18
Overall, I
am
satisfied
with this
type of
vehicle.
3.2 3.6 3.4 3.9
Sum 104.07
62.1
5
362.9
3
62.7
4
365.7
7
62.3
9
356.7
6
58.1
6
341.8
2
Avera
g
e
3.49
3.51
3.43
3.28
Table 2. Importance Rating
Development of Technical Requirements
After the customer consequences were analyzed, the next step in the construction of the
HOQ was the development of technical requirements. The technical requirements are the
design specifications that satisfy customer needs. This aspect of QFD is directly in the
organization’s control, and focuses on designing specific, measurable design aspects that
ensure the end product meets the customer wants and needs. The technical requirements
are called the ‘hows’ and are placed on the top of the house. Each consequence can have
one or more technical requirement. Technical requirements must be within the control of
the manufacturer. It must also be measurable to enable designers to determine if the
customer’s needs are fulfilled. Brainstorming among marketers and product designers
was used to develop the technical requirements, along with various Internet sources for
references to industry standards. Thirty technical requirements were developed and
organized using tree diagrams. One of the seven management tools, the tree diagram is a
hierarchical structure of ideas built from the top down using a logic and analytical
thought process.
A customer design matrix log was then developed that created a product development log
that provided a history of the design process. It contained the design concepts derived from
the customer’s voice and the corresponding technical requirements that were designed, their
measurement units and values. The column ‘Measurement units’ in Table 3 was placed at
the bottom of the HOQ indicating how each technical requirement would be measured.
Table 3 shows the customer design matrix log.
Relationship Matrix
Once the customer consequences and the technical requirements were developed, a
relationship matrix was constructed. The matrix defines the correlations between customer
attributes and technical attributes as weak, moderate, or strong using a standard 9-3-1 scale.
For this scale the following notations are used Strong (H) = 9, Moderate (M) = 3, and Weak
(S) = 1.
Each customer consequence was matched with each technical requirement. The relationship
between them was then determined and placed in the relationship matrix that constitutes
the of the HOQ. This matrix identifies the technical requirements that satisfy most customer
consequences and determines the appropriate investment of resources for each. The
technical requirements that addressed the most customer consequences should be dealt into
the design process to ensure a customer-approved product. Ideally in the QFD analysis, no
more than 50% of the relationship matrix should be filled, and a random pattern should
result (Fisher and Schutta, 2003). Relationships were determined here on the basis of
Quality Function Deployment in Continuous Improvement
61
research conducted using resources available on the Internet. Appendix A displays the
relationship matrix developed for the HOQ.
No
Customer’s
Voice
Technical
Requirements
Measurement Measurement Units
1 Climate control
Level of temperature
change
Boolean Value Yes/No
Time taken to attain the
changed temperature
Time Minutes/Seconds
2 Audio System
Power of speakers Power Watts
No. of operability modes
in an audio system
Number Integer value
3 Comfort
Seating Capacity Capacity Integer value
Distance between front
and rear seat
Length Inches
4 Fuel Efficiency
Engine Power Power Horsepower
Air compression ration Volume Cubic cms (cc)
Size of exhaust pipes Diameter Inches
5
Environmental
friendly
Lower Emissions
(Nitrogen, Carbon-
dioxide, Carbon-
monoxide)
Weight/Distance Grams/Km
Hybrid Boolean Value Yes/No
6 Safety
Size of side & rear view
mirror
Ratio Ratio
Size of damping sheets
Suspension/steering
stability
Spring frequency Cycles/minute
(cpm)
No. of airbags Number Integer value
Air bag response time Time Seconds
Alignment of tires Toe-in (Distance) Fractions of an inch
Crash warning system Boolean Value Yes/No
7
Long distance
travel
Tank capacity Capacity Gallons
Tire quality UTQG standards Grades
8 Warranty
No. of parts covered
under warranty
Number Integer value
Validity of warranty Time Years
Cost of extended
warranty
Boolean Value Yes/No
9 Performance
Torque transmission Force Foot-pounds
Cylinder size Volume Liters
No. of valves/cylinder Number Integer value
Weight of engine Weight Grams
Table 3. Customer Design Matrix
Six Sigma Projects and Personal Experiences
62
Planning Matrix (Customer Competitive Analysis)
After completion of the relationship matrix, the focus of the project shifted to the
construction of the planning matrix. This matrix defines how each customer consequence
has been addressed by the competition. It provides market data, facilitates strategic goal
setting for the new product, and permits prioritization of the customer desires and needs. It
also compares the product to its key competitors. A standard 5-point Likert scale was used.
Each vehicle was represented by different symbol. A square symbol was used for the Toyota
Prius, a circle for the BMW 335d, and a triangle for the HFCV. The ratings were based from
the customer survey. Customers rated the three vehicles for each of the 17 customer
consequences included in the planning matrix. Appendix A shows the planning matrix in
the HOQ.
Technical Correlations
Following completion of the planning matrix, technical correlations were determined. These
form the roof of the HOQ. The roof maps the relationships and interdependencies among
the technical requirements. The analysis of which informs the development process,
revealing the existence and nature of design bottlenecks. The relationships among technical
requirements were plotted and given a value. Past experience and test data were used to
complete the roof of the HOQ. Symbols are used to represent the level of the relationship
between technical requirements. Appendix A shows the completed roof of the HOQ, with
all relationships identified between the technical requirements.
Technical Matrix
Next, a technical matrix was constructed to form the foundation of the HOQ. This matrix
addresses the direction of improvement, standard values, units of measurement, the relative
importance of technical requirements, and technical evaluation.
The customer design provides information regarding consequences, technical requirements,
and their units and values. It contains design concepts derived from the VOC and detailed
design considerations. The column ‘Measurement Units’ from Table 3 was placed at the
bottom of the HOQ, indicating the units of measurement for each technical requirement.
The relative importance of each technical requirement was calculated by multiplying the
value assigned to its relationship with a specific consequence (9, 3, 1) multiplied by the
importance of that consequence; the values of all consequences were then added to yield the
final weight. These weights were placed in a row at the bottom of the HOQ. A final weight
is a comprehensive measure that indicates the degree to which the specific technical
requirement relates to the customer consequences.
The technical evaluation of the competition and the product to be developed is carried out
by the engineering and technical staff who would design the product. The process
establishes strategic goals for the product development process to ensure the satisfaction of
the customer. For each technical requirement, the product was compared to its competitors
and a technical evaluation was performed. Thus, the construction of the HOQ was
completed. Appendix A shows the completed HOQ with the roof.
Prioritizing Resource Allocations
The collected information from the above methods helped in the development of strategic
decisions, one of them being the allocation of resources. An importance-performance grid
was developed to prioritize the usage of resources for improvement on the most critical
Quality Function Deployment in Continuous Improvement
63
customer benefits. The relative importance ratings were plotted on the vertical axis
(importance) and the median importance rating on the horizontal axis (performance). Using
the values from the column ‘Importance’ from Table 2, the median importance rating was
found out to be 6.5. Consequences with rating higher than that of the median importance
rating were placed above the horizontal line and the others below the median. After this
decision was made, the focus shifted to the distribution of consequences on either the left or
right side of the vertical line. For this purpose, the median was calculated for each
consequence and if the mean brand rating was higher than that value it was placed on the
right side of the vertical line otherwise on the left side. Using this grid, the level of priority
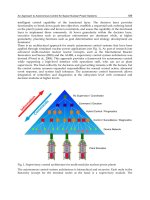
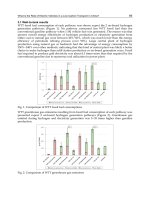
was assigned to each consequence from the customers point of view. Figure 3 shows the
Importance-Performance grid for Vehicle C (HFCV).
First Priority
#1, #2, #14, #13, #10, #3, #4,
#11, #8
Second Priority
Third Priority
#17, #9, #6, #15, #12
Fourth Priority
#17, #5, # 7
Fig. 3. Importance-Performance Grid
Recommendations and Conclusions
This study has illustrated how QFD can successfully be applied to new product
development efforts via the application to the prototyping of a fuel-efficient vehicle. This
study was deemed a success, as the results were reasonable per the design team that is
currently in progress prototyping the product. For this particular application, the results
showed that the first and utmost priority should be given to the following customer
benefits/consequences: climate control, quality audio control, high safety and standard
rating, long distance travel, high speed and handling, comfortable ride, good gas mileage,
substantial horsepower, and affordability. These benefits are ones that must be
accomplished in order to appeal to the customers in the market, and thereby give the new
product a chance for success as a sellable product. The consequences were identified as
priority because they are of high importance to the customer, but have poor performance
according to the prototype description given to the respondent group in the study. These are
the areas of design that must be addressed so as to create a product that appeals to the
consumer. If resources are limited, consideration should be given to shifting resources to
Relative
Performance
Relative
Importance
Six Sigma Projects and Personal Experiences
64
these priorities in the design phase. Conversely, the fourth priority benefits include low
emissions, environment-friendly, and power split between electric and gas. These benefits
are performing well and not of high importance, so no improvement needs to be made with
these benefits currently. In fact, resources can actually be shifted away from these aspects
and reinvested elsewhere where the design needs improvement to meet customer
expectations.
The results presented in this study aided the design team of the HFCV and provided them
with an insight into what customers were really looking for in an environmentally friendly
vehicle. The application of QFD to the prototyping of a HFCV proved to be beneficial, as the
voice of the customer was gathered, analyzed, and factored into the design process to ensure
a product that will meet customer expectations.
It has been demonstrated that the QFD methodology can be successfully applied in a new
product development process. It also aided the HFCV design team in developing a
proprietary knowledge base about their customers’ needs and wants which allowed them
to make the best design efforts in the early development stages that lowered the
development costs and increased profit levels. Although this study focused on the
production of HFCV, the QFD methodology presented could serve as a powerful
reference to the development of a new product of any kind. The authors hope that this
study could attract more new product development teams and organizations to adopt
QFD in the NPD process and develop better and successful products and achieve high
customer satisfaction with increased profit levels.
6. SERVQUAL case study
This case study integrates quality function deployment and SERVQUAL to evaluate a
university career opportunities center (COC) and recommends service standards to increase
its benefits to students. A university COC seeks to bridge the gap between students and
employers. It equips students with the professional skills they need to find employment.
The staff keeps the students regularly informed about various events such as the career fair,
and it can help them make major career decisions. A COC should maintain high standards
of quality and serve students efficiently. To do so, its staff must understand student needs
and constantly monitor feedback to improve their performance.
The mentioned methodology has been applied to a COC at a university. Detailed steps are
listed for the construction of the HOQ, with SERVQUAL being incorporated into QFD in
this application. A step-by-step procedure for this case is discussed in this section.
SERVQUAL dimensions for a COC
The main goal of applying QFD to a university COC was to identify how the COC could
better serve students. This work sought to identify expectations of the students and the
measures necessary to meet them. Here, SERVQUAL was applied to identify the key
customer needs and requirements. Table 4 presents the SERVQUAL dimensions and their
definitions as they relate to their application to the COC case study.
To make the dimensions more relevant to a COC, a few SERVQUAL items were modified or
removed based on the responses obtained through student interviews. A total of 15
customer requirements were identified. Table 5 provides the modified SERVQUAL
dimensions and customer requirements.
Quality Function Deployment in Continuous Improvement
65
Dimensions Description
Reliability
The ability of the COC staff to deliver the promised services
dependably and precisely.
Assurance
Knowledge and courtesy of the COC staff and their ability to
communicate trust and confidence in the students.
Tangibles
Physical aspects of the COC including the appearance of personnel and
communication services.
Empathy
Ability to provide individualized attention and care by the COC staff
to the students.
Responsiveness
Willingness of the COC staff to serve the students and provide them
with prompt services.
Table 4. SERVQUAL: Five Dimensions
Dimensions Customer Requirements
Empathy
I get a job that fits me
I have a job that I enjoy
I know what different jobs are available
I can work overseas
Reliability
I get job offers
I get a job that pays well
I get opportunities with potential employers
I have my resume easily accessible to companies
Assurance
I stand out to a potential employer
I am prepared for an interview
I am comfortable during an interview
Responsiveness
I have interviewing experience
I get a resume evaluation
Tangibles
I have a professional resume
I have a professional appearance for an interview
Table 5. SERVQUAL Adjusted Items Description
These SERVQUAL items are the customer consequences that were obtained by conducting
interviews with 30 students. The intention behind interviewing these students was to keep
the conversation flowing. To elicit the consequences from a customer, the interviewer used a
probing technique repeatedly by asking “why” to determine the reason responsible for
making a specific aspect appealing to them. When the student stopped talking, the next
question would get the conversation flowing again.