Heat and Mass Transfer Modeling and Simulation Part 5 pdf
Bạn đang xem bản rút gọn của tài liệu. Xem và tải ngay bản đầy đủ của tài liệu tại đây (2.17 MB, 20 trang )
Process Intensification of Steam Reforming for Hydrogen Production
71
preheating, evaporation and superheating of water, and this also affects the reaction
temperature. So
W/M should not be too high. In this study, W/M of 1.3 is optimal at which
the mole content of CO is only 0.4%.
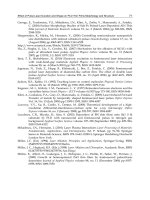
Fig. 2. Effects of
W/M on methanol conversion, hydrogen yield, H
2
and CO in the products.
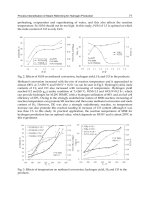
Methanol conversion increased with the rise of reaction temperature and it approached to
almost 100% at
T
r
=250 ℃ and WHSV = 0.2 h
-1
as can be seen in Fig.3. Hydrogen yield, mole
contents of H
2
and CO also increased with increasing of temperature. Hydrogen yield
reached 0.2 mol/(h·g
cat
) under condition of T
r
=260 ℃, W/M=1.3 and WGHV=0.2 h
-1
, which
can provide hydrogen for 10.2W PEMFC with a hydrogen utilization of 80% and an fuel cell
efficiency of 60%. Owing to the strongly endothermic nature of MSR reaction, increasing of
reaction temperature can promote SR reaction and then raise methanol conversion and mole
content of H
2
. However, DE was also a strongly endothermic reaction, so temperature
increase can also promote this reaction leading to increase of CO content although it was
less than 1% in this study. In practical application, the reaction temperature of MSR for
hydrogen production has an optimal value, which depends on
WHSV and is about 250℃ in
this experiment.
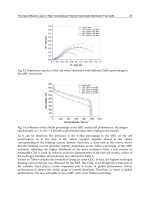
Fig. 3. Effects of temperature on methanol conversion, hydrogen yield, H
2
and CO in the
products.
Heat and Mass Transfer – Modeling and Simulation
72
It can be seen in Fig.4 that, with the increasing of WHSV, methanol conversion reduced from
95.7% to 49.1%; mole content of H
2
was also decreased from 70.3% to 38.3%, whereas CO
rose firstly and then decreased. Hydrogen yield mounted from 0.2mol/(h·g
cat
.) to about 0.5
mol/(h·g
cat
), then dropped quickly. With the increase of WHSV, residence time of the
reactants in the reactor was reduced which resulted in reducing of methanol conversion and
H
2
mole content. Consequently, in order to increase methanol conversion at higher WHSV,
reaction temperature should be increased. However, when
WHSV was smaller, T
r
was the
main factor influencing hydrogen production, which promoted positive reaction of DE, and
resulted in a gradual increase of CO. When
WHSV became larger, it became main factor
which influenced the composition of products. And this may promote positive reaction of
RWGS and further decreasing CO content. On the other hand, although raise of
WHSV
caused a reduction of methanol conversion, the methanol flow rate increased which added
to hydrogen yield at certain range of
WHSV. So hydrogen yield rose firstly and decreased
afterwards along with increase of
WHSV.
Fig. 4. Effects of liquid space velocity on methanol conversion, hydrogen yield, H
2
and CO
content.
Methanol conversion was compared between experiment with 3D simulation as shown in
Fig.5. It inferred that numerical model agreed well with experimental results at lower
T
r
but smaller at higher
T
r
. This may due to the heating model adopted in simulation as
bottom of the reaction area was heated. Whereas in experiment, whole stainless steel
micro-reactor including its cover board became a heat source for MSR reaction which led
to the increase of methanol conversion. So it was reasonable to use this model to predict
the performance of the micro-reactor. In this study, inner surface temperature of the
reactor cover was got and compared with simulation as well as reference results. It
revealed that a cold spot at the inlet of the reactor of 8.5
℃ and 10℃ existed from
experiment and simulation results. Comparing with reference, it was much smaller due to
reduction of reactor size from convention to micro-scale although reaction temperature
was higher
[10]
. In the experiment of methanol steam reforming, catalyst particles were
moving from forepart to the back of the reactor due to washing of catalyst bed by
reactants, and this resulted in the distribution of catalyst of sparse to dense along the
reactor. The cold spot temperature difference may also become smaller than that in the
simulation.
Process Intensification of Steam Reforming for Hydrogen Production
73
Fig. 5. Experiment, numerical and literature comparisons of methanol conversion and
temperature distribution in the reactor.
From the above comparison results of experiment and simulation, it indicated that through
controlling of catalytic activity in the reactor, the temperature distribution can be optimized
and the cold spot effect can be minimized. So in this section gradient distributed catalyst
bed was designed and simulated in 2D model. As can be seen in Fig.6, although the number
of cold spot increased under gradient distributed catalyst bed compared with the uniform
distributed situation, the maximum cold spot temperature difference decreased about 10K.
Furthermore, as heat and mass transport resistances between the catalyst material and the
reactants were neglected in 2D and 3D simulation, it can be inferred that this gradient
distribution of catalyst will be more beneficial under transport limitation conditions.
Fig. 6. Comparison of temperature along the centerline of reaction section, outlet H
2
and CO
contents under uniform and gradient catalyst distribution conditions.
Although
W/M of 7.89 h
-1
at catalyst gradient distribution is far greater than 0.15 h
-1
at
uniform distribution, outlet hydrogen content nearly approached theoretical hydrogen
content of 75%, which increased by about 8.5% compared with catalyst uniform distribution
condition; while outlet CO content reduced to less than 0.13%. As MSR reaction is a strongly
Heat and Mass Transfer – Modeling and Simulation
74
endothermic process, it can be inferred that gradient catalytic activity distribution is able to
reduce the cold spot effect significantly and this effect can be applied to any catalytic
reaction with strong heat effect. And it will be more useful in large scale catalyst reactors
due to the increasing heat and mass resistance in the catalytic bed.
3. Process intensification of steam reforming by cold sprayed catalytic
coating
3.1 Experimental
Except micro-scale reactor adoption, coating catalyst can also be used to reduce heat and mass
transfer resistance from the catalyst surface to the main stream. In this section, several kinds of
coatings were deposited using the cold spray system developed by Chongqing University for
methanol and methane steam reforming. The system includes gas pressure regulators, gas pre-
heater, gas flow meters and spraying gun as shown in Fig.7. The gun consists of a gas
Fig. 7. Schematic of cold spray system, the gun and morphology of different feedstock.
Process Intensification of Steam Reforming for Hydrogen Production
75
chamber, a powder storage chamber and a convergent-divergent accelerating nozzle. And
nozzle throat diameter is 1.5 mm with an exit diameter of 2.6 mm. Length from the throat to
the exit is 62.6 mm, among which the expansion section is 12.6mm, the other is straight tube. In
this study, nitrogen was used as a driving gas and carrying gas with an inlet pressure of 1.4
and 1.6 MPa for the heating gas and powder carrying gas separately. Heating gas temperature
range is 573 K to 773 K. Stand-off distance of the substrate from nozzle exit is 20 mm. During
spraying, the substrate was manipulated by a running gear and traversed at a relative speed of
5 mm/s over the substrate.
Four kinds of powders of Cu, Cu-Al
2
O
3
composite, milled commercial Cu/ZnO/Al
2
O
3
for
MSR and primary NiO/Al
2
O
3
catalyst for SRM with diameters less than 75μm were used as
feedstock. Morphology of the powders and substrate of Al and stainless steel after surface
treatment were shown in Fig.7. It can be seen that all the powders are of irregular shape and
with different size scale except that of Al
2
O
3
with spherical morphology. Cu powder is of
arborization morphology, while NiO/Al
2
O
3
and CuO/ZnO/Al
2
O
3
catalytic powders are
irregular kernel morphology. Before spraying, the substrate was polished by sand paper in
order to wipe off the oxide film, and then cleaned by ethanol and deionized water.
The morphology of the feed stock and coating before and after methanol and methane steam
reforming was observed using scanning electron microscopy (SEM) (TESCAN VEGAII
LMU). And the micro-region element composition was examined by EDX. Phase structure
was characterized using X-ray diffraction (XRD) system (D/MAX-3C) with Co Kα1
radiation at 35 kV and 30 mA. Scan speed for 2θ was 2.5
o
/min during test.
Experiments of methanol and methane steam reforming for hydrogen production were
carried out to examine the cold sprayed Cu-based and Ni-based coating performance at
atmosphere pressure.
3.2 Results and discussion
Morphology of the cold sprayed coatings before and after steam reforming reaction were
shown in Fig.8. Cu-based catalytic coatings were used in methanol steam reforming,
whereas Ni-based catalytic coatings were used in methane steam reforming.
It can be seen that the particles are severely deformed in Cu coating, the arborization
morphology of the Cu powder is disappeared. After MSR reaction, morphology of the
coating changes from piled sheets structure to micro-ramify structure, its porosity obviously
increases, but carbon deposition is serious. This structure can be caused by repeatedly
oxidization and reduction in MSR because when MSR experiment system shuts down,
oxygen in the air may be in touch with the coating, and hydrogen in the reformed gas is able
to play a reduction effect. It was also found that copper coating can recover its activity by
contacting with oxygen, so the loss of catalytic activity was due to the gradual exhaustion of
the surface oxygen on the copper surface. So it was concluded that the active site of Cu-
based catalyst for MSR may be copper oxide species, either Cu
+
or Cu
2+
.
While in the Cu-Al
2
O
3
coating, copper powders are not severely deformed. The main reason
is that the properties of Cu and Al
2
O
3
powders are so different. This results in the different
flying speed of the particles which leads to the deposition efficiency and micro-region
component in the coating to be ill-proportioned. Another reason is that single Al
2
O
3
powder
is aggregation of smaller kernels, in collision with the Al substrate, Al
2
O
3
powders are
shattered to smaller pieces and this cracking makes the situation even worse. This effect is
more obvious in the coating after MSR for small pieces of Al
2
O
3
with white present region.
MSR on the Cu-Al
2
O
3
coating shows that it is more stable than the copper coating. Probable
Heat and Mass Transfer – Modeling and Simulation
76
Fig. 8. Morphology of the cold sprayed coatings before and after steam reforming.
Process Intensification of Steam Reforming for Hydrogen Production
77
reason is that the smashed Al
2
O
3
pieces prevent the active Cu in the coating from sintering.
What’s more, Al
2
O
3
component provides and stabilizes the surface oxygen in the Cu-Al
2
O
3
coating. In this study it appears that the predominant mechanism for bonding was mechanical
interlocking, especially for the Cu-Al
2
O
3
composite and CuO/ZnO/Al
2
O
3
catalytic coating.
Cold sprayed CuO/ZnO/Al
2
O
3
catalytic coating appears to not as porous as the powder in
the feedstock. This is due to that binder in the catalyst goes soft in the spraying and colliding
process and re-solidifies gradually. After methanol steam reforming, it presents a loosen
structure morphology and this is formed by the deposited powder’s washing away by the
reacting fluid. From the above analysis it can be included that the deposition characteristic
of the oxide aggregation feedstock is noticeably different from that of the pure metal
powder. The bonding mainly belongs to mechanical bite and physical bonding.
Composition analysis showed that after surface treatment Al substrate contains mainly Al
element, and O element in the surface is less than 5.82%. As for the Cu-Al
2
O
3
composite
coating, O and Al elements increase in the coating after reaction, correspondingly Cu
element decreases. In the original feedstock of the composite coating, Cu/Al ratio (wt. %) is
about 6.48, whereas in the deposit, Cu/Al ratio decreases dramatically. Before reaction this
ratio is 3, after reaction, it decreases to 1.5, it seems that Cu powders are
“missing” in the
cold spray process. This may be strange because it is known that Cu powder is much more
prone to deform than Al
2
O
3
powder. The probable reason may lies in the morphology of the
powders, although the Cu powder with irregular morphology presents a higher in-flight
particle velocity than Al
2
O
3
with spherical morphology with same size, the deposition
efficiency of Cu is lower than Al
2
O
3
powder. Content of component in the coating and
feedstock of the CuO/ZnO/Al
2
O
3
is approximately the same except that O content in the
coating after reaction decreases, while Al increases. Possible reason is that when the small
pieces in the coating are not strongly integrated into the substrate and washed off by
reacting fluid, the Al phase in the substrate goes into the EDX analysis. And this is just the
proof that CuO/ZnO/Al
2
O
3
coating fabricated by cold spray is very thin, may be monolayer
or at most 2 to 3 layers. Therefore, thickness of the coating is determined by the dimension
of feed powders and this provides a kind of nanometer catalytic coating fabrication method.
The reason that thickness of CuO/ZnO/Al
2
O
3
coating cannot be further increased is that
when a first monolayer is formed on the substrate, CuO/ZnO/Al
2
O
3
powders arrive at the
monolayer surface soon after has to collide with non-deformable CuO/ZnO/Al
2
O
3
coating.
Here the main process is powder's subsequent tamping effect and this effect results in the
smashing of the catalytic powder. Deposition efficiency decreases greatly.
MSR was carried out on the three types of Cu-based coating. Results show that, at the
reaction temperature of 190
℃ to 200℃, H
2
concentration increases from 28.6% to 42.6%, and
reaches 57.4% on Cu-Al
2
O
3
coating. H
2
content in the reformed products reaches 74.9% at
250
℃ on the Cu coating, but the activity loses very quickly. While at the condition of inlet
temperature 265
℃, water and methanol molar ratio 1.3, fluid flow rate 0.54ml/min, H
2
content in the products for CuO/ZnO/Al
2
O
3
catalytic coating reaches 52.31%, whereas CO
content is only 0.60%. Through the weighing of the catalytic plate before and after cold
spray process, we get the weight of the catalytic coating of merely 100 mg, and thus the
liquid space velocity is equal to 5.10 mol/(g·h) (or 162h
-1
). Compared to the fixed bed
kernels in the reaction section of the reactor, the activity of the cold sprayed
CuO/ZnO/Al
2
O
3
catalytic coating is much higher
[11]
. One possible reason may be that heat
and mass transfer is fast on the CuO/ZnO/Al
2
O
3
catalytic coating than the conventional
fixed bed catalyst, especially in micro-reactors.
Heat and Mass Transfer – Modeling and Simulation
78
Morphology of the cold sprayed NiO/Al
2
O
3
coating before and after SRM is also shown in
Fig.8. It presented a rough surface morphology. Granule appearance of staring NiO/Al
2
O
3
powders disappeared in the coating, so it could be inferred that the particles were severely
deformed by high speed impact with the stainless steel substrate. Detailed examination of
the surface morphology clearly showed that surface structure of the cold sprayed deposit
was somewhat different to the powder. Its porosity seemed higher than the feedstock, and
this is favorable for catalytic surface reactions because area of the coating surface increased
at same volume catalyst. Since NiO/Al
2
O
3
powder was aggregation of smaller kernels with
different size scale, and it is not easy to deform when colliding with substrate, NiO/Al
2
O
3
powders were shattered to smaller pieces due to the high shear rate that occurred when a
high velocity particle was arrested by collision with the substrate surface and/or deposited
coating surface. Therefore, it could be concluded that the process of oxide aggregated
catalytic coating fabrication by cold spray is not like the metal coating fabrication, smashing
of the striking powder takes a main role in the coating formation. In this study it appeared
that the predominant mechanism for bonding was mechanical interlocking. Although
different size scale powders were used as feedstock, the cold sprayed coatings seemed to
have a homogeneous distribution of the powders and consisted of several layers. The reason
was that when the brittle NiO/Al
2
O
3
powders collided with the substrate and/or the
coating previously formed, they smashed into small particles, only the particles in suitable
size range reached and kept its velocity above the critical velocity and attained valid
deposition. The larger one smashed further and the smaller one was washed away by the
high speed gas flow. And this is one of the reasons that the coating could not build up
further no matter how many passes the deposition was repeated for. Since the deposition
efficiency would be dramatically decreased.
After 100h SRM reaction on stream, SEM images showed the formation process of filamentous
carbon on the catalytic coatings, and this is one of the reasons that led to the drop of catalyst
coating activity since a portion of the active coating surface was covered by deposited carbon.
However, activity of catalyst coating remained stable for a relatively long period of 100h in the
SRM experiment. In addition, highly dispersed small nickel particles on the cold sprayed
catalyst coating were responsible for strong resistance toward carbon deposition in the steam
reforming of methane. After 100h SRM reaction, there was no obvious peeling off of the
coating, indicating a good bonding between the coating and substrate.
The EDX analysis results showed that Ni content in the cold sprayed coating was higher
than the initial catalyst powder, and this could be due to the characteristic of cold spraying
process. Since the impact velocity is affected by the spraying material, it will be easier for the
powder with higher density to deposit in this situation, so the particles with higher Ni
content had more chance to successfully deposit. After SRM reaction, some of the coating
surface was covered by carbon, so Ni content decreased.
Primary steam reforming of methane for hydrogen production was carried out in the
temperature range of 845K to 995K, and steam to carbon ratio (
S/C) changed from 2.5 to 10.0,
the space velocity ranged from 9.9×10
4
/h to 3.0×10
5
/h. The results are shown in Fig.9. It can
be seen from the data that methane conversion increased with the reaction temperature and
decreased with methane space velocity. There was report of 37.4% conversion of methane at
the reaction temperature of 973K, reactor pressure of 3.0MPa, steam to carbon ratio (
S/C) of
2.7 and inlet gas hourly space velocity (
GHSV) of 0.2×10
5
h
-1[7]
. At relatively lower S/C of 2,
much higher
GHSV of 1.8×10
5
h
-1
and reaction temperature of 976K, methane conversion in
our study was 8.1%. Although this value was lower than the reference above, but
Process Intensification of Steam Reforming for Hydrogen Production
79
considering the nine times higher GHSV, it could be concluded that cold sprayed
NiO/Al
2
O
3
coating is superior to kernel catalyst in packed bed reactor as its high output.
Cold sprayed catalytic coating is excelled catalyst prepared by conventional methods, the
fundamental reason lies in the superior bonding of coating with substrate, reduced heat and
mass transfer limitation in the reaction.
Fig. 9. SRM performance of the cold sprayed coating.
4. Process intensification by catalytic surface and activity distribution
4.1 Simulation method description
For the further optimization of the transport characters of MSR in the micro-reactor with
coating catalyst, effects of catalytic surface distribution, catalytic activity distribution on the
micro-reactor performance were investigated by numerical simulation. With the application
of general finite reaction rate model in CFD software of FLUENT, 2D simulation of this
process was carried out.
Along the flow direction, the inner up and down surface of the micro-channel was divided
to 12 equal sections as shown in Fig.10. Every section was named by
up
i
or down
i
, i=1, 2,
3…12
; so the total 24 sections can be selectively combined according to catalytic surface
and activity design.
Fig. 10. Design of catalytic surface distribution.
Heat and Mass Transfer – Modeling and Simulation
80
As for the study of catalytic surface distribution effects on the MSR reactor performance,
five surface distributions were defined as shown in Table 1. Where, number of interruption
represents the number of discontinuous of catalytic surface with non catalytic surface; take
D2 distribution for example, there exists an interruption at
down
6
and up
7
each, so the
interruption number is 2.
Types of
distribution
Catalytic active surface contained
Number of
interruption
D1 down
1
~down
12
0
D2 down
1
~down
6
, up
7
~up
12
2
D3 down
1
~down
3
, up
4
~up
6
, down
7
~down
9
, up
10
~up
12
6
D4
down
1
~down
2
, up
3
~up
4
, down
5
~down
6
, up
7
~up
8
, down
9
~down
10
,
up
11
~up
12
10
D5
down
1
, up
2
, down
3
, up
4
, down
5
, up
6
, down
7
, up
8
, down
9
, up
10
,
down
11
, up
12
22
Table 1. Types of catalytic surface distribution with same catalytic activity.
As for the catalytic activity distribution study, three types of distributions were defined as
shown in Table2. The total length of the reaction channel
L is 12 mm, and height of it is 0.5
mm. In order to achieve the above catalytic surface and activity design, cold spray method
for catalytic coating fabrication can be used as was studied in section 3 and an example of
interrupted Cu coating was prepared by this technology. The activity and surface
distribution can be modified by altering the spraying parameters such as material of
feedstock, temperature and pressure etc.
The assumption of this simulation study is the same as stated in section 2, However, the
kinetic model used was simplified to single rate model because the main purpose of this
study is to discuss the effect of surface and activity distribution on the reactor performance.
So the MSR power function type kinetic model suitable for Cu/ZnO/Al
2
O
3
catalyst was
adopted.
/( )
0.60 0.45
012
Ea RT
rke C C
(10)
Where,
k
0
is the exponential factor, which represents activity of the catalytic surface. As for
the catalytic surface distribution study, it equal to 1.2
×10
7
mol/(m
2
·s); as for the catalytic
activity distribution study,
k
0
equals to 1.2×10
7
×2
n
mol·m
-2
·s
-1
(n=0, 1, 2…12). Subscription
of 1,2 represents CH
3
OH, H
2
O respectively. The activation energy Ea is 96.24 kJ·mol
-1
.
Water and methanol molar ratio was set to 1 in all situations.
4.2 Results and discussion
4.2.1 Effect of catalytic surface distribution
With increase of temperature, methanol conversion increased at all types of catalytic surface
distributions, and this is coincided with experiment results. In order to obtain inlet
temperature
T
in
and velocity V
in
, catalytic surface distribution effects on methanol
conversion, increment of methanol conversion
△
X was defined based on D1 distribution
conversion at same conditions.
Process Intensification of Steam Reforming for Hydrogen Production
81
△
X=X(Di)-X(D1), (i=2, 3, 4, 5 ) (11)
Results showed that
△
X increased with increasing of T
in
, and at same temperature
conditions,
△
X also increased with V
in
; from D2 to D5 distribution,
△
X increased with
respect to D1. This indicated that catalytic surface distribution contribution on methanol
conversion increased with temperature, velocity and interruption of catalytic surfaces as
shown in Fig.11.
Fig. 11. The effects of
V
in
and Di on
△
X at different temperatures.
At conditions of
T
in
=513 K, V
in
=1.0 m/s, compared D5 with D1, methanol conversion
increased by 10.2%, so in methanol steam reforming system at the same conversion
request, this interrupted distribution of catalytic surface can greatly reduce the load of
catalyst especially when the noble metal catalyst was adopted. Furthermore, although
methanol conversion increased with inlet
T
in
, V
in
, the rate of increment was different as
can be seen from Fig.11. At inlet temperature of 453 K, rate of
△
X changed from fast to
slow with inlet velocity; at 453 K, rate of
△
X represented a linearly variation; however, at
Heat and Mass Transfer – Modeling and Simulation
82
inlet temperature of 493 K, 513 K, rate of
△
X appeared a reverse variation compared to
the condition of 453 K. So variation of
△
X rate existed a turning point with inlet T
in
and V
in
and this phenomenon should be considered in design of catalytic surface
distribution.
From the above analysis it can be seen that through reasonable catalytic surface distribution,
methanol conversion can be increased. The reason is that in reaction channel there existed
the diffusion limitation of reactants from main stream to catalytic surface; reasonable
catalytic surface distribution can increase the local concentration of the reactants at the
interruptions. At condition of 513 K, 1.0 m/s, methanol mass fraction of
Y
1
was shown in
Fig.12 from D1 to D5 distributions.
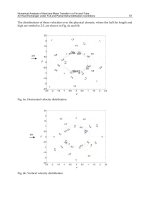
Fig. 12. The change of
Y
1
and average Y
1
along the reaction channel.
In conventional reaction channel, concentration distribution of reactants was similar to
that of D1 situation, however, from D2 to D5 distribution, catalytic surface interruptions
broke the continuous concentration distribution, and this resulted in the concentration
was higher at local interruptions so on the next catalytic surface after the interruption,
concentration of the reactants increased which enhanced the utilization of the catalytic
surface.
It is clear that methanol conversion increased from D1 to D5 distribution; actually from D1
to D5 distribution, the number of surface interruption (
n) increased, from 0, 2, 6, 10 to 22
respectively. At condition of
T
in
=513 K, V
in
=1.0 m/s, methanol conversion increment
△
X
was plotting with the surface interruption
n as shown in Fig.13. It can be seen that although
△
X increased with n, its rate of increase slowed down, and finally turned into zero.
Therefore, it is not that number of surface interruption (
n) the bigger the better. In this study
surface interruption number
n of D5 is enough.
In conclusion, through catalytic surface interrupted distribution methanol conversion
increased at the same catalyst loading. So, at the same methanol conversion request, catalyst
loading can be reduced. This is not only effective to MSR, but also useful to all the
heterogeneous catalysis process on coating catalyst especially for reaction with strong heat
effect.
Process Intensification of Steam Reforming for Hydrogen Production
83
Fig. 13. The change of
△
X with n.
4.2.2 Effect of catalytic activity distribution
In this section for catalytic activity distribution study, three types of distributions were
defined as shown in Table 2. Effects of catalytic activity on methanol conversion
X showed
that, at the continuous catalytic surface distribution of
D1, methanol conversion increased
with catalytic activity (expressed by activity exponential doubling number
n) as shown in
Fig.14.
Types of
distribution
Exponential factor
k
0
(mol·m
-2
·s
-1
)
Activity exponential
doubling number
D1
Activity of down1~down12 surfaces is 1.2×10
7
,
2.4×10
7
, 4.8×10
7
… respectively; Catalytic surface is
consecutive, Catalytic activity is identical; So there are
12 groups altogether.
0, 1, 2…11
D2
Activity of down1 is 1.2×10
7
, and down2 is 2.4×10
7
,
and down3 is 4.8×10
7
…, Catalytic surface is
consecutive, Catalytic activity is multiplying; So there
is one group only.
0, 1, 2…11
D3
Activity of down1 is 1.2×10
7
, and up2 is 2.4×10
7
, and
down3 is 4.8×10
7
…, Catalytic surface is interrupted,
Catalytic activity is multiplying; So there is one group
only.
0, 1, 2…11
Table 2. Types of catalytic activity distribution with different catalytic activity.
Heat and Mass Transfer – Modeling and Simulation
84
Fig. 14. Effects of
V
in
, n on X at different T
in
.
At lower inlet velocity such as
V
in
=0.1m·s
-1
, increment of methanol conversion X with n was
small, and nearly approached 100% at all temperatures excepted condition of
T
in
=453K and
n=0. This indicated that at lower inlet velocity, MSR was suffered from diffusion limitation,
so increasing of catalytic surface activity was non-effective to increment of methanol
conversion. However, with the increasing of
V
in
, effect of catalytic surface activity on
methanol conversion augmented, indicating a kinetics control effect on methanol
conversion. At condition of
T
in
=453 K, V
in
=1.0 m·s
-1
, increment of methanol conversion
reached 40% with
n. On the other hand, with the increase of inlet temperature, effects of
catalytic surface activity increment became unconspicuous; at condition of
T
in
=513 K,
V
in
=1.0 m·s
-1
, methanol conversion increased only 3.5% for n=11 compared with n=0.
Therefore, with the inlet temperature became higher and inlet velocity became slower, effect
of activity increment on methanol conversion became smaller. For example, at condition of
T
in
=513 K, V
in
=1.0 m·s
-1
, methanol conversion became stable when n reached 6; but at
condition of
T
in
=453 K, V
in
=1.0 m·s
-1
, methanol conversion became stable when n reached 9.
This indicated that with the increment of temperature, process of MSR changed from
kinetics control to diffusion limitation, and this should be considered when preparing the
catalytic coating.
For other types of catalytic activity distribution on discontinuous surfaces with different
activity (
D2, D3), results of comparing with D1 (n=0 and n=11 were selected) were shown in
Fig.15. It can be seen that at all conditions, sequence of methanol conversion is
D3>(D1,
n=11)>D2>(D1, n=0). When considering the catalytic surface activity cost of (D1,
n=0)<D2=D3<(D1, n=11), it was clear that, methanol conversion of the highest cost of
activity was not the biggest. At condition of
D3 distribution, its methanol conversion was
much greater than the others even if at high inlet velocities. And that activity cost of
D2 was
much lower than
D1, n=11 situation, but its methanol conversion was closed. Therefore,
through reasonable catalytic activity distribution, methanol conversion can be improved or
at the same conversion request, catalyst activity cost can be reduced. In this study, the
distribution of
D3 is the best, then comes D2.
Process Intensification of Steam Reforming for Hydrogen Production
85
Fig. 15. The effect of
V
in
, D on X at different T
in
.
It can also be seen from Fig. 15 that, with the increase of V
in
, X decreased, however, the trends
were different. For the distribution of
D1, n=0, the rate of decrement of X with increase of V
in
was changing from big to small for 453 K; and almost linear for 473 K, then small to big for 493
K and 513 K. However, for the other distribution as shown in Fig.15, trend of methanol
conversion decrement with increase of
V
in
was similar, it was changing from small to big. This
indicated that in the kinetics control, diffusion and heat transfer limitation mechanisms of MSR
process, it included at least two. At condition of
T
in
=453 K, V
in
=1.0 m·s
-1
, methanol conversion
for distribution of
D3 is greater than D1, n=0 for about 46%。
Fig. 16. Mass fraction of methanol (
Y
1
) and water (Y
2
) and optimal catalytic activity
distribution
T
in
=513 K, V
in
=1.0 m·s
-1
along the reaction channel.
From the analysis above we can draw a conclusion that, although methanol conversion can
be increased by increasing of catalyst activity, but cost of catalyst will be also increase. What
Heat and Mass Transfer – Modeling and Simulation
86
is more, as MSR process is a strongly endothermic reaction, if high active catalyst is
adopted, there will form a cold spot at inlet of the reactor. And this is obvious at condition
of reactor with bigger diameter and worse heat transfer, which finally will be harmful to the
catalyst and reactor. Therefore, by reasonable catalyst surface and activity distribution, not
only methanol conversion can be increased, but difference of cold spot temperature can also
be reduced. Consequently, the optimum catalyst activity distribution should be small at
reactor inlet, and gradually increase along the reactor, this is especially important for the
heterogeneous catalytic reaction with strong heat effect. For instance, at condition of
T
in
=513
K,
V
in
=1.0 m·s
-1
, as for the continuous catalyst surface distribution of D1, n=0, mass fraction
of methanol (
Y
1
) and water (Y
2
) were gradually decreased along the reaction channel, so the
optimum distribution of catalytic activity should be inverse with methanol (
Y
1
) and water
(
Y
2
) as shown in Fig.16.
5. Process intensification by reaction and system integration
5.1 Simulation method description
In this section, process of intensification of methanol steam reforming for hydrogen
production by system and reaction integration was designed and analyzed.
As for the system integration analysis, a sub-unit in the designed system as shown in Fig.17
was taken out for simulation. The reactor model included one reaction channel, one
intermediate platen to separate heating and reaction channel, one heating channel which
adopted hot air to simulate the heat from catalytic combustion; height of both channels is 0.5
mm, catalytic area is 72 mm
×42 mm, inlet and outlet diameters of the reactants and products
are 10 mm. Steady-state of the model was considered; heating medium of hot air and the
reactants were counter flow for heat exchange; outside surface of the unit is adiabatic;
gravity of the gases and the radiation heat transfer was also neglected. Kinetic model
adopted was the DE and SR parallel mechanism as used in section 2.2.
Fig. 17. Methanol steam reformer integration design and the catalytic layer plate.
Process Intensification of Steam Reforming for Hydrogen Production
87
As for the reaction analysis integration in methanol steam reforming system, methanol
steam reforming (MSR) process, water gas shift (WGS) process and CO selective oxidation
(PrOX) process were integrated in one reaction channel with respective catalyst coating as
shown in Fig.18. The reactants of methanol, water and oxygen can be supplied together
from the reactor inlet as was adopted in this study; or water and oxygen can be separately
supplied to WGS and PrOX section in the reactor. The postulated condition was the same as
the above reactor integration model; length of the total micro-channel is 12 mm and height is
0.5 mm; length of the three sections of the reactions was 4 mm respectively; both up and
down of the inner surface in the channel were coated with corresponding catalyst, and the
assumption of catalyst coating active to its own reaction only was made.
Fig. 18. Reaction integration model in one channel for MSR.
Kinetics of MSR reaction was parallel double rate mechanism model which includs steam
reforming (SR) and reverse water gas shift (RWGS)
[12]
; at the water gas shift section, single
rate model of water gas shift reaction was adopted with considering of its reverse reaction
[13]
; as for the CO selective oxidation model, the single rate model was also used
[14]
. The
reaction equation and its kinetics were listed below.
For the MSR reaction section:
CH
3
OH+H
2
O=CO
2
+3H
2
(12)
CO
2
+H
2
=CO+H
2
O (13)
32
0.60 0.4
exp( )
SR
SR SR CH OH H O
Ea
rk TC C
RT
(14)
22
2
exp( )
RWGS
RWGS RWGS CO H
Ea
rk TCC
RT
(15)
For the WGS reaction section:
CO+H
2
O
CO
2
+H
2
(16)
2
2
exp( ) (1 )
WGS
WGS WGS CO H O
Ea
rk TCC
RT
(17)
其中,
22
2
CO H
e
q
CO H O
PP
KP P
,
4577.8
exp( 4.33)
eq
K
T
For the PrOX reaction section:
Heat and Mass Transfer – Modeling and Simulation
88
CO+0.5O
2
=CO
2
(18)
2
1.02 0.68 0.34
Pr
Pr Pr
exp( )
OX
OX OX CO O
Ea
rk TCC
RT
(19)
All the parameters of the kinetics including the exponential factor
k and activation energy E
a
of each reaction were shown in Table3. The outer surface temperature was set to the reaction
temperature for each reaction section; but this simplification will be difficult in actual
process. The inlet temperature T
in
was set to the temperature of MSR reaction. Four groups
of temperatures were calculated, namely MSR-WGS-PrOX of 453K-393K-333K, 473K-413K-
353K, 493K-433K-373K, 513K-453K-393; also four groups of reactants inlet ratios
m
H2O
:m
CH3OH
:m
O2
were considered as the following: 0.399:0.6:0.0001, 0.449:0.55:0.001,
0.49:0.5:0.01 and 0.5:0.45:0.05; as for the inlet velocity
V
in
effects study, 0.4 m·s
-1
, 0.7 m·s
-1
,
1.0 m
·s
-1
, 1.3m·s
-1
were considered.
section reaction k/ mol·m
-2
·s
-1
Ea / J·kmol
-1
MSR
SR 2.46×10
6
7.6×10
7
RWGS
2.52×10
5
(453K)
1.08×10
8
RWGS
3.86×10
5
(473K)
1.08×10
8
RWGS
5.72×10
5
(493K)
1.08×10
8
RWGS
8.21×10
5
(513K)
1.08×10
8
WGS
WGS 8.12×10
7
4.74×10
7
RWGS
5.39×10
4
(333K)
4.74×10
7
RWGS
9.19×10
4
(353K)
4.74×10
7
RWGS
1.58×10
5
(373K)
4.74×10
7
RWGS
2.52×10
5
(393K)
4.74×10
7
PrOX PrOX 4.89×10
3
2.7×10
7
Table 3. Parameters of kinetic models.
5.2 Results and discussion
5.2.1 Microreactor integration simulation results
In calculation, inlet hot air temperature is 750 K and inlet velocity is 3 m/s. Effect of
different inlet parameters on outlet product molar fraction
F
m
, methanol conversion
X(MeOH) and outlet temperature T
out
was considered. The range of temperature T
in
of
reactants was 493K to 613 K; range of inlet velocity
V
in
was 0.144 m/s to 2.88 m/s; inlet
water methanol molar ratio was 1 to 1.6. The similar variation trend of increasing of
methanol conversion and hydrogen yield with inlet temperature was got because MSR
process is a strongly endothermic reaction; with the increase of inlet velocity, the contact
time of reactants with catalyst reduced, part of the reactants flowed out the reactor without
reaction which resulted in the lower conversion of methanol and respectively higher content
of methanol and water; similarly, with the increase of water and methanol molar ratio,
methanol conversion increased, however, hydrogen content in the products decreased as
shown in Fig.19 with constant inlet velocity of 2.88 m/s.
Process Intensification of Steam Reforming for Hydrogen Production
89
Analysis of outlet temperature showed that, it rarely changed with inlet temperature,
indicating that with the rise of inlet temperature, the absorption of heat by the reaction also
increased. With the increase of inlet velocity, although methanol conversion decreased, the
total mass of reactant reacted increased, therefore, at same heating condition, there formed a
temperature decrease of 4 K. When water and methanol molar ratio increased, there was a
fluctuation of the outlet temperature, this stated that water in the MSR system exist an
optimum value for the heat balance, it was about 1.3. To sum up, fluctuation of outlet
temperature with inlet parameter of reactants was small, so it was enough for the heat
needed supplied by hot air.
At condition of
V
in
=2.88 m/s, T
in
=493K, S/M=1.3, temperature distribution in the channel was
studied and a temperature drop was found at inlet of both hot air channel and reactant
reaction channel. This is consistent with the above study in section 1 for cold spot discussion.
Fig. 19. Methanol conversion with
S/M, T
in
(V
in
=2.88 m/s) and F
m
(H
2
) distribution in reaction
channel (
V
in
=2.88 m/s, T
in
= 493 K, S/M =1.3).
Based on the previous accounts, temperature in the reaction channel can be optimized by
properly coupling of inlet hot air temperature and reactant inlet temperature. Another way
to improve reactor performance is the altering of reactor sizes and catalytic surface and
activity distribution. At condition of
V
in
=2.88 m/s, T
in
= 493 K, S/M=1.3, methanol
conversion in the reactor was shown in Fig.19. The reactor outlet methanol conversion
reached 79.8%, so it can be seen that microreactor can maintain higher hydrogen molar
fraction and methanol conversion at high reactant flow rate.
5.2.2 Reaction integration simulation results
In this section, effects of inlet parameters such as inlet temperature T
in
, inlet velocity V
in
and
inlet water, methanol, oxygen mass fraction ratio
m
H2O
:m
CH3OH
:m
O2
on methanol conversion
X
CH3OH
, oxygen conversion X
O2
, outlet hydrogen and CO molar fraction F
H2
and F
CO
were
investigated. Results showed that,
X
CH3OH
decreased with inlet velocity, and increased with
methanol, oxygen mass fraction ratio; at condition of
T
in
=493 K, V
in
=0.4 m·s
-1
, it reached its
maximum value of 0.995; however, increasing of oxygen inlet mass fraction was
disadvantageous to outlet hydrogen content; at condition of
T
in
=453 K, V
in
=0.4 m·s
-1
and
m
H2O
:m
CH3OH
:m
O2
=0.3999:0.60:0.0001, F
H2
reached its maximum value.
Heat and Mass Transfer – Modeling and Simulation
90
The conversion of oxygen X
O2
was not the same with methanol; at water, methanol,
oxygen molar ratio of 0.3999:0.60:0.0001 and inlet temperature of 453 K,
X
O2
changed from
increase to decrease with inlet velocity and reached it maximum of 0.977 at
V
in
=0.4 m·s
-1
;
however, at inlet temperature of 493 K and 513K,
X
O2
decreased with inlet velocity; when
oxygen increased in the reactant to m
H2O
:m
CH3OH
:m
O2
of 0.449:0.55:0.001, at inlet
temperature of 453 K and 473 K,
X
O2
increased with inlet velocity; but, at temperature of
493 K and 513 K, it increased firstly and then decreased with
V
in
. At the other
m
H2O
:m
CH3OH
:m
O2
condition of 0.49:0.50:0.01 and 0.50:0.45:0.05, X
O2
increased with inlet
velocity; therefore inlet oxygen content in this reaction model is very sensitive and should
be carefully adjusted.
As for the CO outlet molar fraction F
CO
, it increased with inlet velocity at same temperature
and inlet component and this is not the same compared with MSR process. At condition of
T
in
=453 K, V
in
=0.4 m·s
-1
and m
H2O
:m
CH3OH
:m
O2
=0.50:0.45:0.05, minimum CO molar fraction
of 4.03×10
-9
was got. Because CO concentration limitation for PEMFC is below 50 ppm,
outlet of hydrogen molar fraction for the reformer should be increased to its greatest extent
in this CO requirement. In this study, the optimum condition was that
T
in
=453 K, V
in
=0.4
m·s
-1
and m
H2O
:m
CH3OH
:m
O2
=0.3699: 0.63:0.0001, at which methanol conversion reached
98.8%, oxygen conversion reached 15.2%, and outlet hydrogen molar fraction and CO molar
fraction were 74% and 3.43×10
-8
respectively.
At optimum condition of
T
in
, V
in
, and m
H2O
:m
CH3OH
:m
O2
, the component mass fraction along
the flow direction in the reactor channel was studied as shown in Fig.20.
Fig. 20. Mass fraction distribution along the reaction channel.
As can be seen from Fig.20, marginala oxygen from inlet of the reactor was mainly
consumed at the PrOX section, which received a conversion of only 15.2%; however, it was
just due to the marginala oxygen that CO reduced to 3.43×10
-8
from the MSR section outlet
of 0.152%. Through the WGS reaction section, CO reduced to 1.0×10
-5
, which was still
greater than the requirement of PEMFC. But the hydrogen content in the reactor after MSR
reaction section did not increased notably; After WGS reaction section, it only increased by
0.314% and even slightly reduced after the PrOX section.
6. Conclusions and challenges
1. Through the adoption of micro-reactors, cold spot effect of methanol steam reforming
for hydrogen production can be decreased compared with conventional reactors.
