Superconductivity Theory and Applications Part 3 pot
Bạn đang xem bản rút gọn của tài liệu. Xem và tải ngay bản đầy đủ của tài liệu tại đây (1.26 MB, 25 trang )
Coherent Current States in Two-Band Superconductors
39
two- and one- band superconductors have been studied recently in a number of articles
(Agterberg et al., 2002; Ota et al., 2009; Ng & Nagaosa, 2009). Another basic type of
Josephson junctions are the junctions with direct conductivity, S-C-S contacts (C –
constriction). As was shown in (Kulik & Omelyanchouk, 1975; Kulik & Omelyanchouk,
1978; Artemenko et al., 1979) the Josephson behavior of S-C-S structures qualitatively differs
from the properties of tunnel junctions. A simple theory (analog of Aslamazov-Larkin
theory( Aslamazov & Larkin, 1968)) of stationary Josephson effect in S-C-S point contacts for
the case of two-band superconductors is described in Sec.4).
2. Ginzburg-Landau equations for two-band superconductivity.
The phenomenological Ginzburg-Landau (GL) free energy density functional for two
coupled superconducting order parameters
1
and
2
can be written as
2
1212
,
8
GL
H
FFFF
Where
2
24
111 11 1
1
112
22
e
FiA
mc
(1)
2
24
222 22 2
2
112
22
e
FiA
mc
(2)
and
12
12 1 2 1 2
12
22
22
ee
iAiA
cc
F
ee
iAiA
cc
(3)
The terms
1
F
and
2
F
are conventional contributions from
1
and
2
, term
12
F
describes
without the loss of generality the interband coupling of order parameters. The coefficients
and
describe the coupling of two order parameters (proximity effect) and their
gradients (drag effect) (Askerzade, 2003a; Askerzade, 2003b; Doh et al., 1999), respectively.
The microscopic theory for two-band superconductors (Koshelev & Golubov, 2003;
Zhitomirsky & Dao, 2004; Gurevich, 2007) relates the phenomenological parameters to
microscopic characteristics of superconducting state. Thus, in clean multiband systems the
drag coupling term (
) is vanished. Also, on phenomenological level there is an important
condition , that absolute minimum of free GL energy exist:
12
1
2 mm
(see Yerin et al.,
2008).
Superconductivity – Theory and Applications
40
By minimization the free energy F=
2
3
1212
()
8
H
FFF dr
with respect to
1
,
2
and A
we obtain the differential GL equations for two-band superconductor
22
2
111111 2 2
1
22
2
222222 1 1
2
12 2
0
2
12 2
0
2
ee
iA iA
mc c
ee
iA iA
mc c
(4)
and expression for the supercurrent
1111 2222
12
12 21 12 21
22 2
22
12 1221
12
2
448
.
ie ie
j
mm
ie
ee e
A
mc mc c
(5)
In the absence of currents and gradients the equilibrium values of order parameters
1,2
(0)
1,2
1,2
i
e
are determined by the set of coupled equations
21
12
(0) (0) (0)
()
3
11
112
(0) (0) (0)
()
3
22
221
0,
0.
i
i
e
e
(6)
For the case of two order parameters the question arises about the phase difference
12
between
1
and
2
. In homogeneous zero current state, by analyzing the free
energy term F
12
(3), one can obtain that for 0
phase shift 0
and for 0
.
The statement, that
can have only values 0 or
takes place also in a current carrying
state, but for coefficient
0
the criterion for
equals 0 or
depends now on the value
of the current (see below).
If the interband interaction is ignored, the equations (6) are decoupled into two ordinary
GL equations with two different critical temperatures
1
c
T and
2
c
T . In general, independently
of the sign of
, the superconducting phase transition results at a well-defined temperature
exceeding both
1
c
T and
2
c
T , which is determined from the equation:
2
12
.
cc
TT
(7)
Let the first order parameter is stronger then second one, i.e.
12
cc
TT . Following
(Zhitomirsky & Dao, 2004) we represent temperature dependent coefficients as
11 1
2202 1
() (1 / ),
() (1 / ).
c
c
TaTT
Ta a TT
(8)
Phenomenological constants
1,2 20
,aa and
1,2
,
can be related to microscopic parameters
in two-band BCS model. From (7) and (8) we obtain for the critical temperature
c
T :
Coherent Current States in Two-Band Superconductors
41
2
2
20 20
1
2122
1.
22
cc
aa
TT
aaaa
(9)
For arbitrary value of the interband coupling
Eq.(6) can be solved numerically. For 0
,
1cc
TT and for temperature close to
c
T (hence for
2cc
TTT
) equilibrium values of the
order parameters are
(0)
2
() 0T
,
(0)
11 1
() (1 / )/
c
TaTT
. Considering in the following
weak interband coupling, we have from Eqs. (6-9) corrections
2
to these values:
2
(0)
2
1
1
11 20
20 2
2
(0)
2
1
2
2
1
20 2
11
() (1 ) ,
(1 )
() (1 ) .
((1))
cc
c
c
c
aT T
T
T
TTa
aa
T
aT
T
T
T
aa
T
(10)
Expanding expressions (10) over
(1 ) 1
c
T
T
we have conventional temperature
dependence of equilibrium order parameters in weak interband coupling limit
(0)
2
20 2
1
1
2
1
20 1
(0)
1
2
120
1
() 1 1 ,
2
() 1 .
c
c
aa
aT
T
T
aa
aT
T
aT
(11)
Considered above case (expressions (9)-(11)) corresponds to different critical temperatures
12
cc
TT in the absence of interband coupling
. Order parameter in the second band
(0)
2
arises from the “proximity effect” of stronger
(0)
1
and is proportional to the value of
.
Consider now another situation, which we will use in the following as the model case.
Suppose for simplicity that two condensates in current zero state are identical. In this case
for arbitrary value of
we have
12 12
1, .
c
T
TTTa
T
(12)
(0) (0)
12
.
(13)
2. Homogeneous current states and GL depairing current
In this section we will consider the homogeneous current states in thin wire or film with
transverse dimensions
1,2 1,2
(), ()dTT
, where
1,2
()T
and
1,2
()T
are coherence lengths
Superconductivity – Theory and Applications
42
and London penetration depths for each order parameter, respectively. This condition leads
to a one-dimensional problem and permits us to neglect the self-magnetic field of the
system. (see Fig.2) . In the absence of external magnetic field we use the calibration
0A
.
Fig. 2. Geometry of the system.
The current density
j and modules of the order parameters do not depend on the
longitudinal direction
x. Writing
1,2
()x
as
1,2 1,2 1,2
exp ( )ix
and introducing the
difference and weighted sum phases:
12
11 22
,
,cc
(14)
for the free energy density (1)-(3) we obtain
2424
11 11 22 22
22
2
12
2
12
12
22
2
12
22 2
21 1212
12
12
11
22
2cos
22
2cos
22
2cos.
F
d
mm dx
d
cc cc
mm dx
(15)
Where
22
12
12 12
12
12
22 22
12 12
12 12
12 12
2 cos 2 cos
,.
4cos 4cos
mm
cc
mm mm
(16)
The current density j in terms of phases
and
has the following form
22
12
12
12
24cos.
d
je
mm dx
(17)
Total current j includes the partial inputs
1,2
j and proportional to
the drag current
12
j .
In contrast to the case of single order parameter (De Gennes, 1966), the condition
j
0div does not fix the constancy of superfluid velocity. The Euler – Lagrange equations for
Coherent Current States in Two-Band Superconductors
43
()x
and ()x
are complicated coupled nonlinear equations, which generally permit the
soliton like solutions (in the case 0
they were considered in (Tanaka, 2002)). The
possibility of states with inhomogeneous phase
()x
is needed in separate investigation.
Here, we restrict our consideration by the homogeneous phase difference between order
parameters
const
. For const
from equations it follows that ()xqx
(q is total
superfluid momentum) and cos 0
, i.e.
equals 0 or
. Minimization of free energy for
gives
22
cos .sign q
(18)
Note, that now the value of
, in principle, depends on q, thus, on current density j. Finally,
the expressions (15), (17) take the form:
22
242 24 2
22
11 11 1 22 22 2
12
22 22
12
11
22 22
2,
Fq q
mm
qsignq
(19)
22
12
22
12
12
24 .je sign qq
mm
(20)
We will parameterize the current states by the value of superfluid momentum
q
, which for
given value of
j
is determined by equation (20). The dependence of the order parameter
modules on
q
determines by GL equations:
2
3
22222
11 11 1 2
1
0,
2
qqsignq
m
(21)
2
3
22222
22 22 2 1
2
0.
2
qqsignq
m
(22)
The system of equations (20-22) describes the depairing curve
,
jq
T
and the
dependences
1
and
2
on the current j and the temperature T. It can be solved
numerically for given superconductor with concrete values of phenomenological
parameters.
In order to study the specific effects produced by the interband coupling and dragging
consider now the model case when order parameters coincide at 0j
(Eqs. (12), (13)) but
gradient terms in equations (4) are different. Eqs. (20)-(22) in this case take the form
22 2 2
1112
22 2 2
2221
11 0
11 0
fffqfqsignq
ffkfqfqsignq
(23)
Superconductivity – Theory and Applications
44
22 2
12 12
2jfqkfq ffqsign q
(24)
Here we normalize
1,2
on the value of the order parameters at 0j
(13), j is measured in
units of
1
22e
m
,
q
is measured in units of
2
1
2m
,
,
1
2 m
,
1
2
m
k
m
.
If 1k
order parameters coincides also in current-carrying state
12
f
ff
and from eqs.
(23), 24) we have the expressions
22
2
1
1
fq
(25)
22
21 ,
jq f
si
g
n
(26)
which for 0
are conventional dependences for one-band superconductor (De
Gennes, 1966) (see Fig. 3 a,b).
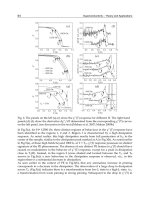
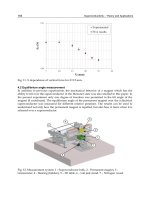
(a) (b)
Fig. 3. Depairing current curve (a) and the graph of the order parameter modules versus
current (b) for coincident order parameters. The unstable branches are shown as dashed
lines.
For 1k
depairing curve
j
q
can contain two increasing with q stable branches, which
corresponds to possibility of bistable state. In Fig. 4 the numerically calculated from
equations (23,24) curve
j
q
is shown for 5k
and 0
.
The interband scattering ( 0
) smears the second peak in
jq
, see Fig.5.
If dragging effect ( 0
) is taking into account the depairing curve
jq
can contain the
jump at definite value of
q
(for 1k
see eq. 34), see Fig.6. This jump corresponds to the
switching of relative phase difference from 0 to
.
Coherent Current States in Two-Band Superconductors
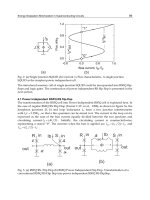
45
Fig. 4. Dependence of the current
j
on the superfluid momentum
q
for two band
superconductor. For the value of the current
0
jj
the stable (
) and unstable (
) states are
depicted. The ratio of effective masses 5k
, and 0
.
Fig. 5. Depairing current curves for different values of interband interaction: 0
(solid
line), 0.1
(dotted line) and 1
(dashed line). The ratio of effective masses 5k , and
0
.
Superconductivity – Theory and Applications
46
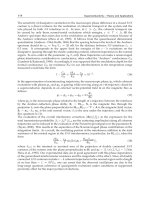
Fig. 6. Depairing current curves for different values of the effective masses ratio 1k
(solid
line), 1.5k
(dotted line) and 5k
(dashed line). The interband interaction coefficient
0.1
and drag effect coefficient 0.5
.
4. Little-Parks effect for two-band superconductors
In the present section we briefly consider the Little–Parks effect for two-band
superconductors. The detailed rigorous theory can be found in the article (Yerin et al., 2008).
It is pertinent to recall that the classical Little–Parks effect for single-band superconductors
is well-known as one of the most striking demonstrations of the macroscopic phase
coherence of the superconducting order parameter (De Gennes, 1966; Tinkham, 1996). It is
observed in open thin-wall superconducting cylinders in the presence of a constant external
magnetic field oriented along the axis of the cylinder. Under conditions where the field is
essentially unscreened the superconducting transition temperature
c
T
(
is the magnetic
flux through the cylinder) undergoes strictly periodic oscillations (Little–Parks oscillations)
2
0
min( ),( 0,1,2, ),
cc
c
TT
nn
T
(27)
where
0cc
TT
and
0
/ce
is the quantum of magnetic flux.
How the Little–Parks oscillations ( 27) will be modified in the case of two order parameters
with taking into account the proximity (
) and dragging (
) coupling? Let us consider a
superconducting film in the form of a hollow thin cylinder in an external magnetic field
H
(see Fig.6).
We proceed with free energy density (19), but now the momentum
q
is not determined by
the fixed current density
j as in Sec.3. At given magnetic flux Adl Hd
the
superfluid momentum
q
is related to the applied magnetic field
Coherent Current States in Two-Band Superconductors
47
0
1
.qn
R
(28)
At fixed flux
the value of
q
take on the infinite discrete set of values for 0, 1, 2, n
. The
possible values of n are determined from the minimization of free energy
12
[,,]F
q
. As a
result the critical temperature of superconducting film depends on the magnetic field. The
dependencies of the relative shift of the critical temperature
()/
ccc c
tTT T
for different
values of parameters , ,R
were calculated in (Yerin et al., 2008). The dependence of ()
c
t
as in the conventional case is strict periodic function of
with the period
0
(contrary to the
assertions made in Askerzade, 2006). The main qualitative difference from the classical case is
the nonparabolic character of the flux dependence
()
c
t
in regions with the fixed optimal
value of n . More than that, the term
22 22
qsign q
in the free energy (19)
engenders possibility of observable singularities in the function
()
c
t
, which are completely
absent in the classical case (see Fig.8.).
Fig. 7. Geometry of the problem.
Fig. 8.
()
c
t for the case where the bands 1 and 2 have identical parameters and values of
are indicated.
Superconductivity – Theory and Applications
48
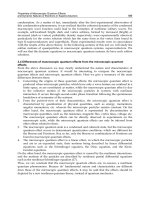
5. Josephson effect in two-band superconducting microconstriction
In the Sec.3 GL-theory of two-band superconductors was applied for filament’s length
L . Opposite case of the strongly inhomogeneous current state is the Josephson
microbridge or point contact geometry (Superconductor-Constriction-Superconductor
contact), which we model as narrow channel connecting two massive superconductors
(banks). The length
L and the diameter d of the channel (see Fig. 9) are assumed to be
small as compared to the order parameters coherence lengths
12
,
.
Fig. 9. Geometry of S-C-S contact as narrow superconducting channel in contact with bulk
two-band superconductors. The values of the order parameters at the left (L) and right (R)
banks are indicated
For dL we can solve one-dimensional GL equations (4) inside the channel with the rigid
boundary conditions for order parameters at the ends of the channel.
In the case
12
,L
we can neglect in equations (4) all terms except the gradient ones and
solve equations:
2
1
2
2
2
2
=0,
0
d
dx
d
dx
(29)
with the boundary conditions:
1011
0exp
L
i
,
2021
0exp,
R
i
(30)
1012
exp
L
Li
,
2021
exp .
R
Li
Calculating the current density
j in the channel we obtain:
11 22 12 21
jj j j j
, (31)
2
11 01 1 1
1
2
sin ,
RL
e
j
Lm
2
22 01 2 2
1
2
sin ,
RL
e
j
Lm
Coherent Current States in Two-Band Superconductors
49
12 01 02 1 2
4
sin ,
RL
e
j
L
21 02 01 2 1
4
sin .
RL
e
j
L
The current density
j (31) consists of four partials inputs produced by transitions from left
bank to right bank between different bands. The relative directions of components
ik
j
depend on the intrinsic phase shifts in the banks
12
LLL
and
12
RRR
(Fig.10).
Fig. 10. Current directions in S-C-S contact between two-band superconductors. (a) – there is
no shift between phases of order parameters in the left and right superconductors; (b) - there
is the
-shift of order parameters phases at the both banks ; (c) –
-shift is present in the
right superconductor and is absent in the left superconductor; (d) –
-shift is present in the
left superconductor and is absent in the right superconductor .
Superconductivity – Theory and Applications
50
Introducing the phase difference on the contact
11
RL
we have the current-phase
relation
()j
for different cases of phase shifts
,RL
in the banks:
a.
0
RL
22
01 02
01 02
12
2
sin ( 4 )sin
c
e
jj
Lm m
b.
RL
22
01 02
01 02
12
2
sin ( 4 )sin
c
e
jj
Lm m
c.
,0
RL
22
01 02
12
2
sin ( )sin
c
e
jj
Lm m
d.
0,
RL
22
01 02
12
2
sin ( )sin
c
e
jj
Lmm
The critical current
c
j
in cases a) and b) is positively defined quadratic form of
01
and
02
for
12
1
2 mm
. In cases c) and d) the value of
c
j can be negative. It corresponds to
the so-called
junction (see e.g. (Golubov et. al, 2004)) (see illustration at Fig.11).
Fig. 11. Current-phase relations for different phase shifts in the banks.
This phenomenological theory, which is valid for temperatures near critical temperature
c
T
,
is the generalization of Aslamazov-Larkin theory (Aslamazov & Larkin, 1968) for the case of
two superconducting order parameters. The microscopic theory of Josephson effect in S-C-S
junctions (KO theory) was developed in (Kulik & Omelyanchouk, 1975; Kulik &
Coherent Current States in Two-Band Superconductors
51
Omelyanchouk, 1978;) by solving the Usadel and Eilenberger equations (for dirty and clean
limits). In papers (Omelyanchouk & Yerin, 2009; Yerin & Omelyanchouk, 2010) we
generalized KO theory for the contact of two-band superconductors. Within the microscopic
Usadel equations we calculate the Josephson current and study its dependence on the
mixing of order parameters due to interband scattering and phase shifts in the contacting
two-band superconductors. These results extend the phenomenological theory presented in
this Section on the range of all temperatures
0
c
TT
. The qualitative feature is the
possibility of intermediate between sin
and sin
behavior ()j
at low temperatures
(Fig.12).
Fig. 12. The possible current-phase relations
()j
for hetero-contact with 0,
RL
.
6. Conclusion
In this chapter the current carrying states in two-band superconductors are described in the
frame of phenomenological Ginzburg-Landau theory. The qualitative new feature, as
compared with conventional superconductors, consists in coexistence of two distinct
complex order parameters
1
and
2
. It means the appearing of an additional internal
degree of freedom, the phase shift between order parameters. We have studied the
implications of the
-shift in homogeneous current state in long films or channels, Little-
Parks oscillations in magnetic field, Josephson effect in microconstrictions. The observable
effects are predicted. Along with fundamental problems, the application of two band
superconductors with internal phase shift in SQUIDS represents significant interest (see
review (Brinkman & Rowell, 2007).
7. Acknowledgment
The author highly appreciates S. Kuplevakhskii and Y.Yerin for fruitful collaborations and
discussions. The research is partially supported by the Grant 04/10-N of NAS of Ukraine.
Superconductivity – Theory and Applications
52
8. References
Agterberg D. F., Demler E., & Janko B. (2002). Josephson effects between multigap and
single-gap superconductors, Phys. Rev. B, V.66, Iss.21, p.214507.
Artemenko S. N., Volkov A. F. & Zaitsev A. V. (1979). Theory of nonstationary Josephson
effect in short superconducting junctions, Zh. Eksp. Teor. Fiz., V. 76, No.5, p.1816-
1833.
Ashcroft N. W. (2000). The Hydrogen Liquids. J. Phys.: Condens. Matter, V.12, No.8A, p.
A129-A137.
Askerzade I. N. (2003). Temperature dependence of the London penetration depth of
YNi2B2C borocarbids using two-band Ginzburg-Landau theory. Acta Physica
Slovaca, V.53, No. 4, p.321-327.
Askerzade I. N. (2003). Ginzburg–Landau theory for two-band s-wave superconductors:
application to non-magnetic borocarbides LuNi2B2C, YNi2B2C and magnesium
diboride MgB2. Physica C, V.397, Iss.3-4, p.99-111.
Askerzade I. N. (2006). Ginzburg-Landau theory: the case of two-band superconductors.
Usp. Fiz. Nauk, V.49, Iss.10, p.1003-1016.
Aslamazov L.G. & Larkin A.I. (1969). The Josephson effect in point superconducting
junctions. Pis’ma Zh. Eksp. Teor. Fiz., V.9, No.2, p.150-154.
Babaev E. (2002). Vortices with Fractional Flux in Two-Gap Superconductors and in
Extended Faddeev Model. Phys. Rev. Lett., V.89, Iss. 89, p.067001.
Babaev E., Faddeev L. D. & Niemi A. J. (2002). Hidden symmetry and knot solitons in a
charged two-condensate Bose system. Phys. Rev. B, V.65, Iss.10, p.100512(R).
Babaev E., Sudbo A. & Ashcroft N. W. (2004). A superconductor to superfluid phase
transition in liquid metallic hydrogen. Nature, V.431, No. 7009, p.666-668.
Brinkman A., Golubov A. A., Rogalla H., Dolgov O. V., Kortus J., Kong Y., Jepsen O. &
Andersen O. K. (2002). Multiband model for tunneling in MgB2 junctions. Phys.
Rev.B, V.65, Iss.18, p.180517(R).
Brinkman A. & Rowell J. (2007). MgB2 tunnel junctions and SQUIDs. Physica C, 456, p.188-
195.
Dahm T., Graser S. & Schopohl N. (2004). Fermi surface topology and vortex state in MgB2.
Physica C, V.408-410, p.336-337.
Dahm T. & Schopohl N. (2003). Fermi Surface Topology and the Upper Critical Field in
Two-Band Superconductors: Application to MgB2. Phys. Rev. Lett., V.91, Iss. 1,
p.017001.
De Gennes P. G. (1966). Superconductivity of Metals and Alloys, Benjamin, ISBN 0738201014,
New York.
Doh H., Sigrist M., Cho B.K. & Lee S.I. (1999). Phenomenological Theory of
Superconductivity and Magnetism in Ho1-xDyxNi2B2C. Phys. Rev. Lett., V.83,
Iss.25, p.5350-5353.
Giubileo F., Roditchev D., Sacks W., Lamy R., Thanh D.X., Klein J., Miraglia S., Fruchart D.,
Marcus J. & Monod P. (2001). Two-Gap State Density in MgB2: A True Bulk
Property Or A Proximity Effect? Phys. Rev. Lett., V.87, Iss.17, p.177008.
Golubov A. A., Kortus J., Dolgov O. V., Jepsen O., Kong Y., Andersen O. K., Gibson B. J.,
Ahn K. & Kremer R. K. (2002). Specific heat of MgB2 in a one- and a two-band
model from first-principles calculations. J. Phys.: Condens. Matter, V.14, No.6,
p.1353-1361.
Coherent Current States in Two-Band Superconductors
53
Golubov A. A. & Koshelev A. E. (2003). Upper critical field in dirty two-band
superconductors: Breakdown of the anisotropic Ginzburg-Landau theory. Phys.
Rev. B, V.68, Iss.10, p.104503.
Golubov A. A., Kupriyanov M. Yu. & Il’ichev E. (2004). The current-phase relation in
Josephson junctions. Rev. Mod. Phys., V.76, Iss.2, p. 411–469.
Golubov A. A. & Mazin I. I. (1995). Sign reversal of the order parameter in s wave
superconductors. Physica C, V.243, Iss.1-2, p.153-159.
Gurevich A. (2003). Enhancement of the upper critical field by nonmagnetic impurities in
dirty two-gap superconductors, Phys. Rev. B, V.67, Iss.18, p.184515.
Gurevich A. (2007). Limits of the upper critical field in dirty two-gap superconductors.
Physica C, V. 456, Iss. 1-2, p.160-169.
Gurevich A. & Vinokur V.M. (2003). Interband Phase Modes and Nonequilibrium Soliton
Structures in Two-Gap Superconductors. Phys. Rev. Lett., V.90, Iss.4, p.047004.
Gurevich A. & Vinokur V. M. (2006). Phase textures induced by dc-current pair breaking in
weakly coupled multilayer structures and two-gap superconductors, Phys. Rev.
Lett., V.97, Iss.13, p.137003.
Iavarone M., Karapetrov G., Koshelev A.E., Kwok W.K., Crabtree G.W., Hinks D.G., Kang
W.N., Choi E M., Kim H.J. & Lee S.I. (2002). Two-Band Superconductivity in
MgB2. Phys. Rev. Lett., V.89, Iss.18, p.187002.
Jourdan M., Zakharov A., Foerster M. & Adrian H. (2004). Evidence for Multiband
Superconductivity in the Heavy Fermion Compound UNi2Al3. Phys. Rev. Lett.,
V.93, Iss.9, p.097001.
Kamihara Y., Watanabe T., Hirano M. & Hosono H. (2008). Iron-based layered
superconductor La[O(1-x)F(x)]FeAs (x = 0.05-0.12) with T(c) = 26 K. J. Am. Chem.
Soc., V.130, Iss.11, p.3296-3297.
Kortus J., Mazin I. I., Belashchenko K. D., Antropov V. P. & L. L. Boyer (2001).
Superconductivity of Metallic Boron in MgB2. Phys. Rev. Lett., V.86, Iss.20, p.4656.
Koshelev A. E. & Golubov A. A. (2003). Mixed state of a dirty two-band superconductor:
pplication to MgB2, Phys. Rev. Lett., V.90, Iss.17, p.177002.
Kresin V. Z. & Wolf S. A (1990). Multigap structure in cuprates. Physica C, V.169, Iss.5-6,
p.476–484.
Kulik I. О. & Omelyanchouk A. N. (1975). Microscopic theory of Josephson effect in
superconducting microbridges, Pis’ma Zh. Eksp. Teor. Fiz., V.21, No.4, p.216-
219.Kulik I. О. & Omelyanchouk A. N. (1978). Josephson effect in superconducting
bridges:
microscopic theory, Fiz. Nizk. Temp., V.4, No.3, p.296-311.
Leggett J. (1966). Number-phase fluctuations in two-band superconductors. Progr. Theor.
Phys., V.36, No. 5, pp. 901-930.
Mazin I. I., Andersen O. K., Jepsen O., Dolgov O. V., Kortus J., Golubov A. A., Kuz’menko
A. B. & van der Marel D. (2002). Superconductivity in MgB2: Clean or Dirty? Phys.
Rev. Lett., V.89, Iss.10, p.107002.
Mints R. G., Papiashvili I., Kirtley J. R., Hilgenkamp H., Hammerl G. & Mannhart J. (2002).
Observation of Splintered Josephson Vortices at Grain Boundaries in YBa2Cu3O7-
δ.
Phys. Rev. Lett., V.89, Iss.6, p.067004.
Superconductivity – Theory and Applications
54
Miranovic P., Machida K. & Kogan V. G. (2003). Anisotropy of the Upper Critical Field in
Superconductors with Anisotropic Gaps: Anisotropy Parameters of MgB2. J. Phys.
Soc. Jpn., V.72, No.2, p.221-224.
Moskalenko V.A. (1959). Superconductivity of metals within overlapping energy bands. Fiz.
Met. Metallov., V.8, p.503-513.
Nagamatsu J., Nakagawa N., Muranaka T., Zenitani Y. & Akimitsu J. (2001),
Superconductivity at 39 K in magnesium diboride. Nature, V.410, No.6824, p.63-64.
Nakai A., Ichioka M. & Machida K. (2002). Field Dependence of Electronic Specific Heat in
Two-Band Superconductors. J. Phys. Soc. Jpn., V.71, No.1, p.23-26.
Ng T. K. & Nagaosa N. (2009). Broken time-reversal symmetry in Josephson junction
involving two-band superconductors, EPL V.87, No.1, p.17003.
Omelyanchouk A.N. & Yerin Y.S. (2010). Josephson effect in point contacts between two-
band superconductors. In: Physical Properties of Nanosystems, Bonca J. & Kruchinin
S., pp. 111-119, Springer, ISBN: 978-94-007-0043-7, Berlin.
Ota Y., Machida M., Koyama T. & Matsumoto H. (2009). Theory of heterotic
superconductor-insulator-superconductor Josephson junctions between single- and
multiple-gap superconductors, Phys. Rev. Lett., V.102, Iss.23, p.237003.
Schmidt H., Zasadzinski J.F., Gray K.E. & Hinks D.G. (2001). Evidence for Two-Band
Superconductivity from Break-Junction Tunneling on MgB2. Phys. Rev. Lett., V.88,
Iss.12, p.127002.
Seyfarth G., Brison J. P., Méasson M A., Flouquet J., Izawa K., Matsuda Y., Sugawara H. &
Sato H. (2005). Multiband Superconductivity in the Heavy Fermion Compound
PrOs4Sb12. Phys. Rev. Lett., V.95, Iss. 10, p.107004.
Shulga S. V., Drechsler S L., Fuchs G., Müller K H., Winzer K., Heinecke M. & Krug K.
(1998). Upper Critical Field Peculiarities of Superconducting YNi2B2C and
LuNi2B2C. Phys. Rev. Lett., V.80, Iss.8, p.1730-1733.
Suhl H., Matthias B.T. & Walker L.R. (1959), Bardeen-Cooper-Schrieffer Theory of
Superconductivity in the Case of Overlapping Bands. Phys. Rev. Lett., V.3, Iss.12, p.
552-554.
Szabo P., Samuely P., Kacmarcik J., Klein T., Marcus J., Fruchart D., Miraglia S., Mercenat C.,
& Jansen A.G.M. (2001). Evidence for Two Superconducting Energy Gaps in MgB2
by Point-Contact Spectroscopy. Phys. Rev. Lett., V.87, Iss.13, p.137005.
Tanaka Y. (2002). Soliton in Two-Band Superconductor. Phys. Rev. Lett., V.88, Iss.1,
p.017002.Tinkham M. (1996). Introduction to Superconductivity, McGraw-Hill, ISBN
0-07-064878-6, New York.
Yanson I. K. & Naidyuk Yu. G. (2004), Advances in point-contact spectroscopy: two-band
superconductor MgB2. Low Temp.Phys., V.30, Iss.4, p.261-275.
Yerin Y. S., Kuplevakhskii S. V. & Omelyanchuk A. N. (2008). Little–Parks effect for two-
band superconductors. Low Temp. Phys., V.34, Iss.11, p.891-898.
Yerin Y. S. & Omelyanchouk A. N. (2010). Josephson currents in point contacts between
dirty two-band superconductors. Low Temp. Phys., V.36, Iss.10, p.969-974.
Zhitomirsky M. E. & Dao V H. (2004). Ginzburg-Landau theory of vortices in a multigap
superconductor, Phys. Rev. B, V.69, Iss.5, p.054508.
4
Nonlinear Response of the
Static and Dynamic Phases
of the Vortex Matter
S. S. Banerjee
1
, Shyam Mohan
1
, Jaivardhan Sinha
1
,
Yuri Myasoedov
3
, S. Ramakrishnan
2
and A. K. Grover
2
1
Department of Physics, Indian Institute of Technology Kanpur, Uttar Pradesh
2
Department of Condensed Matter Physics and Materials Science,
Tata Institute of Fundamental Research, Mumbai,
3
Department of Physics, Weizmann Institute of Science, Rehovot,
1,2
India
3
Israel
1. Introduction
In the mixed state of type II superconductors, the external magnetic field penetrates the
superconducting material in the form of normal cored regions, each carrying a quantum
of flux (Φ
0
= 2.07×10
-7
G-cm
2
). These normal cores have radii equal to the coherence length
(ξ). Surrounding each normal core is a vortex of supercurrent that decays over a
characteristic length scale known as the penetration depth (λ). These elastic string-like
normal entities (or vortices) mutually repel each other leading to the formation of
triangular vortex lattices in ideal superconductors (Blatter et al., 1994; Natterman &
Scheidl, 2000). However, real samples always have defects (point defects, dislocations)
and inhomogeneities. The superconducting order parameter is preferentially suppressed
at these random defect locations, thereby energetically favoring pinning of vortices at
these locations. But, pinning also leads to loss of long range order in the vortex lattice. The
vortex matter can be considered as a typical prototype for soft materials, where pinning
forces and thermal fluctuations are comparable to the elastic energy scale of the vortex
lattice. The perennial competition between elastic interactions in the vortex lattice, which
establishes order in the vortex state and effects of pinning and thermal fluctuations which
try to destabilize the vortex lattice, leads to a variety of pinning regimes, viz., the weak
collective pinning regime and the strong pinning regime (Blatter et al., 2004). The
competition in different portions of the field-temperature (H,T) phase space leads to the
emergence of a variety of vortex phases, like, the Bragg glass, vortex glass, vortex liquid
(for review see, Blatter et al., 1994; Natterman & Scheidl, 2000) and transformation
amongst them, along with the appearance of significant thermomagnetic history
dependent response. The competing effects ever present in the vortex lattice also lead to a
quintessential phenomenon called the peak effect (PE), which we shall discuss in the next
section.
Superconductivity – Theory and Applications
56
2. The peak effect phenomenon
Theoretical works in late nineteen eighties and nineties have shown that by taking into
account the effects of thermal fluctuations and pinning centers on vortices, the mean field
description of a type II superconductor gets substantially modified and new phases and
phase boundaries in the vortex matter were predicted. In particular, in a clean pinning free
system, it was shown that under the influence of thermal fluctuations, the vortex lattice
phase is stable only in the intermediate field range. A new phase was predicted to be
present at both very low and at very high fields, viz., the Vortex Liquid State (Nelson, 1988),
in which the r.m.s, fluctuation of the vortices about their mean positions become ~10 – 20 %
of the intervortex spacing a
0
(a
0
B
1/2
, where B is the field) and the vortex-vortex spatial
correlations reduced down length scales of the order ~ a
0
. Experimental works on the high
temperature superconductors (HTSC) have established the vortex solid to liquid transition
at high fields, however, the demonstration of the reentrant behavior of the vortex solid to
liquid phase boundary has so far not been vividly elucidated (Blatter et al, 1998; Natterman
& Scheidl, 2000). The mean field picture of a perfectly periodic arrangement of vortices in
the vortex solid phase is also expected to be modified under the influence of pinning and the
vortex solid phase is considered to behave like a vortex glass (Fisher 1989; Fisher, et al.
1989), which is characterized by zero linear resistivity, and could exhibit many metastable
states. Further detailed investigations (Giammarchi and P. Le Doussal, 1995), showed, the
existence of a novel vortex solid to solid transformation as a function of varying field at a
fixed temperature in which a novel Bragg Glass phase (a reasonably well ordered lattice
with correlation extending over few hundreds of a
0
) at low fields transforms into a Vortex
Glass state with spatial correlations surviving over a very short range at high fields. This
solid to solid transformation is considered to arise due to a sudden injection / proliferation
of dislocations into the Bragg glass phase (for a review see Natterman & Scheidl, 2000).
Fig. 1. Schematic representation of the peak effect (PE) in the critical current density, J
c
, with
applied field (or temperature). The field H
p
(or temperature T
p
) represents the peak position
of the PE.
To experimentally investigate the phases of vortex matter, few popular routes are via ac
susceptibility, dc magnetization, transport measurements, all of which provide information
on the critical current density (J
c
) (the maximum dissipationless current which is carried by
a superconductor). Usually a change in the phase of vortex matter is accompanied by a
change in the pinning experienced by the vortices. As the J
c
is a direct measure of the
pinning experienced by a given phase, changes in the behavior of J
c
are a good indicator of
the transformation/transition in the vortex matter. Usually the J
c
of a superconductor is
expected to monotonically decrease with increasing values of the temperature or field.
However, in a large variety of superconductors it is found that the monotonic decrease in J
c
Nonlinear Response of the Static and Dynamic Phases of the Vortex Matter
57
with increasing field (H) or temperature (T) is interrupted by an anomalous enhancement in
J
c
just before the superconductor turns normal (Figure.1). This anomaly in the J
c
behavior is
known as the peak effect (PE) phenomenon and has been observed in many low and high-
temperature superconductors (Berlincourt, 1961; Bhattacharya & Higgins, 1993; Higgins and
Bhattacharya, 1996; Ling et al., 2001; Ghosh et al., 1996; Banerjee et al., 1998, 1999a, 1999b,
2000a, 2000b, 2001). In electrical transport experiments, from which J
c
is deduced, the PE
appears as a bump in J
c
as in the schematic of Fig.1. Due to the enhancement in pinning, the
PE appears as an anomalous increase of the diamagnetic screening or shielding response
and a drop in the dissipation response in the ac susceptibility (quadrature signal)
measurements before the diamagnetic ac-susceptibility (in -phase signal) crashes to zero at
H
c2
or T
c
(H) (Banerjee et al., 1998-2001; Mohan et al., 2007).
Though a complete theoretical description of the PE is lacking, there have been plausible
proposals articulating different mechanisms to explain this phenomenon. Pippard (Pippard,
1969) put forth the notion that if the vortex lattice (VL) loses rigidity near H
c2
at a rate much
faster than the pinning force, then the softened vortices would conform more easily to the
pinning centers thereby getting strongly pinned, and consequently producing the peak in J
c
.
The idea acquired a quantitative basis, when a correct statistical summation procedure for the
pinning force was proposed by A. I. Larkin and Yu. N. Ovchinnikov (LO) (Larkin, 1970a,
1970b; Larkin and Ovchinnikov, 1979), which took into account the elasticity of the vortex
lattice. The basic premise of the LO theory is that the flux lines lower their free energy by
passing through the pinning sites, thereby deviating from an ideal periodic arrangement. The
deformation of the FLL costs elastic energy despite the lowering in free energy due to the
pinning of flux lines. The equilibrium configuration of the flux lines in a deformed state is
obtained by minimizing the sum of these two energies. This work of Larkin and Ovchinnikov
showed that random distribution of weak pins destroys long range order in the FLL, with
short range order being preserved only within a volume bounded by two correlation lengths
viz., the radial (R
c
, the correlation length across the surface of the sample and perpendicular to
the vortex line) and the longitudinal (L
c
, the correlation length parallel to the vortex line).
These length scales were shown to be related to the elastic modulii of the vortex lattice (Larkin
and Ovchinnikov, 1979), and the net pinning force experienced by the VL, viz., F
p
cc
RL
,
where
and
are positive powers. The PE stood explained within the LO theory due to
softening of the elastic modulii of the VL, which caused a decrease in R
c
and L
c
, thereby
causing F
p
or J
c
to anomalously increase at PE. While the LO theory provides an explanation
of the PE phenomenon, a quantitative match of the details of the PE with LO theory lacked.
While theoretically some difference persist as regards the origin of the PE phenomenon, the
experimental investigations (Banerjee et al., 1998, 1999a, 1999b, 2000a, 2000b, 2001;
Bhattacharya & Higgins, 1993; Gammel et al., 1998; Ghosh et al, 1996; Higgins and
Bhattacharya, 1996; Marchevsky et al., 2001; Thakur et. al, 2005, 2006; Troyanovski et al.,
1999, 2002) are almost concurrent towards in establishing PE as an order to disorder
transformation in the vortex lattice. Studies (Banerjee et al, 1998, 1999a, 1999b, 2000a,b, 2001)
on different single crystals of 2H-NbSe
2
, with progressively increasing amounts of the
quenched random pinning have revealed that the details of PE phenomenon are
significantly affected by level of disorder, amounting to the appearance of significant
variation in the metastable response(s) of the vortex lattice. These studies were able to
demonstrate the correlation between the thermomagnetic history effects (i.e., difference
Superconductivity – Theory and Applications
58
between the field cooled (FC) and zero - field cooled (ZFC) response exhibited by the FLL in
single crystal of a conventional superconductor 2H-NbSe
2
and the pinning strength in the
samples (Banerjee et al, 1999b). These observations lead to proposals pertaining to the
existence of a pinning induced transformation across glassy phases of the vortex matter. In
recent times an interesting explanation for PE has been proposed based on a crossover from
weak to collective pinning in the vortex matter (Blatter et al. 2004). We shall discuss this
work in relation to the experimental findings in section 3.3.
2.1 The effect of disorder on the behavior of critical current (J
c
) and the peak effect
(PE) phenomenon
2.1.1 Single crystals of different pinning strengths
We are collating here results reported on good quality single crystals of 2H-NbSe
2
, grown in
different laboratories (University of Warwick, UK, NEC research Institute, Princeton, USA
and Bell Labs, Murray Hills, USA). On the basis of correlation between pinning strength
and the metastability effects in the elastic region of vortex phase diagram, the crystals can be
sequentially enumerated in terms of the progressively enhanced pinning. For instance, in
2H-NbSe
2
crystals, ranging from nomenclature A to C, the J
c
values vary from 10 A/cm
2
to
1000 A/cm
2
(Banerjee et al., 1998, 1999a, 1999b, 2000a, 2000b, 2001; Thakur et al. 2005, 2006).
2.1.2 Identification of different pinning regimes and the behavior of PE as a function
of pinning
We extracted J
c
(H) (for H//c) in two varieties of single crystals A and B, of 2H-NbSe
2
, either
by directly relating J
c
(H) to the widths of the isothermal magnetization hysteresis loops
(Bean, 1962, 1964) or by analyzing the in-phase and out-of-phase ac susceptibility data
(Bean, 1962, 1964; Angurel et al., 1997). Figure 2 summarizes the J
c
vs. H data (H\\c) for the
crystals A and B in two sets of log-log plots in the temperature regions close to the
respective T
c
(0) values (Banerjee, 2000b; Banerjee et al. 2001). The peaks in J
c
(H) occur at
fields (H
p
) less than 1 kOe (see insets in Fig.2(c) and Fig.2(g) for the t
p
(H) curves in A and B,
viz., locus of the PE in the H - reduced temperature (t = T/T
c
(0)) space for the two samples,
with pinning strength in B > A).
We first focus on the shapes of the J
c
(H) curves (cf. Fig.2(a) to 2(d)) in the crystal A. In
Fig.2(a), the three regimes (marked I, II and III in the figure) of J
c
(H), at a reduced
temperature t~0.973, are summarized as follows : (1) At the lowest fields (H 10 Oe), J
c
varies weakly with H (region I), as expected in the individual pinning or small bundle
pinning regime, noted earlier (Duarte et al. 1996), (2) Above a threshold field value, marked
by an arrow, J
c
(H) variation (in region II) closely follows the archetypal collective pinning
power law (Duarte et al. 1996, Larkin, 1970a, 1970b; Larkin and Ovchinnikov, 1979)
dependence (see the linear behaviour in region II of J
c
vs. H on log-log scale in Fig.2), (3)
This power law regime terminates at the onset (marked by another arrow) position of the PE
phenomenon (region III).
On increasing the temperature (see Figs. 2(a) and 2(b) for the data at t=0.973 and 0.994), the
following trends are immediately apparent: (1) the peak effect becomes progressively
shallower, i.e., the ratio of J
c
(H) at the peak position to that at the onset of PE becomes
smaller. For instance, the said ratio has a value of about 8 at t=0.973 and it reduces to a value
of 3.5 at t=0.994. ; (2) The power law region shrinks; for example, the field interval between
the pair of arrows (identifying the power law region) spans from 10 Oe to about 500 Oe at
Nonlinear Response of the Static and Dynamic Phases of the Vortex Matter
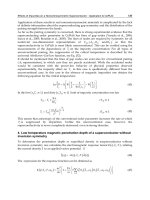
59
Fig. 2. Log-Log plots of J
c
vs. H for H\\c at selected reduced temperatures (t = T/T
c
(0)) in
crystals A and B of 2H- NbSe
2
. The insets in Fig.2(c) and Fig.2(g) display the locus of PE
curve, t
p
(H)(=T
p
(H)/T
c
(0)) and the superconductor-normal phase boundary
t
c
(H)(=T
c
(H)/Tc(0)) in crystals A and B, respectively. The marked data points on the PE
curves in each of these insets identify the reduced temperatures at which J
c
(H) data have
been displayed in Figs.2(a) to 2(d) and in Figs.2(e) to 2(h). (Ref. Banerjee et al, 2000a)
t=0.973 in Fig.2(a), whereas at t=0.996 in Fig. 2(c), the power law regime terminates near 40
Oe. Also, the slope value of linear variation of log J
c
vs. log H in the latter case is somewhat
smaller. At still higher temperatures (see, for instance, Fig.2(d) at 0.997), the power law
region is nearly invisible and the anomalous PE peak cannot be distinctly identified
anymore, as only a residual shoulder survives.
In contrast, the second set of plots (see Figs. 2(e) to 2(h)) in the crystal B shows a different
behaviour, although the overall evolution in the shapes of J
c
(H) curves is generically the
same. In Fig.2(e), at a reduced temperature t~0.965, one can see the same power law regime
as in Fig.2(a), but as the extrapolated dotted line shows, J
c
(H) departs from the power law
behaviour in the low field region (i.e., for H < 200 Oe). As the field decreases below 200 Oe,
the current density in crystal B (t=0.965) increases rapidly towards the background
saturation limit (i.e., in the single vortex pinning regime). The approach to background
saturation limit occurs at much lower field (H < 10 Oe) in crystal A. The smooth crossover to
individual or small bundle pinning regime as seen in the crystal A, therefore adds on an
additional characteristic in the crystal B. We label the region of rapid rise of J
c
(H) at low
Superconductivity – Theory and Applications
60
fields from a power law behaviour in region II into the weakly field dependent J
c
(H)
behaviour in region I, as the region with "loss of order" (cf. Fig.2(f)). Further, with increasing
temperature, the power law regime in the crystal B shrinks faster than that in sample A (cf.
Fig.2(e) at t=0.965 and Fig.2(f) at t=0.973), leaving only a rather featureless monotonic J
c
(H)
behaviour upto the highest fields (cf. Fig.2(g) and Fig.2(h)). Note, also, that the limiting
value of the reduced temperature upto which the power law regime along with the PE peak
survives in the crystal B is smaller than that in crystal A. In crystal B, the PE peak can be
distinctly discerned only upto t=0.977, whereas in crystal A it can be seen even upto t=0.994.
Recalling that the crystal B is more strongly pinned than crystal A, the above observation
reaffirms the notion that the progressive enhancement in effective pinning (which occurs as
we go from sample A to B) shrinks the (H,T) region over which the vortex matter responds
like an elastically (ordered) pinned vortex lattice.
Having identified the regime of collective pinning where the vortex matter behaves like an
ordered elastic medium and determined its sensitivity to pinning, it is fruitful to explore
transformation in the elastic regime for weak collective to strong pinning (Blatter et al.,
2004), and investigate if it coincides with the appearance of PE
3. Weak collective pinning, strong pinning and thermal fluctuations
dominated regimes for the quasi-static vortex state
3.1.1 AC susceptibility measurements:
It is chosen to focus on A’ type of a crystal of 2H-NbSe
2
(cf. section 2.1.1, A’ has pinning
inbetween that of samples A and B), has dimensions 1.5 x 1.5 x 0.1 mm
3
, T
c
(0) ~ 7.2 K and J
c
~ 50 – 100 A/cm
2
(at 4.2 K and 10 kOe). The 2H-NbSe
2
system, being a layered material,
often has extended defects (dislocations, stacking faults) present along its crystalline c axis.
If H is applied along the c axis, then the vortex lines (also oriented along c direction) could
be strongly pinned by these extended defects between layers. To reduce the emphasis on the
inevitably present strong pinning centers, we have chosen to focus on behaviour obtained
for the H c orientation (the c-axis of hexagonal crystallographic lattice is aligned along the
thickness of the platelet shaped sample) for our measurements. This choice of the field
direction also avoids geometric and surface barrier effects, which are known to persist up to
the PE in H //c orientation (Zeldov, et al. 1994; Paltiel et al., 1998).
We measured the ac susceptibility response as well as DC magnetization of the vortex state
in the weak pinning 2H-NbSe
2
sample in the above mentioned orientation. The real (’)
component of the ac susceptibility response (viz., =’+i’’) is a measure of its diamagnetic
shielding response. The maximum value of (normalized) ’= -1 corresponds to the perfectly
shielded, Meissner state of the superconductor. The ’ is related to the shielding currents
(= J
c
) setup in the sample via (Bean 1962, 1964),
c
ac
J
h
for h
ac
> H*, where h
ac
is the ac
excitation magnetic field used to measure the ac susceptibility response and H* is the
penetration field value at which induced screening currents flow through the entire bulk of
the sample. (Note, H* J
c
(H,T)). The quadrature ” signal is a measure of energy dissipated
by vortices, which maximizes at h
ac
= H*. If the vortices get strongly pinned then ’’shows a
decrease, which is encountered in the PE regime. In the PE region, vortex matter gets better
pinned and the ” response anomalously decreases.
Nonlinear Response of the Static and Dynamic Phases of the Vortex Matter
61
3.1.2 Typical characteristics of AC susceptibility response
The ’(T) behavior in the presence of a dc field (H) of 100 Oe is shown in Fig.3(a). In this figure
the various curves correspond to different values of the amplitude of the h
ac
at a frequency of
211 Hz applied parallel to H ( c). Note that at a fixed T, on increasing h
ac
the ’ (viz., the
diamagnetic shielding) response progressively decreases from -1 value (see the dashed arrow
marked at 6.8 K in Fig.3(a)). At fixed T, the decrease in ’ is due to h
ac
approaching close to H*
( J
c
(100 Oe, 6.8 K) and the magnetic flux penetrates the bulk of the sample, leading to a
decrease in the screening response. As the h
ac
penetrates deeper into the superconductor, one
begins to clearly observe features associated with the bulk pinning of vortices inside the
superconductor, viz., the peak effect (PE) phenomenon. The quintessential PE is easily
observed as the anomalous enhancement in ’ between T
on
(corresponding to the onset of PE
at a given H, T) and T
p
(the peak of PE at a given H, T) . Notice that due to the enhanced
pinning in the PE regime between T
on
and T
p
, the sample attempts to shield its interior better
from the penetrating h
ac
as a consequence the ’ increases. Also notice that as the h
ac
increases,
the PE width between T
on
and T
p
becomes narrower.
Fig. 3. (a) The behaviour of ’(T) at H=100 Oe for different values of h
ac
. T
on
and T
p
denote
the onset and peak temperatures of the PE phenomenon. (b) The ’’(T) behaviour at H=100
Oe for different values of h
ac
. Location marked as A indicates the broad dissipation peak due
to penetration of h
ac
into the bulk of the sample (h
ac
> H*). [Banerjee 2000b; Mohan (2009)b]
The behaviour of the out-of-phase component (’’) of the ac susceptibility for various values
of h
ac
at H =100 Oe is shown in Fig,.3(b). It is clear that for h
ac
< 1 Oe and at low T, due to
almost complete shielding of the probing h
ac
from the bulk of the sample, the ’’response is
nearly zero. At a fixed T, say T=6.8 K, as h
ac
increases, ’’ response also increases
monotonically. Full penetration of h
ac
into the bulk of the sample causes a significant rise in
dissipation, which in turn leads to a broad maximum in the ’’ response (location marked as
A in Fig.3(b) for h
ac
=2 Oe). On approaching the PE region, due to enhancement in vortex
pinning, one observes a drop in ’’response (marked as T
p
for h
ac
= 2 Oe). Beyond T
p
,
dissipation has a tendency to rise sharply before decreasing close to T
c
(H). From Fig.3(b) we
note that at H =100 Oe and T=6.8 K, significant flux penetration starts at h
ac
= 1.6 Oe. Within
the Bean’s Critical State model (Bean 1962, 1964) the field for flux penetration is given by
H*~J
c
.d, where d is the relevant dimension in which the critical state is established. Using
Fig.3(b), by approximating H*= 1.6 Oe, we estimate the J
c
~ 130 A/cm
2
at 6.8 K at 100 Oe
(note J
c
decreases significantly with increasing H).
Superconductivity – Theory and Applications
62
3.2 Transformation in the vortex state deep in the elastic regime
From Fig.3 it can be noted that the PE phenomenon is distinctly observed for h
ac
≥ 2 Oe as at
these h
ac
, the ac field fully penetrate the bulk of the superconductor, and one can probe
changes in the bulk pinning characteristics of the sample. Choosing h
ac
= 2 Oe, we measured
the ’(T) and ’’(T) for different values of H. Figures 4(a) and 4(c) and Figs. 4(b) and 4(d)
Fig. 4. The real ((a),(c)) and imaginary ((b), (d)) parts of the ac susceptibility as a function of
T with h
ac
=2 Oe and for different H. [Mohan 2009b]
show the ’(T) and ’’(T), respectively. At 7.0 K in Fig.4(a), with increasing H the value of
’varies from about -1 at 25 Oe to about -0.2 at 250 Oe. This decrease in the diamagnetic
shielding response, we believe, arises from the inverse field relation of the critical current
density, e.g.,
1
c
J
H
(Kim et al., 1962). In all the curves the location of PE is clearly visible
as the anomalous enhancement in ’ due to the anomalous increase in pinning or J
c
.
However below 100 G the PE is very shallow, and we see an enhancement in ’’which
occurs very close to T
c
(H). At 100 Oe we see the decrease in ’’ at PE quite clearly, before the
’’increases near T
c
(T). At higher fields of 250 Oe (Fig.4(a)) from ’(T) we see that the PE gets
narrower in temperature width. As one moves to still higher fields (Fig.4(c)), the PE width
gets still narrower and sharper. In the ’’(T) at Fig.4(d), as well as in Fig.4(b) (above 100 Oe)
we do not find the drop in ’’ associated with PE as the drop over a narrow temperature
window in ’’ due to PE gets merged into the enhancement in ’’ signal one observes in the
vicinity of T
c
(H). However from Figs.4(c) and 4(d), we see that there is a decrease in ’’
which begins (see an arrow in Fig.4(d)) well before the anomalous enhancement in ’(T) sets
in at PE.
The fig. 5 provides a glimpse into ac susceptibility data at high fields. Above H = 750 Oe, the
signature of PE survives as a subtle change in slope of ’(T) at T
p
(see locations marked by
arrows in Fig.5(a)) just before ’crashes to zero value at T
c
(H). A distinct feature seen at these
fields is that the dissipation ’’ behaviour (Fig.5(b)), which is large at lower T, decreases
sharply as one approaches T
c
. This decrease begins from a region located far below the PE and
is similar to the decrease in ’’(T) found above 450 Oe in fig. 4(d). The sharp increase in the
dissipation (on ’’(T)) very close to T
c
(H) (as noted in Fig.4), is observed only for 1000 Oe
Nonlinear Response of the Static and Dynamic Phases of the Vortex Matter
63
Fig. 5. The real (a) and imaginary (b) parts of the ac susceptibility measured with h
ac
= 2 Oe
and for different dc fields: 1000 Oe H 12500 Oe. The arrows in panel (a) mark the peak
locations of the PE. (c) The ’’ response for 1000 Oe, 5000 Oe and 12500 Oe. The T
cr
and T
fl
locations determine the different regimes of dissipation marked as the regions 1, 2 and 3
(See text for details). (d) The ’ response corresponding to (c). [Mohan et al. 2007; Mohan
2009b].
(position marked C in Fig.5(b)). Above 1000 Oe, instead of a peak in ’’(T), the ’’ response
exhibits only a change in slope near T
c
(H) before becoming zero on reaching T
c
(H). It should
be noted that the temperature at which where the ’’response drops sharply from a large
value does not correspond to any specific feature in ’(T) and, also, occurs well before the
onset of PE. In Figs.6 (a) to (c) we can identify locations of the drop in dissipation ’’ by
detecting the change in slope of through plots d’’/dT vs T (see Figs.6(f), 6(e) and 6(d)) .
In Figs.6(d)-(f), the onset of the drop in dissipation at lower T is marked with arrows as T
cr
and the T at which there occurs a change in slope of the dissipation curves close to T
c
(H) are
marked as T
fl
. (The nomenclature T
cr
and T
fl
, signify the temperature above which, there
occur pinning crossover and thermal fluctuation dominated regimes, respectively). The
dashed lines are a guide to the eye representing the base line behavior of the d’’/dT. The
onset of deviation in d’’/dT from the baseline identifies T
cr
(cf. Figs.6(d) – (f)). In Figs.6 (d)-
(f) the base lines for different H have been artificially offset for clarity in the data
representation. After the locations of T
cr
and T
fl
are identified from d’’/dT (cf. Figs.6(d) –
(f)), their positions are identified and marked on the corresponding ’’(T) curves (Figs.6(a)-
(c)). We now consider three representative ’’(T) curves, namely the response for 1000 Oe,
5000 Oe and 12500 Oe in Fig.5(c) to understand the significance of the T
cr
and T
fl
.