báo cáo hóa học: " Human oligodendroglial cells express low levels of C1 inhibitor and membrane cofactor protein mRNAs" pptx
Bạn đang xem bản rút gọn của tài liệu. Xem và tải ngay bản đầy đủ của tài liệu tại đây (489.97 KB, 9 trang )
BioMed Central
Page 1 of 9
(page number not for citation purposes)
Journal of Neuroinflammation
Open Access
Research
Human oligodendroglial cells express low levels of C1 inhibitor and
membrane cofactor protein mRNAs
Masato Hosokawa, Andis Klegeris and Patrick L McGeer*
Address: Kinsmen Laboratory of Neurological Research, University of British Columbia, 2255 Wesbrook Mall, Vancouver, BC, V6T 1Z3, Canada
Email: Masato Hosokawa - ; Andis Klegeris - ;
Patrick L McGeer* -
* Corresponding author
Abstract
Background: Oligodendrocytes, neurons, astrocytes, microglia, and endothelial cells are capable
of synthesizing complement inhibitor proteins. Oligodendrocytes are vulnerable to complement
attack, which is particularly observed in multiple sclerosis. This vulnerability may be related to a
deficiency in their ability to express complement regulatory proteins.
Methods: This study compared the expression level of complement inhibitor mRNAs by human
oligodendrocytes, astrocytes and microglia using semi-quantitative RT-PCR.
Results: Semi-quantitative RT-PCR analysis showed that C1 inhibitor (C1-inh) mRNA expression
was dramatically lower in oligodendroglial cells compared with astrocytes and microglia. The
mRNA expression level of membrane cofactor protein (MCP) by oligodendrocytes was also
significantly lower than for other cell types.
Conclusion: The lower mRNA expression of C1-inh and MCP by oligodendrocytes could
contribute to their vulnerability in several neurodegenerative and inflammatory diseases of the
central nervous system.
Background
Resident brain cells including oligodendrocytes [1,2],
astrocytes, astrocytomas, microglia, glioblastomas [3-14],
neurons [15,16], neuroblastomas [17,18] and endothelial
cells [19,20] express mRNAs for complement proteins.
Although the role of complement expression by these cells
remains unclear, local complement activation in the cen-
tral nervous system (CNS) might damage these cells and
contribute to the pathology in several inflammatory and
neurodegenerative diseases including multiple sclerosis,
Alzheimer's disease and progressive supranuclear palsy.
For self-protection, resident brain cells also express com-
plement inhibitors, such as membrane cofactor protein
(MCP), decay-accelerating factor (DAF), CD59, and C1-
esterase inhibitor (C1-inh). The human HOG oligoden-
droglial cell line produces MCP, DAF, CD59, C1-inh and
S-protein, but not complement receptor 1 (CR1) [1].
Human oligodendrocytes have been reported to express
CD59 [21] and DAF, but not MCP, CR1, homologous
restriction factor (HRF: C8 bp) or clusterin [22]. Astro-
cytes [23], neurons and Schwann cells have been reported
to express CD59 [24] and neuroblastoma cell lines C1-inh
[18]. Astrocytoma cell lines have been reported to express
MCP, DAF, and CD59 [25,26].
Published: 24 August 2004
Journal of Neuroinflammation 2004, 1:17 doi:10.1186/1742-2094-1-17
Received: 20 May 2004
Accepted: 24 August 2004
This article is available from: />© 2004 Hosokawa et al; licensee BioMed Central Ltd.
This is an open-access article distributed under the terms of the Creative Commons Attribution License ( />),
which permits unrestricted use, distribution, and reproduction in any medium, provided the original work is properly cited.
Journal of Neuroinflammation 2004, 1:17 />Page 2 of 9
(page number not for citation purposes)
In this study, the expression level of mRNAs for various
complement inhibitors by human oligodendrocytes,
astrocytes and microglia were compared by semi-quanti-
tative PCR. We show that oligodendrocytes express
extremely low levels of mRNA for C1-inh and significantly
lower levels of mRNA for MCP compared with astrocytes
and microglia. The expression level of mRNAs for CD59
and DAF showed no significant differences between the
three cell types.
Methods
Cell culture: microglial- and astrocyte-enriched cultures
Human microglial and astrocytic cells were isolated from
surgically resected temporal lobe tissues. We thank Dr. J.
Maguire, Department of Pathology and Laboratory Medi-
cine, Vancouver General Hospital for providing the surgi-
cal specimens. Isolation protocols described by De Groot
et al. [27,28] were used with minor modifications. Tissues
were placed in a sterile Petri dish, rinsed with Hank's bal-
anced salt solution, and visible blood vessels were
removed. After washing tissues two more times with
Hank's balanced salt solution, tissues were chopped into
small (<2 mm
3
) pieces with a sterile scalpel. The frag-
ments were transferred into a 50 ml centrifuge tube con-
taining 10 ml of 0.25% trypsin solution (Gibco-BRL, Life
Technologies, Burlington, ON, Canada), and incubated at
37°C for 20 min. Subsequently DNase I (from bovine
pancreas, Pharmacia Biotech, Baie d'Urfé, PQ, Canada)
was added to reach a final concentration of 50 µg/ml. Tis-
sues were incubated for an additional 10 min at 37°C.
The cell suspension was diluted with 10 ml of Dulbecco's
modified Eagle's medium (DMEM) and nutrient mixture
F12 ham (DMEM-F12; Sigma-Aldrich, Oakville, ON, Can-
ada) with 10% fetal bovine serum (FBS; Gibco-BRL, Life
Technologies), and gently triturated by using a 10 ml
pipette with a wide mouth. After centrifugation at 275 × g
for 10 min, the cell pellet was resuspended in serum con-
taining medium, triturated several times, and passed
through a 100 µm nylon cell strainer (Becton Dickinson,
Franklin Lakes, NJ). The cell suspension was then centri-
fuged once more (275 × g for 10 min), resuspended into
10 ml of DMEM-F12 with 10% FBS containing gen-
tamicin (50 µg/ml, from Sigma), and plated onto
uncoated 10 cm tissue culture plates (Becton Dickinson).
Plates were placed in a humidified 5% CO
2
, 95% air
atmosphere at 37°C for 2 hr in order to achieve adherence
of microglial cells. Non-adherent cells with myelin debris
were removed from these microglia-enriched cultures and
transferred into poly-L-lysine coated 10 cm tissue culture
plates in order to achieve adherence of astrocytes. Plates
were incubated for 48 hr, after which the culture medium
containing myelin debris and non-adherent cells was
removed and used to prepare oligodendroglial cell cul-
tures as described below. Both microglial- and astrocyte-
enriched cultures were grown for 6 to 7 days before their
mRNAs were extracted. Immunostaining with antibodies
against CD68 (Dako, Mississauga, ON, Canada) which
stains microglia as well as macrophages, and glial fibril-
lary acidic protein (GFAP, Dako), which is a marker of
astrocytes, showed that the microglia-enriched cultures
contained 93.5 ± 3.6 % (N = 4) microglial cells, while
astrocyte-enriched cultures contained 85.7 ± 3.4 % (N =
4) astrocytes.
Cell culture: oligodendroglial cells
These were prepared as described before [2]. Briefly, cell
culture media containing myelin debris and non-adherent
cells that were removed from astrocyte-enriched cultures
were used to extract oligodendroglial cells. The non-
adherent cells were collected by centrifugation at 275 × g
for 10 min and replated onto uncoated 10 cm tissue cul-
ture plates for another 24 hr. Subsequently, the cell cul-
ture medium containing floating cells was transferred to
50 ml tubes and Lymphoprep solution (Axis-Shield, Oslo,
Norway) used to reduce the amount of contaminating
myelin debris. For this purpose, 10 ml of Lymphoprep
solution was carefully placed under the oligodendrocyte
cell suspension and the density gradient was centrifuged
at 325 × g for 10 min. The interphase was collected and
transferred to a 50 ml centrifuge tube. Fresh culture
medium was added and the suspension was centrifuged at
275 × g for 7 min. The cell pellet was resuspended and the
oligodendrocyte cultures seeded onto 60 mm plastic cul-
ture dishes. Immunostaining with anti-O4 antibody
(Chemicon International, Temecula, CA), which is a
marker of oligodendrocytes, showed that the oli-
godendrocytes-enriched cultures contained 95.3 ± 4.4 %
(N = 4) oligodendrocytes.
RNA isolation and cDNA synthesis by reverse transcription
Total RNA from oligodendroglial cells, microglia, and
astrocytes were isolated by the acid guanidium thiocy-
anate-phenol-chloroform method. Two µg of the RNA
was then used to prepare cDNA. RNA was treated with 10
U of DNase I (Gibco BRL, Life Technologies) for 60 min
at 37°C in 25 µl of 1 × reverse transcriptase buffer (50 mM
Tris-HCl, 75 mM KCl, 3 mM MgCl
2
) containing 40 U of
RNase inhibitor (Pharmacia Biotech) and 1 mM dithioth-
reitol (DTT), following by incubation at 85°C for 5 min
to inactivate the enzyme. Reverse transcription was per-
formed at 42°C for 90 min in 50 µl of the following mix-
ture: 1 × reverse transcriptase buffer containing 2 µg of
RNA, 5 mM DTT, 0.2 µg random hexamer primers (Phar-
macia Biotech), 1 mM deoxynucleotides (Gibco BRL, Life
Technologies), 40 units of RNase inhibitor, and 400 units
of SuperScript II reverse transcriptase (Invitrogen Life
Technologies, Burlington, ON, Canada). At the end of the
incubation period, the enzyme was inactivated by heating
at 65°C for 10 min [29].
Journal of Neuroinflammation 2004, 1:17 />Page 3 of 9
(page number not for citation purposes)
Polymerase chain reaction
PCR amplification was carried out in a 25 µl reaction mix-
ture containing 1 × GeneAmp PCR buffer II (Perkin Elmer,
Foster City, CA), 1.25 units AmpliTaq Gold DNA
polymerase (Perkin Elmer), 2 mM MgCl
2
(Perkin Elmer),
200 µM dNTPs (Gibco BRL, Life Technologies) and 0.5
µM of each specific primer (Table 1). The mixture was pre-
pared before the addition of 1.25 µl of cDNA. PCR ampli-
fication was carried out using an MJResearch (Boston,
MA) programmable thermal controller. The amplification
program consisted of an initial denaturation step at 94°C,
which was extended to 9 min in order to activate Ampli-
Taq Gold enzyme. The remaining cycles were 1 min at
94°C, 1 min at 55°C and 1 min at 72°C. The number of
cycles performed was 27 for glyceraldehyde-3-phosphate
dehydrogenase (G3PDH), 30 for CD59, C1-inh and MCP,
and 32 for DAF. After amplification, PCR products were
separated on a 6% polyacrylamide gel and visualized by
incubation for 10 min in a solution containing 10 ng/ml
of ethidium bromide. Polaroid photographs of the gels
were taken.
PCR primer design and restriction analyses
Primers were designed to span introns so that cDNA-
derived PCR products would be of different sizes to those
produced if genomic DNA was amplified (see Table 1).
DAF and MCP were exceptions, since only cDNA
sequences were available. Primers were synthesized either
by Sigma-Aldrich or ID Labs (London, ON, Canada). The
primer sequences and predicted PCR fragment sizes are
listed in Table 1, along with the names of the enzymes
used for restriction digest analysis of each PCR fragment.
The restriction digestion reactions were carried out at
37°C for 2 hr in the presence of 1 × the appropriate buffer
provided by the suppliers (Invitrogen, Life Technologies
and New England Biolabs, Mississauga, ON, Canada). The
digested PCR products were analyzed on a 6% polyacryla-
mide gel (data not shown). In all cases the restriction frag-
ments observed were of the predicted size (see Table 1).
Statistical analysis
The data are presented as means ± s.e.m. The significance
of difference between values was estimated by means of
one-way analysis of variance (ANOVA) with Fisher's LSD
post-hoc test. P < 0.05 was considered to show statistically
significant differences.
Double fluorescence immunocytochemical analysis
Oligodendrocytes, astrocytes, and microglia were har-
vested and air-dried on glass slides. Cells were then fixed
with 4% paraformaldehyde for 10 min and permeabilized
with 0.2% Triton X-100 in phosphate-buffered saline
(PBS) for 5 min. For inactivation of endogenous peroxi-
dase, cells were incubated with 0.3% H
2
O
2
for 30 min.
Blocking was performed for 1 hr at room temperature in
5% skim milk.
For double fluorescence immunostaining, cells were incu-
bated at room temperature overnight with a primary anti-
body in 1% normal serum. The primary antibody and the
dilution used in the first cycle were as follows: O4
(Chemicon International, 1: 100) for oligodendrocytes,
GFAP (Dako, 1: 10,000) for astrocytes, CD68 (DAKO, 1:
50) for microglia. Cells were then treated for 2 hr at room
temperature with a biotin conjugated anti-mouse IgM
(Vector Laboratories, Burlingame, CA, 1: 200) secondary
antibody for O4, a biotin conjugated anti-rabbit IgG (Vec-
tor Laboratories, 1: 200) secondary antibody for GFAP
and a biotin conjugated anti-mouse IgG (Vector Laborato-
ries, 1: 200) secondary antibody for CD68. Then cells
were incubated with Texas Red Avidin DCS (Vector Labo-
ratories) for 1 hr. The primary antibody and the dilution
used in the second cycle were as follows: for C1-inh, goat
anti-C1-inhbitor (Quidel, San Diego, CA, 1: 50); for
CD59, mouse anti-CD59 (Serotec Ltd, Oxford, UK, 1: 10)
or rat anti-CD59 (Serotec, 1: 25). Cells were incubated at
4°C for 3 days with a primary antibody in 1% serum cor-
responding to the secondary antibody type. Cells were
then treated for 2 hr at room temperature with FITC-con-
Table 1: Oligonucleotide primers used for PCR, and the corresponding restriction endonucleases used for product confirmation.
Gene Sequence (5' → 3') Fragment size
(introns)
Genbank accession
No
Restriction enzymes used and the
expected sizes of digestion products (bp)
C1 inh-F GTT GGG GGA TGC TTT GGT AGA TTT C 332 M13690 Sau 3AI (246, 86)
C1 inh-R TTA GGA CTC TGG GGC TGC TGC TGT A (2 introns)
CD59-F CTG CTG CTC GTC CTG GCT GTC TTC T 280 M34671 Pst I (233, 47)
CD59-R TCC CAC CAT TTT CAA GCT GTT CGT T (2 introns)
MCP-F CAA TTC AGT GTG GAG TCG TGC TGC 265 Y00651 Sau 3AI (193, 72)
MCP-R TGA GGC ACT GGA CGC TGG AGA T (unknown)
DAF-F GTA CTG TGA ATA ATG ATG AAG GAG 364 M30142 Hae III (330, 34)
DAF-R TCT TAA CTC TTC TTT GGC TAA GTC (unknown)
G3PDH-F CCA TGT TCG TCA TGG GTG TGA ACC A 251 X01677 Dde I (168, 83)
G3PDH-R GCC AGT AGA GGC AGG GAT GAT GTT C (2 introns)
Journal of Neuroinflammation 2004, 1:17 />Page 4 of 9
(page number not for citation purposes)
jugated anti-mouse IgG (Vector Laboratories, 1: 200),
anti-goat IgG (Santa Cruz Biotechnology, Santa Cruz, CA,
1: 200), or anti-rat IgG (Cappel, Durham, NC, 1: 200).
The glass slides were then rinsed with distilled water, and
a drop of Vectashield mounting medium (Vector Labora-
tories) placed on the slide.
Results
RT-PCR
RT-PCR was carried out using primers for C1-inh, CD59,
DAF and MCP. The housekeeping gene G3PDH was
amplified in parallel with each RT-PCR run as an internal
standard. Figure 1 illustrates the bands obtained for each
of the RT-PCR products from oligodendrocytes (Fig. 1A),
astrocytes (Fig. 1B) and microglia (Fig. 1C). Specificity of
each of the products was established by endonuclease
digestion (Table 1).
Semi-quantitative RT-PCR analysis
To compare the ratio of each of the complement inhibi-
tors to G3PDH, statistical analysis was performed by
means of one-way ANOVA with Fisher's LSD post-hoc test
(Fig. 2). The overall mean ± s.e.m. for C1-inh/G3PDH was
0.55 ± 0.12 (N = 5) in astrocytes, 0.58 ± 0.09 (N = 3) in
microglia and 0.09 ± 0.06 (N = 12) in oligodendrocytes
(Fig. 2A). Oligodendrocytes showed a highly significant
difference from astrocytes and microglia (Fig. 2A; P <
0.001 by one-way ANOVA with Fisher's LSD post-hoc
test). For MCP/G3PDH, the ratios were 0.80 ± 0.22 (N =
5) in astrocytes, 0.93 ± 0.10 (N = 3) in microglia and 0.44
± 0.19 (N = 12) in oligodendrocytes. Oligodendrocytes
showed a significant difference from astrocytes and micro-
glia (Fig. 2B; P = 0.002 vs. astrocytes and P = 0.001 vs.
microglia by one-way ANOVA with Fisher's LSD post-hoc
test). The corresponding means for CD59/G3PDH were
0.73 ± 0.10 (N = 5) in astrocytes, 0.83 ± 0.03 (N = 3) in
microglia and 0.76 ± 0.09 (N = 14) in oligodendrocytes
(Fig. 2C). The corresponding means for DAF/G3PDH
were 0.67 ± 0.07 (N = 5) in astrocytes, 0.67 ± 0.07 (N = 3)
in microglia and 0.66 ± 0.15 (N = 14) in oligodendrocytes
(Fig. 2D). There were no significant differences between
the three cell types for CD59 and DAF. Each N represents
a different patient.
Double fluorescence immunohistochemistry
In order to establish identity between oligodendroglial
cells, astrocytes or microglia and cells expressing the com-
plement inhibitor proteins CD59 or C1-inh, double fluo-
rescence immunostaining was carried out.
Oligodendrocytes were detected by O4 staining with a
Texas Red tagged secondary antibody (Fig. 3A and 3D) in
the first cycle and CD59 (Fig 3B) or C1-inh staining (Fig.
3E) detected with a green FITC tagged antibody in the sec-
ond cycle. Astrocytes were detected by GFAP staining with
a Texas Red tagged secondary antibody (Fig. 3G and 3J) in
the first cycle and CD59 staining (Fig 3H) or C1-inh stain-
ing (Fig. 3K) detected with a green FITC tagged antibody
in the second cycle. Microglia were detected by CD68
staining with a Texas Red tagged secondary antibody (Fig.
3M and 3P) in the first cycle, and CD59 staining (Fig 3N)
or C1-inh staining (Fig. 3Q) detected with a green FITC
tagged antibody in the second cycle. With double fluores-
cent excitation, all cells fluoresced yellow (Fig.
3C,3F,3I,3L,3O,3R), indicating colocalization of O4 with
CD59 or C1-inh, GFAP with CD59 or C1-inh, and CD68
with CD59 or C1-inh.
Discussion
This report shows that human oligodendrocytes express a
much lower level of mRNA for C1-inh than astrocytes and
microglia, and a significantly lower level of mRNA for
MCP. The mRNA levels of CD59 and DAF were compara-
ble in all the three cell types. Overall our data suggest that
oligodendroglial cells, in common with other cell types,
can produce complement inhibitors, but at a significantly
lower level for C1-inh and MCP.
It has already been reported that human neurons and
Schwann cells [24], neuroblastoma cell lines [18], astro-
cytes [23], astrocytoma cell lines [25,26], the HOG
human oligodendroglial cell line [1] and oligodendro-
cytes [21,22] produce some or all of the complement
inhibitor proteins and their mRNAs.
Activation of the complement cascade and deposition of
activated complement fragments occur in non-infectious
diseases such as multiple sclerosis, Pick's disease, Alzhe-
imer's disease and other neurodegenerative conditions
[15,16,30-34]. Complement inhibitors may play an
important role in preventing such pathology.
Full activation of the complement cascade requires over-
coming a series of endogenous inhibitory factors. Oli-
godendrocytes are vulnerable to complement attack,
which is particularly observed in multiple sclerosis [35-
37] and this vulnerability may be related to a deficiency of
their ability to express complement regulatory proteins
[22], particularly C1-inh.
Sporadic complement attack, in the form of complement
activated oligodendroglia (CAO) is also observed in a
number of neurodegenerative conditions [38,39], includ-
ing Alzheimer's, Pick's, Huntington's and Parkinson's dis-
eases, amyotrophic lateral sclerosis, progressive
supranuclear palsy, Shy-Drager syndrome, argyrophilic
grain dementia and pallido-nigral luysial atrophy [38,39].
The source of the complement proteins that become acti-
vated is unknown, but the data presented here suggest that
oligodendrocytes are vulnerable to complement attack
because of a low expression of C1-inh and MCP.
Journal of Neuroinflammation 2004, 1:17 />Page 5 of 9
(page number not for citation purposes)
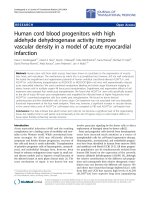
Demonstration of RT-PCR productsFigure 1
Demonstration of RT-PCR products. Polaroid photographs of typical ethidium bromide-stained gels of RT-PCR products from
oligodendrocytic (Fig. 1A), astrocytic (Fig. 1B) and microglial (Fig. 1C) RNA extracts. Lanes for individual mRNA products are
indicated in the legend at the top. Size markers are in the right lanes. MCP, membrane cofactor protein (265 bp); DAF, decay-
accelerating factor (364 bp); CD59 (280 bp); C1-inh, C1-esterase inhibitor (332 bp); G3PDH, glyceraldehyde-3-phosphate
dehydrogenase (251 bp).
Microglia
C
Astrocytes
Oligodendrocytes
B
A
MCP
DAF
CD59
C1-inh
G3PDH
Marker
517
506
396
344
298
220
201
517
506
396
344
298
220
201
517
506
396
344
298
220
201
Journal of Neuroinflammation 2004, 1:17 />Page 6 of 9
(page number not for citation purposes)
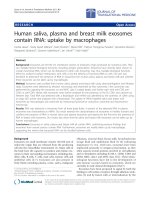
A comparison of relative complement inhibitor expression level between oligodendrocytes, astrocytes and microgliaFigure 2
A comparison of relative complement inhibitor expression level between oligodendrocytes, astrocytes and microglia. The data
were estimated by one-way analysis of variance (ANOVA) with Fisher's LSD post-hoc test (A and B; P < 0.05 was considered
to show statistically significant differences).
Journal of Neuroinflammation 2004, 1:17 />Page 7 of 9
(page number not for citation purposes)
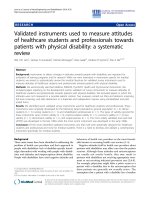
Double fluorescence immunohistochemistry of oligodendrocytes, astrocytes and microgliaFigure 3
Double fluorescence immunohistochemistry of oligodendrocytes, astrocytes and microglia. Double fluorescence immunostain-
ing for O4 and CD59 or C1-inh is demonstrated in A-F. In A and D, cells of typical oligodendroglial morphology were stained
in the initial cycle for the specific oligodendroglial marker O4. Detection is by a Texas Red-conjugated secondary antibody.
Second cycle staining for CD59 (B) and C1-inh (E) are shown. The detections are by an FITC-linked green fluorescent second-
ary antibody. In C and F, double immunofluorescences are shown in which the cells appear yellow, demonstrating colocaliza-
tion of O4 with CD59 or C1-inh. Double fluorescence immunostaining of astrocytes for GFAP and CD59 or C1-inh is
demonstrated in G-L. In G and J, cells of typical astrocytic morphology are stained in the initial cycle for the specific astroglial
marker GFAP. Detection is by a Texas Red-conjugated secondary antibody. Second cycle staining for CD59 (H) and C1-inh (K)
is shown with an FITC-linked green fluorescent secondary antibody. In I and L, double immunofluorescences are shown in
which the cells appear yellow, demonstrating colocalization of GFAP with CD59 or C1-inh. Double fluorescence immunostain-
ing for microglia using the specific marker CD68 and CD59 or C1-inh is demonstrated in M-R. In M and P, cells of typical
microglial morphology are stained by CD68 with detection by a Texas Red-conjugated secondary antibody. Second cycle stain-
ing for CD59 (N) and C1-inh (Q) are shown. The detections are by an FITC-linked green fluorescent secondary antibody. In O
and R, double immunofluorescences are shown in which the cells appear yellow, demonstrating colocalization of CD68 with
CD59 or C1-inh. (Magnification: × 200)
Journal of Neuroinflammation 2004, 1:17 />Page 8 of 9
(page number not for citation purposes)
Conclusions
These results suggest that the lower expression of C1-inh
and MCP by oligodendrocytes could contribute to their
vulnerability in several neurodegenerative and inflamma-
tory diseases of the central nervous system, particularly
multiple sclerosis.
List of abbreviations
analysis of variance (ANOVA)
central nervous system (CNS)
complement activated oligodendroglia (CAO)
complement receptor 1 (CR1)
decay-accelerating factor (DAF)
dithiothreitol (DTT)
fluorescein isothiocyanate isomer (FITC)
glyceraldehyde-3-phosphate dehydrogenase (G3PDH)
glial fibrillary acidic protein (GFAP)
homologous restriction factor (HRF)
membrane cofactor protein (MCP)
phosphate-buffered saline (PBS)
Competing interests
None declared.
Authors' contributions
MH was responsible for the majority of the experimental
studies, and for writing the manuscript. AK contributed to
the cell culture and the editing of the manuscript. PLM
contributed to the conception, interpretation of results
and the writing and editing of the manuscript.
Acknowledgements
This work was supported by a grant from the Jack Brown and Family Alzhe-
imer's Disease Research Fund, and the Pacific Parkinson's Research
Institute.
References
1. Gasque P, Morgan BP: Complement regulatory protein expres-
sion by human oligodendrocyte cell line: cytokine regulation
and comparison with astrocytes. Immunology 1996, 89:338-347.
2. Hosokawa M, Klegeris A, Maguire J, McGeer PL: Expression of
complement mRNAs and proteins by human oligodendro-
glial cells. Glia 2003, 42:417-423.
3. Levi-Strauss M, Mallat M: Primary cultures of murine astrocytes
produce C3 and factor B, two components of the alternative
pathway of complement activation. J Immunol 1987,
139:2361-2366.
4. Gordon DL, Avery VM, Adrian DL, Sadlon TA: Detection of com-
plement protein mRNA in human astrocytes by polymerase
chain reaction. J Neurosci Methods 1992, 45:191-197.
5. Johnson SA, Lampert-Etchells M, Pasinetti GM, Rozovsky I, Finch CE:
Complement mRNA in the mammalian brain: responses to
Alzheimer's disease and experimental brain lesioning. Neuro-
biol Aging 1992, 13:641-648.
6. Pasinetti GM, Johnson SA, Rozovsky I, Lampert-Etchells M, Morgan
DG, Gordon MN, Morgan TE, Willoughby D, Finch CE: Comple-
ment C1qB and C4 mRNAs responses to lesioning in rat
brain. Exp Neurol 1992, 118:117-125.
7. Rus HG, Kim LM, Niculescu FI, Shin ML: Induction of C3 expres-
sion in astrocytes is regulated by cytokines and Newcastle
disease virus. J Immunol 1992, 148:928-933.
8. Haga S, Ikeda K, Sato M, Ishii T: Synthetic Alzheimer amyloid β/
A4 peptides enhance production of complement C3 compo-
nent by cultured microglial cells. Brain Res 1993, 601:88-94.
9. Gasque P, Julen N, Ischenko AM, Picot C, Mauger C, Chauzy C,
Ripoche J, Fontaine M: Expression of complement components
of the alternative pathway by glioma cell lines. J Immunol 1992,
149:1381-1387.
10. Gasque P, Ischenko A, Legoedec J, Mauger C, Schouft MT, Fontaine
M: Expression of the complement classical pathway by
human glioma in culture. J Biol Chem 1993, 268:25068-25074.
11. Gasque P, Fontaine M, Morgan BP: Complement expression in
human brain. J Immunol 1995, 154:4726-4733.
12. Barnum SR: Complement biosynthesis in the central nervous
system. Crit Rev Oral Biol Med 1995, 6:132-146.
13. Walker DG, Kim SU, McGeer PL: Complement and cytokine
gene expression in cultured microglia derived from post-
mortem human brains. J Neurosci Res 1995, 40:478-493.
14. Walker DG, Kim SU, McGeer PL: Expression of complement C4
and C9 genes by human astrocytes. Brain Res 1998, 809:31-38.
15. Terai K, Walker DG, McGeer EG, McGeer PL: Neurons express
proteins of the classical complement pathway in Alzheimer
disease. Brain Res 1997, 769:385-390.
16. Shen Y, Li R, McGeer EG, McGeer PL: Neuronal expression of
mRNAs for complement proteins of the classical pathway in
Alzheimer brain. Brain Res 1997, 769:391-395.
17. Gasque P, Thomas A, Fontaine M, Morgan BP: Complement acti-
vation on human neuroblastoma cell lines in vitro: route of
activation and expression of functional complement regula-
tory proteins. J Neuroimmunol 1996, 66:29-40.
18. Thomas A, Gasque P, Vaudry D, Gonzalez B, Fontaine M: Expres-
sion of a complete and functional complement system by
human neuronal cells in vitro. Int Immunol 2000, 12:1015-1023.
19. Vastag M, Skopal J, Kramer J, Kolev K, Voko Z, Csonka E, Machovich
R, Nagy Z: Endothelial cells cultured from human brain
microvessels produce complement proteins factor H, factor
B, C1 inhibitor, and C4. Immunobiology 1998, 199:5-13.
20. Klegeris A, Bissonnette CJ, Dorovini-Zis K, McGeer PL: Expression
of complement messenger RNAs by human endothelial
cells. Brain Res 2000, 871:1-6.
21. Zajicek J, Wing M, Skepper J, Compston A: Human oligodendro-
cytes are not sensitive to complement. A study of CD59
expression in the human central nervous system. Lab Invest
1995, 73:128-138.
22. Scolding NJ, Morgan BP, Compston DAS: The expression of com-
plement regulatory proteins by adult human
oligodendrocytes. J Neuroimmunol 1998, 84:69-75.
23. Gordon DL, Sadlon T, Hefford C, Adrian D: Expression of CD59,
a regulator of the membrane attack complex of comple-
ment, on human astrocytes. Brain Res Mol Brain Res 1993,
18:335-338.
24. Vedeler C, Ulvestad E, Bjorge L, Conti G, Williams K, Mork S, Matre
R: The expression of CD59 in normal human nervous tissue.
Immunology 1994, 82:542-547.
25. Yang C, Jones JL, Barnum SR: Expression of decay-accelerating
factor (CD55), membrane cofactor protein (CD46) and
CD59 in the human astroglioma cell line, D54-MG, and pri-
mary rat astrocytes. J Neuroimmunol 1993, 47:123-132.
26. Spiller OB, Moretto G, Kim SU, Morgan BP, Devine DV: Comple-
ment expression on astrocytes and astrocytoma cell lines
failure of complement regulation at the C3 level correlates
with very low CD59 expression. J Neuroimmunol 1996, 71:97-106.
Publish with Bio Med Central and every
scientist can read your work free of charge
"BioMed Central will be the most significant development for
disseminating the results of biomedical research in our lifetime."
Sir Paul Nurse, Cancer Research UK
Your research papers will be:
available free of charge to the entire biomedical community
peer reviewed and published immediately upon acceptance
cited in PubMed and archived on PubMed Central
yours — you keep the copyright
Submit your manuscript here:
/>BioMedcentral
Journal of Neuroinflammation 2004, 1:17 />Page 9 of 9
(page number not for citation purposes)
27. De Groot CJA, Langeveld CH, Jongenelen CAM, Montagne L, Van
Der Valk P, Dijkstra C: Establishment of human adult astrocyte
cultures derived from postmortem multiple sclerosis and
control brain and spinal cord regions: immunophenotypical
and functional characterization. J Neurosci Res 1997, 49:342-254.
28. De Groot CJA, Montagne L, Janssen I, Ravid R, Van Der Valk P, Veer-
huis R: Isolation and characterization of adult microglial cells
and oligodendrocytes derived from postmortem human
brain tissue. Brain Res Brain Res Protoc 2000, 5:85-94.
29. Yasojima K, Schwab C, McGeer EG, McGeer PL: Human neurons
generate C-reactive protein and amyloid P: upregulation in
Alzheimer's disease. Brain Res 2000, 887:80-89.
30. Eikelenboom P, Hack CE, Rozemuller JM, Stam FC: Complement
activation in amyloid plaques in Alzheimer's dementia. Vir-
chows Arch B Cell Pathol Incl Mol Pathol 1989, 56:259-262.
31. McGeer PL, Akiyama H, Itagaki S, McGeer EG: Immune system
response in Alzheimer's disease. Can J Neurol Sci 1989,
16:516-527.
32. Verga L, Frangione B, Tagliavini F, Giaccone G, Migheli A, Bugiani O:
Alzheimer patients and Down patients: cerebral preamyloid
deposits differ ultrastructurally and histochemically from
the amyloid of senile plaques. Neurosci Lett 1989, 105:294-299.
33. McGeer PL, McGeer EG: The inflammatory response system of
brain: implications for therapy of Alzheimer and other neu-
rodegenerative diseases. Brain Res Rev 1995, 21:195-218.
34. Webster S, Lue LF, Brachova L, Tenner AJ, McGeer PL, Terai K,
Walker DG, Bradt B, Cooper NR, Rogers J: Molecular and cellular
characterization of the membrane attack complex, C5b-9, in
Alzheimer's disease. Neurobiol Aging 1997, 18:415-421.
35. Compston DAS, Morgan BP, Campbell AK, Wilkins P, Cole G, Tho-
mas ND, Jasani B: Immunocytochemical localization of the ter-
minal complement complex in multiple sclerosis. Neuropathol
Appl Neurobiol 1989, 15:307-316.
36. Prineas JW, Kwon EE, Cho ES, Sharer LR, Barnett MH, Oleszak EL,
Hoffman B, Morgan BP: Immunopathology of secondary-pro-
gressive multiple sclerosis. Ann Neurol 2001, 50:646-657.
37. Schwab C, McGeer PL: Complement activated C4d immunore-
active oligodendrocytes delineate small cortical plaques in
multiple sclerosis. Exp Neurol 2002, 174:81-88.
38. Yamada T, Akiyama H, McGeer PL: Complement-activated oli-
godendroglia: a new pathogenic entity identified by immu-
nostaining with antibodies to human complement proteins
C3d and C4d. Neurosci Lett 1990, 112:161-166.
39. Yamada T, McGeer PL, McGeer EG: Relationship of comple-
ment-activated oligodendrocytes to reactive microglia and
neuronal pathology in neurodegenerative disease. Dementia
1991, 2:71-77.