báo cáo hóa học: "Fibrillar beta-amyloid peptide Aβ1–40 activates microglial proliferation via stimulating TNF-α release and H2O2 derived from NADPH oxidase: a cell culture study" doc
Bạn đang xem bản rút gọn của tài liệu. Xem và tải ngay bản đầy đủ của tài liệu tại đây (382.51 KB, 13 trang )
BioMed Central
Page 1 of 13
(page number not for citation purposes)
Journal of Neuroinflammation
Open Access
Research
Fibrillar beta-amyloid peptide Aβ
1–40
activates microglial
proliferation via stimulating TNF-α release and H
2
O
2
derived from
NADPH oxidase: a cell culture study
Aiste Jekabsone
1
, Palwinder K Mander
1
, Anna Tickler
2
, Martyn Sharpe
3
and
GuyCBrown*
1
Address:
1
Department of Biochemistry, University of Cambridge, Tennis Court Road, Cambridge CB2 1QW, UK,
2
Cavendish laboratory, University
of Cambridge, Cambridge CB3 0HE, UK and
3
Biochemistry and Molecular Biology Department, Biochemistry Building, Michigan State University,
East Lansing, MI 48824-1319, USA
Email: Aiste Jekabsone - ; Palwinder K Mander - ;
Anna Tickler - ; Martyn Sharpe - ; Guy C Brown* -
* Corresponding author
Abstract
Background: Alzheimer's disease is characterized by the accumulation of neuritic plaques,
containing activated microglia and β-amyloid peptides (Aβ). Fibrillar Aβ can activate microglia,
resulting in production of toxic and inflammatory mediators like hydrogen peroxide, nitric oxide,
and cytokines. We have recently found that microglial proliferation is regulated by hydrogen
peroxide derived from NADPH oxidase. Thus, in this study, we investigated whether Aβ can
stimulate microglial proliferation and cytokine production via activation of NADPH oxidase to
produce hydrogen peroxide.
Methods: Primary mixed glial cultures were prepared from the cerebral cortices of 7-day-old
Wistar rats. At confluency, microglial cells were isolated by tapping, replated, and treated either
with or without Aβ. Hydrogen peroxide production by cells was measured with Amplex Red and
peroxidase. Microglial proliferation was assessed under a microscope 0, 24 and 48 hours after
plating. TNF-α and IL-1β levels in the culture medium were assessed by ELISA.
Results: We found that 1 µM fibrillar (but not soluble) Aβ
1–40
peptide induced microglial
proliferation and caused release of hydrogen peroxide, TNF-α and IL-1β from microglial cells.
Proliferation was prevented by the NADPH oxidase inhibitor apocynin (10 µM), by the hydrogen
peroxide-degrading enzyme catalase (60 U/ml), and by its mimetics EUK-8 and EUK-134 (20 µM);
as well as by an antibody against TNF-α and by a soluble TNF receptor inhibitor. Production of
TNF-α and IL-1β, measured after 24 hours of Aβ treatment, was also prevented by apocynin,
catalase and EUKs, but the early release (measured after 1 hour of Aβ treatment) of TNF-α was
insensitive to apocynin or catalase.
Conclusion: These results indicate that Aβ
1–40
-induced microglial proliferation is mediated both
by microglial release of TNF-α and production of hydrogen peroxide from NADPH oxidase. This
suggests that TNF-α and NADPH oxidase, and its products, are potential targets to prevent Aβ-
induced inflammatory neurodegeneration.
Published: 07 September 2006
Journal of Neuroinflammation 2006, 3:24 doi:10.1186/1742-2094-3-24
Received: 16 March 2006
Accepted: 07 September 2006
This article is available from: />© 2006 Jekabsone et al; licensee BioMed Central Ltd.
This is an Open Access article distributed under the terms of the Creative Commons Attribution License ( />),
which permits unrestricted use, distribution, and reproduction in any medium, provided the original work is properly cited.
Journal of Neuroinflammation 2006, 3:24 />Page 2 of 13
(page number not for citation purposes)
Background
Alzheimer's disease is characterised by neuritic plaques
that contain dead and dying neurons and their processes,
inflammatory-activated microglia and β-amyloid peptides
Aβ
1–40
and Aβ
1–42
[1,2]. The disease is accompanied by
brain inflammation, characterised by increased cytokine
levels and increased numbers of activated microglia [3].
Epidemiological studies have indicated that non-steroidal
anti-inflammatory drugs (cyclooxygenase inhibitors) pre-
vent or delay the onset of Alzheimer's, suggesting that
brain inflammation contributes to disease progression
prior to clinical symptoms [4,5]. β-Amyloid and cytokines
cause inflammatory activation of glia, and inflammatory-
activated microglia are consistently found in the neuritic
plaques of Alzheimer's patients [1,2]. β-Amyloid,
cytokines and/or bacteria-activated microglia potently kill
co-cultured neurons, and the ultimate means by which
neurons are killed in a wide range of brain pathologies
may be inflammatory neurodegeneration mediated by
activated microglia [3,6-9]. It is therefore vital to under-
stand how glial activation and subsequent neuronal death
can be prevented.
Microglia have a specific NADPH oxidase known as
PHOX (phagocytic oxidase), consisting of subunits gp91
(NOX2), p22, p47, p67, p40 and Rac [3]. Normally in
resting microglia this oxidase is relatively inactive and
unassembled, but when activated by β-amyloid, bacteria
and/or cytokines, the oxidase assembles at the plasma
membrane, and produces superoxide that is released
extracellularly or into phagosomes at a high rate. The
superoxide either dismutates to hydrogen peroxide or
reacts with nitric oxide to produce cytotoxic peroxynitrite
[7,8]. We and others believe that NADPH oxidase activa-
tion is the key event converting resting microglia to acti-
vated, proliferating, cytotoxic microglia; and, therefore,
that blocking oxidase activation may block inflammatory
neurodegeneration [3,6,8-12].
We have recently found that proliferation of microglia is
dependent on H
2
O
2
from PHOX, that cytokines, ara-
chidonate and ATP stimulate microglial proliferation via
stimulating H
2
O
2
production from PHOX; and that inhib-
iting PHOX prevents this [10]. We also found that micro-
glial PHOX and reactive oxygen and nitrogen species are
key mediators of inflammatory killing of neurons [7,8,13-
15]. Others have shown that activation of H
2
O
2
produc-
tion from PHOX is a required step for inflammatory acti-
vation of microglia (measured by iNOS expression and
cytokine production) induced by LPS [11,12]. Since β-
amyloid is known to activate superoxide or H
2
O
2
produc-
tion from the microglial PHOX [9,16,17], we test here
whether this activation is responsible for β-amyloid-
induced proliferation of microglia and cytokine produc-
tion.
Materials and methods
Materials
Apocynin was purchased from Calbiochem; EUK-8 and
EUK-134 were synthesized as previously described in
[18]; Amplex Red, Dulbecco's Modified Eagle Medium
(DMEM), Earl's Balanced Salt Solution (EBSS), Isolectin
GS-IB4 from Griffonia simplicifolia conjugated with
AlexaFluor488, Phosphate-Buffered Saline (PBS), ready-
to-use Streptavidin-horse radish peroxidase (HRP) conju-
gate were purchased from Invitrogen; Anti-rat TNF-α
monoclonal antibody was purchased from R&D Systems;
soluble TNF receptor inhibitor/Fc chimera was purchased
from GenScript Corporation; Biotin anti-rat TNF-α poly-
clonal antibody was purchased from Insight Biotechnol-
ogy Ltd.; all other chemicals were purchased from Sigma.
A
β
1–40
peptide source, fibrillization, and identification of
fibrillization state
Aβ
1–40
peptide was synthesized as described [19]. The pep-
tide was dissolved in water to make a stock solution of 0.1
mM. Part of the solution (further used as soluble Aβ
1–40
peptide stock solution) was immediately aliquoted in
small single-use fractions and stored at -20°C. Another
part of the solution was kept at 37°C for 7 days to induce
peptide aggregation and fibril formation. Fibrillization of
the peptide was confirmed by its ability to change Thiofla-
vine T fluorescence spectra, as described [20]. A 5 µM
solution of fibrillar peptide in PBS (pH6.0) changed Thio-
flavine T (3 µM) fluorescence spectra: in excitation spec-
trum it induced a peak at λ
em
= 450 nm, and in emission
spectrum a peak appeared at λ
ex
= 482 nm. None of these
peaks could be seen with the dye alone or with the dye
plus 5 µM soluble Aβ
1–40
peptide. After aggregation, the
stock solution of fibrillar Aβ
1–40
peptide was also aliq-
uoted in smaller fractions and stored at -20°C. After re-
thawing the fibrillar state of the peptide remained
unchanged.
Preparation of pure microglial culture
Primary mixed astrocyte and microglial cultures were used
for pure microglial culture preparation. Mixed glial cul-
tures were prepared from the cerebral cortices of 7-day-old
Wistar rats. After dissection of the cerebral hemispheres,
meninges were removed and the tissue was dissociated in
a solution of EBSS containing 0.3% BSA, 103.2 Kunitz
units/ml DNase I and 3800 BAEE units/ml Trypsin. Cells
were plated at 2 × 10
5
cells/cm
2
in 75 cm
2
flasks coated
with 0.0005% poly-L-lysine. Cultures were maintained in
DMEM supplemented with 10% foetal calf serum and 1
mg/ml gentamicin. Cells were kept at 37°C in a humidi-
fied atmosphere of 5% CO
2
and 95% air.
When mixed glial cultures reached confluency (on 6
th
–8
th
day in vitro), microglial cells were isolated by shaking and
tapping the flasks. Medium from the mixed glial cultures,
Journal of Neuroinflammation 2006, 3:24 />Page 3 of 13
(page number not for citation purposes)
containing dislodged microglial cells, was removed and
centrifuged (135 g) for 5 min. The supernatant was dis-
carded and cells were resuspended either in DMEM with
the same supplements as for mixed glial cultures (for pro-
liferation and inflammatory cytokines measurements) or
in Hanks' Balanced Salt Solution (for hydrogen peroxide
assay).
Assessment of microglial culture purity, cell viability, and
proliferation
After isolation from mixed glial cultures, microglial cells
were plated in 96-well plates at 15 × 10
3
cells/cm
2
. Two
hours after plating, cultures were stained with isolectin
IB
4
-AlexaFluor488 conjugate, which has a strong affinity
for microglia but not for astrocytes [21]. The dye specifi-
cally stains microglia regardless of their activation status
[22], and we found that it does not affect cell viability or
proliferation up to 72 hours; thus, it can be used for visu-
alization of microglia before the start of experiment. Iso-
lectin IB
4
, 10 ng/ml, was added to cells and incubated for
15 min at 37°C. Stained cells were counted using fluores-
cence microscope Axiovert S-100 (λ
ex
= 488 nm, λ
em
= 530
nm), and all cells were counted under light phase contrast
in the same microscopic fields. The purity of the cultures
was 99.70 ± 0.01% (mean ± SE, n = 12). The number of
IB
4
-stained cells per microscopic field was considered as
cell number at time '0'. Then, treatment was started with
1 µM fibrillar Aβ
1–40
or 1 µM fibrillar Aβ
1–40
, alone or
together with either (i) 10 µM apocynin (an NADPH oxi-
dase inhibitor), (ii) 60 IU/ml catalase (the enzyme that
converts hydrogen peroxide to water and oxygen), (iii)
either of the catalase mimetics EUK-8 or EUK-134 (both
at 20 µM), (iv) 40 µg/ml anti-TNF-α, or (v) 10 ng/ml sol-
uble TNF receptor inhibitor. Experiments were also per-
The effect of Aβ
1–40
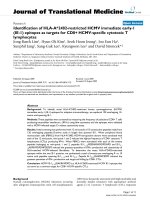
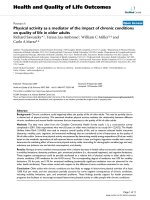
peptide on microglial proliferation at 24 hoursFigure 1
The effect of Aβ
1–40
peptide on microglial proliferation at 24 hours. Microglial cultures were incubated with 1 µM fibrillar (f) or
soluble (s) Aβ
1–40
, the NADPH oxidase inhibitor apocynin (10 µM), and/or with the hydrogen peroxide converters catalase (60
IU/ml) or EUK-8/-134 (20 µM) for 24 hours. After a 24 hour incubation, microglial cells were counted and their numbers
expressed as percentage of cell number at time '0'. The dashed line indicates cell number at time '0' i.e. 100%. Data are
expressed as mean of 5 experiments ± standard error. Statistical analysis used: Student's t-test, p < 0.05; * – significant differ-
ence compared to the control; # – significant difference compared to samples treated with fibrillar Aβ only.
*
200
me '0'
E
U
K
-
1
3
4
s
A
E
E
U
K
-
8
C
a
t
a
l
a
s
e
A
p
o
c
y
n
i
n
E
U
K
-
1
3
4
E
U
K
-
8
C
a
t
a
l
a
s
e
A
p
o
c
y
n
i
n
f A
E
C
o
n
t
r
o
l
0
50
100
150
% of cell number at ti
#
#
#
#
24 hrs
Journal of Neuroinflammation 2006, 3:24 />Page 4 of 13
(page number not for citation purposes)
formed with 1 µM soluble Aβ
1–40
, with apocynin, catalase
or EUKs without Aβ; with 10 pg/ml phorbol 12-myristate
13-acetate (PMA, an NADPH oxidase activator), or with
PMA together with apocynin or catalase.
After 24 or 48 hours, the cultures were stained again with
isolectin IB
4
for detection of microglia (as described
above), with Hoechst 33342 for visualization of all nuclei
and for detection of chromatin-condensed (apoptotic)
nuclei, and with propidium iodide for detection of
necrotic nuclei (10 µg/ml Hoechst, 2 µg/ml propidium
iodide, incubated 5 min at room temperature, visualized
using fluorescence microscope at λ
ex
= 365 nm, λ
em
= 420
nm).
In every experiment, cells were counted in 5 microscopic
fields for each well, and there were 6 wells for each treat-
ment, as well as for untreated cells. The total number of
cells counted for each treatment was 314 – 875.
There were no chromatin-condensed nuclei detected in
the cultures. The percentage of necrotic microglial nuclei
was 0.75 ± 0.03 (mean ± SE, n = 7) after 24 hours, and
1.54 ± 0.07 (n = 5) after 48 hours, and this did not differ
significantly between untreated and amyloid β peptide-,
apocynin-, catalase- or EUKs-treated cultures. Microglial
numbers after 24 and 48 hours of incubation were
expressed as percentage of time '0' numbers, and this was
considered as a measure of microglial proliferation.
Measurement of TNF-
α
and IL-1
β
concentration
Pure microglial cultures were incubated under the same
conditions and with the same treatments as for prolifera-
tion measurements (described above), except for anti-
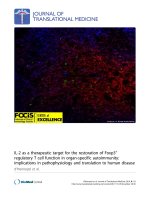
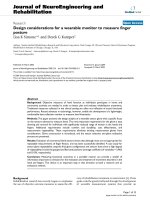
The effect of Aβ
1–40
peptide on microglial proliferation at 48 hoursFigure 2
The effect of Aβ
1–40
peptide on microglial proliferation at 48 hours. Microglial cultures were incubated with 1 µM fibrillar (f) or
soluble (s) Aβ
1–40
, the NADPH oxidase inhibitor apocynin (10 µM), and/or with the hydrogen peroxide converters catalase (60
IU/ml) and EUK-8/-134 (20 µM) for 48 hours. After a 48 hour incubation, microglial cells were counted and their numbers
expressed as percentage of cell number at time '0'. The dashed line indicates cell number at time '0'. Data are expressed as
mean of 5 experiments ± standard error. Statistical analysis used: Student's t-test, p < 0.05; * – significant difference compared
to the control; # – significant difference compared to samples treated with fibrillar Aβ only.
400
time '0'
*
C
o
n
t
r
o
l
f A
E
A
p
o
c
y
n
i
n
E
U
K
-
8
EU
K
-
1
4
3
C
a
t
a
l
a
s
e
s
A
E
A
p
o
c
y
n
i
n
EU
K
-
8
E
U
K
-
1
3
4
C
a
t
a
l
a
s
e
0
100
200
300
% of cell number at
#
#
#
#
48 hrs
Journal of Neuroinflammation 2006, 3:24 />Page 5 of 13
(page number not for citation purposes)
TNF-α treatment. The culture medium was collected from
cells after 1, 6, 24 or 48 hours. The amounts of inflamma-
tory cytokines in the medium were detected by ELISA. The
data presented in Fig. 4 and 5 are obtained by using kits
for rat TNF-α and IL-1β (Quantikine, R&D Systems),
assaying the samples according to the manufacturer's pro-
tocol provided with the kits. For the data in Fig. 6 and 7
the following protocol was used: clear polystyrene micro-
plates (R&D Systems) were covered with monoclonal
anti-rat TNF-α antibody (100 µl/well, 20 µg/ml) by incu-
bating overnight at room temperature. Then the wells
were aspirated and washed with Wash buffer (0.05%
Tween 20 in PBS, pH7.4) 5 times (the aspiration and
washing with the same buffer was repeated before each
following addition), and the plates were blocked with 300
µl per well of blocking solution (PBS containing 1% BSA
and 5% sucrose) for 2 hours at room temperature. Then,
50 µl of the blocking solution was added to each well fol-
lowed by the addition of 100 µl per well of samples or
standards diluted in PBS (the standards from TNF-α ELISA
Kit, R&D Systems, were used) and the plates were incu-
bated 2 hours at room temperature. After this, 100 µl of
biotin anti-TNF (2 µg/ml of the blocking solution) was
added to each well and incubated for 2 hours at room
temperature, followed by a 20 min incubation with 100 µl
(2 drops) per well of streptavidin-HRP ready-to use solu-
tion. Finally, 100 µl/well substrate solution (0.05%
3,3',5,5'-tetramethylbenzidine and 0.012% H
2
O
2
in 0.05
M citrate buffer, pH5.0) was added and incubated for 30
minutes at 37°C. The reaction was stopped with 1 M
H
2
SO
4
, 50 µl/well, and the optical density at λ = 450 nm
was measured in a microplate reader (Emax, Molecular
Devices). Concentrations of TNF-α in the samples were
calculated from the calibration curve constructed using
known amounts of rat TNF-α standards.
Detection of hydrogen peroxide
Hydrogen peroxide formed by isolated microglia was
measured in a fluorometric assay, using horseradish per-
oxidase oxidation of Amplex Red to fluorescent resorufin.
The reaction mixture of a control sample contained 1 µM
Amplex Red, 10 U/ml horseradish peroxidase and 3 × 10
5
microglia/ml resuspended in Hanks' balanced salt solu-
tion (HBSS; 5.33 mM KCl, 0.441 mM KH
2
PO
4
, 138 mM
NaCl, 0.338 mM NaH
2
PO
4
, 4.17 mM NaHCO
3
, 1.26 mM
CaCl
2
, 0.493 mM MgCl
2
·6H
2
O, MgSO
4
·7H
2
O, pH 7.4 at
room temperature) with 50 mM freshly added glucose.
Other samples had added either 1 µM fibrillar Aβ
1–40
or 1
µM soluble Aβ
1–40
. Hydrogen peroxide levels in the sam-
ples were measured in a stirred cuvette using a Shimadzu
RF-1501 spectrofluorophotometer (λ
ex
= 560 nm, λ
em
=
587 nm). Measurements were done immediately after
sample preparation and repeated again after incubation
for 2 hours at 37°C. The increase in fluorescence of each
sample over two hours was converted to amount of
hydrogen peroxide according to a calibration curve con-
structed using known concentrations of added hydrogen
peroxide. The data (shown in Fig. 9) are presented as
amount of hydrogen peroxide produced by 10
5
cells per 1
hour.
Results
The effect of A
β
1–40
on microglial proliferation
After incubation of pure microglial cultures with 1 µM
fibrillar Aβ
1–40
for 24 hours, the number of cells increased
to 204 ± 9% of the cell number counted at time point '0'
(Fig. 1), i.e. the cell density doubled in 24 hours. The
number of cells in untreated control cultures did not sig-
nificantly change over the same time period. When micro-
glia were incubated with fibrillar Aβ
1–40
for 48 hours, cells
continued to proliferate to 372 ± 53% of the initial
number, whereas in the untreated control the number of
cells increased to 223 ± 28% of the initial number (Fig. 2).
Soluble (non-fibrillized) Aβ
1–40
used at the same concen-
tration as the fibrillar peptide had no effect on cell prolif-
eration rate, measured at 24 (Fig. 1) or 48 hours (Fig. 2).
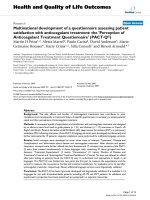
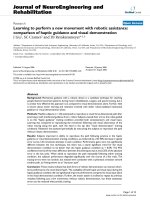
Microglial proliferation stimulated by PMAFigure 3
Microglial proliferation stimulated by PMA. Microglial cul-
tures were incubated with 10 pg/ml of the NADPH oxidase
activator phorbol 12-myristate 13-acetate (PMA), alone or
together with the NADPH oxidase inhibitor apocynin (10
µM), or the hydrogen peroxide converter catalase (60 IU/ml)
for 24 hours; then microglial cells were counted and their
numbers were expressed as percentage of cell number at the
start of the treatment, or time'0'. The dashed line indicates
cell number at time '0'. Data are expressed as mean of 4
experiments ± standard error, Statistical analysis used: Stu-
dent's t-test, p < 0.05; * – significant difference compared to
the control; # – significant difference compared to samples
treated with PMA only.
C
o
n
t
r
o
l
PMA
A
p
o
c
y
n
i
n
C
a
t
a
l
a
s
e
0
50
100
150
200
250
% of cell number at time '0
'
*
#
#
C
o
n
t
r
o
l
PMA
A
p
o
c
y
n
i
n
C
a
t
a
l
a
s
e
0
50
100
150
200
250
% of cell number at time '0
'
*
#
#
Journal of Neuroinflammation 2006, 3:24 />Page 6 of 13
(page number not for citation purposes)
We have recently found that microglial proliferation can
be regulated by hydrogen peroxide derived from NADPH
oxidase [10]. To test whether NADPH oxidase is involved
in Aβ
1–40
-stimulated proliferation of microglia we incu-
bated pure microglial cultures with fibrillar Aβ
1–40
in the
presence of 10 µM apocynin, an inhibitor of NADPH oxi-
dase. Apocynin completely blocked the effect of Aβ
1–40
in
both 24- and 48-hour treatments (Fig. 1 &2). The hydro-
gen peroxide-degrading enzyme catalase (60 IU/ml), and
its mimetics EUK-8 and EUK-134 (Mn-Salen compounds
with both catalase and superoxide dismutase [18], both at
20 µM), also significantly decreased the effect of fibrillar
Aβ
1–40
(Fig. 1 &2) suggesting that hydrogen peroxide is
important in the stimulation of microglial proliferation
by the peptide. There was no effect of apocynin, catalase
or EUKs on microglial proliferation without Aβ
1–40
(Fig. 1
&2), and there was no increase in cell death caused by
these compounds, as assessed by propidium iodide stain-
ing of the cultures (not shown).
Treatment of microglial cultures for 24 h with a low con-
centration of the NADPH oxidase activator PMA (10 pg/
ml) caused an increase in proliferation rate similar to that
induced by fibrillar Aβ over the same time period (com-
pare Fig. 3 to Fig. 1), and this increase was completely pre-
vented by apocynin and catalase. This suggests that
activation of NADPH oxidase is sufficient to induce
microglial proliferation via H
2
O
2
production, and that
activation of the oxidase by fibrillar Aβ could be sufficient
to explain fibrillar Aβ-induced microglial proliferation.
The effect of A
β
1–40
on inflammatory cytokine release by
microglia
After incubation of pure microglial cultures with 1 µM
fibrillar Aβ
1–40
for 1, 6, 24 or 48 hours, media were col-
lected from the cells and screened for TNF-α and/or IL-1β
levels. We found that the medium TNF-α levels after 1-, 6-
, 24- and 48-hour incubations with fibrillar Aβ were 47 ±
8, 186 ± 57, 164 ± 17 and 95 ± 7 pg/ml, respectively,
whereas levels in the absence of Aβ were undetectable,
undetectable, 22 ± 13 and 54 ± 14 pg/ml, respectively,
after same time points. TNF-α levels in soluble Aβ-treated
samples remained low: they were 10 ± 6, 12 ± 6, and 8 ±
5 pg/ml after 1, 6 and 24 hours, respectively.
There was no detectable IL-1β in fibrillar or soluble Aβ
1–
40
-treated samples, or in untreated control samples, after
6 hours of incubation (data not shown). However, when
cells were kept with the fibrillar peptide for 24 hours, IL-
1β levels in the cell-conditioned medium increased to 109
± 12 pg/ml, while IL-1β concentrations remained close to
zero in controls and in samples treated with soluble Aβ
(Fig. 6).
These experiments indicate that fibrillar Aβ
1–40
peptide
activates microglia to produce and/or release inflamma-
tory cytokines. The release of TNF-α is much more rapid
than that of IL-1β. Next, we tested whether this cytokine
release is mediated by hydrogen peroxide from NADPH
oxidase. Pure microglial cultures were incubated with
Aβ
1–40
peptide together with 10 µM apocynin, with 60 IU/
ml catalase (for TNF-α and IL-1β measurements), or with
20 µM EUK-8 or EUK-134 (for IL-1β measurements), after
which cytokine concentrations in the incubation media
were assessed.
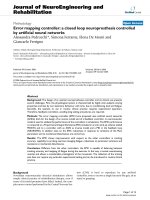
TNF-α levels in fibrillar Aβ-treated cultures were already
elevated after 1 hour of treatment; it is therefore probable
that Aβ is promoting release of pre-formed TNF-α, rather
than (or in addition to) promoting TNF-α production per
se. A 1-hour incubation with fibrillar Aβ peptide caused
the medium TNF-α level to increase from 2 ± 3 to 47 ± 8
pg/ml, and neither apocynin nor catalase significantly
inhibited this release (Fig. 4). A 1-hour treatment with sol-
uble Aβ
1–40
had no significant effect on the TNF-α concen-
tration in the medium. These data suggest that early
release of TNF-α from microglia in the presence of fibrillar
Aβ
1–40
occurs independently of NADPH oxidase activa-
tion and H
2
O
2
formation.
The early release of TNF-α by fibrillar Aβ
1–40
Figure 4
The early release of TNF-α by fibrillar Aβ
1–40
. Microglial cul-
tures were incubated with 1 µM fibrillar (f) or soluble (s)
Aβ
1–40
, alone of together with 10 µM apocynin or 60 IU/ml
catalase for 1 hour. TNF-α levels were assessed in the media
collected from the cultures. Data are expressed as mean of 4
experiments ± standard error; statistical analysis used: Stu-
dent's t-test, p < 0.05; * – significant difference compared to
the control.
50
60
*
[TNF-
D
], pg/ml
0
10
20
30
40
C
o
n
t
r
o
l
fAE
A
p
o
c
y
n
i
n
C
a
t
a
l
a
s
e
s
A
E
Journal of Neuroinflammation 2006, 3:24 />Page 7 of 13
(page number not for citation purposes)
After 24 hours of incubation with the NADPH oxidase
inhibitor, apocynin, there was partial blockage of Aβ
1–40
peptide-induced TNF-α release: cytokine levels in Aβ
1–40
+
apocynin-treated samples were 70% lower compared to
samples treated only with Aβ
1–40
(Fig. 5). Catalase was
also effective in decreasing (by 38%) the Aβ
1–40
-induced
TNF-α release. However, none of the treatments com-
pletely prevented Aβ-induced increases in TNF-α levels
after 24 hours. This suggests that the NADPH oxidase and
H
2
O
2
may mediate Aβ-induced TNF-α production, but
not release.
Aβ
1–40
-induced IL-1β increases over 24 hours were almost
completely stopped by apocynin, catalase and EUKs (Fig.
6), indicating that Aβ-induced production or release of IL-
1β is dependent on hydrogen peroxide from active
NADPH oxidase. Apocynin, catalase and EUKs alone also
slightly increased IL-1β concentration in microglia-condi-
The effect of NADPH oxidase inhibitor and hydrogen peroxide scavengers on 24 hour treatment with Aβ
1–40
peptide-induced TNF-α release from microgliaFigure 5
The effect of NADPH oxidase inhibitor and hydrogen peroxide scavengers on 24 hour treatment with Aβ
1–40
peptide-induced
TNF-α release from microglia. Microglial cultures were incubated with 1 µM fibrillar (f) or soluble (s) Aβ
1–40
, and/or with 10
µM apocynin, 60 IU/ml catalase, or 20 µM EUK-8/-134 for 24 hours. Then, TNF-α concentrations were measured in the cell
incubation media. DMEM – microglial incubation medium not pre-incubated with cells. Data are expressed as mean of 6 exper-
iments ± standard error; statistical analysis used: Student's t-test, p < 0.05; * – significant difference compared to the control; #
– significant difference compared to samples treated with fibrillar Aβ only.
0
50
100
150
200
*
[TNF-
D
], pg/ml
DM
E
M
Co
n
t
r
o
l
fAE
A
p
o
c
y
n
in
Ca
t
a
la
s
e
^
^
*
Ap
o
c
y
n
in
Ca
t
a
l
a
s
e
s
A
E
Journal of Neuroinflammation 2006, 3:24 />Page 8 of 13
(page number not for citation purposes)
tioned medium, but the increase was significant only with
catalase treatment.
In order to test whether activation of NADPH oxidase
would be sufficient to cause TNF-α production or release,
we treated microglia with PMA (10 pg/ml) ± apocynin or
± catalase, and measured TNF-α in the medium after 24
hours. PMA did indeed increase TNF-α levels, to a degree
similar to that caused by fibrillar Aβ, and this PMA-
induced increase was blocked by apocynin and catalase
(Fig. 7).
The effect of TNF-
α
neutralisation on A
β
1–40
-induced
microglial proliferation
TNF-α is known to induce microglial proliferation, and
we have previously shown that this induced proliferation
is mediated by the NADPH oxidase [10]. The data pre-
sented elsewhere in this study suggest that in the presence
of fibrillar Aβ
1–40
, TNF-α release may precede NADPH oxi-
dase activation. Thus, TNF-α may mediate Aβ-induced
microglial proliferation upstream of NADPH oxidase. To
test this hypothesis, we incubated microglial cultures with
1 µM fibrillar Aβ
1–40
and either 40 µg/ml anti-TNF-α mon-
oclonal antibody or 10 ng/ml soluble TNF receptor inhib-
itor for 24 hours and assessed proliferation of the cells.
Both anti-TNF-α antibody and soluble TNF receptor
inhibitor completely inhibited the increase in prolifera-
The effect of NADPH oxidase inhibitor and hydrogen peroxide scavengers on Aβ
1–40
peptide-induced IL-1β release from microgliaFigure 6
The effect of NADPH oxidase inhibitor and hydrogen peroxide scavengers on Aβ
1–40
peptide-induced IL-1β release from
microglia. Microglial cultures were incubated with 1 µM fibrillar (f) or soluble (s) Aβ
1–40
, and/or with 10 µM apocynin, 60 IU/ml
catalase, or 20 µM EUK-8/-134 for 24 hours. Then, IL-1β concentrations were measured in the cell incubation media. DMEM –
microglial incubation medium not pre-incubated with cells. Data are expressed as mean of 7 experiments ± standard error; sta-
tistical analysis used: Student's t-test, p < 0.05; * – significant difference compared to the control; # – significant difference com-
pared to samples treated with fibrillar Aβ only.
[IL-1
E
], pg/ml
-20
0
20
40
60
80
100
120
140
*
fAE
DM
E
M
Co
n
t
r
ol
Ap
o
c
y
n
i
n
Ca
t
a
l
a
s
e
E
UK-
8
E
UK-
1
3
4
A
p
o
c
y
n
i
n
Ca
t
a
l
a
s
e
E
UK-
8
E
U
K-
1
3
4
^
*
^
^
^
s
A
E
Journal of Neuroinflammation 2006, 3:24 />Page 9 of 13
(page number not for citation purposes)
tion induced by fibrillar Aβ (Fig. 8), indicating that Aβ-
induced proliferation is mediated by TNF-α release. As
expected, the antibody and the inhibitor also prevented
microglial proliferation induced by TNF-α itself (Fig. 8).
The effect of A
β
1–40
on hydrogen peroxide generation by
microglia
The above data suggest that fibrillar Aβ peptide stimulates
microglia in part via activating hydrogen peroxide produc-
tion from the microglial NADPH oxidase. We therefore
measured hydrogen peroxide production by microglia in
the presence and absence of fibrillar Aβ
1–40
. There was no
detectable change in the rate of hydrogen peroxide pro-
duction immediately after addition of the peptide (1 µM),
even when the Aβ concentration was increased up to 50
µM (data not shown). However, after 2 hours of incuba-
tion with 1 µM fibrillar Aβ
1–40
, microglia produced signif-
icantly larger amounts of hydrogen peroxide than did
untreated control cells (Fig. 9). Cells that were incubated
with the soluble form of the peptide produced the same
amount of hydrogen peroxide as the untreated controls.
An inhibitor of NADPH oxidase, diphenylene iodonium
(DPI, 20 µM), prevented hydrogen peroxide generation
by fibrillar Aβ
1–40
peptide-treated, as well as by untreated
cells. Hydrogen peroxide production by the incubation
medium alone (0.17 pmol/ml hour) or by 1 µM fibrillar
peptide incubated in the medium without cells (0.25
pmol/ml hour) was low compared to that in the presence
of cells (4.2 pmol/ml hour in absence of Aβ, 6.6 pmol/ml
hour in the presence of fibrillar Aβ with 300,000 cells/
ml).
In this study we found that neutralisation of TNF-α blocks
fibrillar Aβ-induced microglial proliferation (Fig. 8). We
have reported previously that TNF-α stimulates microglial
proliferation, activating NADPH oxidase-derived hydro-
gen peroxide production [10]. Taken together, these data
suggest that fibrillar Aβ-induced increases in hydrogen
peroxide production by microglia can be mediated by
TNF-α. In contrast, soluble TNF receptor inhibitor (100
ng/ml) was not able to prevent fibrillar Aβ-caused stimu-
lation of hydrogen peroxide production over 2 hours, but
did effectively eliminate a 100 pg/ml TNF-α-induced
increase in hydrogen peroxide formation (data not
shown). This suggests that Aβ-induced activation of
NADPH oxidase is not mediated by TNF-α in this time
period.
Discussion
Beta amyloid has previously been reported to stimulate
superoxide or hydrogen peroxide production from iso-
lated microglia via activation of NADPH oxidase
[9,16,17], and our results are consistent with this. As we
have previously reported that hydrogen peroxide from
PHOX stimulates microglial proliferation [10], and others
have reported that hydrogen peroxide from PHOX stimu-
lates microglial cytokine production [11], we tested
whether Aβ
1–40
could stimulate microglial proliferation
and cytokine production via activating hydrogen peroxide
production from PHOX. Fibrillar Aβ
1–40
did indeed stim-
ulate the proliferation of isolated microglia, measured at
both 24 and 48 hours after Aβ
1–40
addition, whereas non-
fibrillized Aβ
1–40
had no effect on the rate of proliferation
(Fig. 1 &2). The stimulation of proliferation induced by
fibrillar Aβ
1–40
was completely prevented by either a spe-
cific inhibitor of PHOX (apocynin) or agents that remove
hydrogen peroxide (catalase, EUK-8, EUK-134), implicat-
ing hydrogen peroxide from PHOX as the mediator of
Aβ
1–40
-induced proliferation.
Microglial proliferation is associated with neuronal dam-
age in a variety of pathologies such as ischemia [23] or
compression injury [24], as well as in different animal
models of Alzheimer's disease [25,26]. Hydrogen perox-
ide and the NADPH oxidase can stimulate proliferation in
a number of different cell types [27-29]. It has been dem-
onstrated that hydrogen peroxide inhibits CD45 (a trans-
membrane tyrosine phosphatase expressed in cells of
monocytic lineage) [30], and it has recently been shown
that the activation of CD45 blocks GM-CSF-induced
The effect of PMA on TNF-α release by microgliaFigure 7
The effect of PMA on TNF-α release by microglia. Microglial
cultures were incubated with 1 µM fibrillar (f) Aβ
1–40
, with 10
pg/ml of the NADPH oxidase activator phorbol 12-myristate
13-acetate (PMA), or with PMA plus either the NADPH oxi-
dase inhibitor apocynin (10 µM) or the hydrogen peroxide
converter catalase (60 IU/ml) for 24 hours. TNF-α concen-
trations were measured in the cell incubation media. Data
are expressed as mean of 4 experiments ± standard error;
statistical analysis used: Student's t-test, p < 0.05; * – signifi-
cant difference compared to the control; # – significant dif-
ference compared to samples treated with PMA only.
C
o
n
t
ro
l
f
A
E
PMA
A
p
o
cy
n
i
n
C
at
a
l
a
se
*
*
#
#
[TNF-
D
], pg/ml
-20
0
20
40
60
80
120
010
Journal of Neuroinflammation 2006, 3:24 />Page 10 of 13
(page number not for citation purposes)
microglial proliferation [31]. There is evidence that hydro-
gen peroxide can oxidise critical sulphydryl groups in
tyrosine phosphatases [32], which results in increased
tyrosine phosphorylation and prolongation of mitogenic
signalling [31,33]. Thus CD45 might be one potential tar-
get for hydrogen peroxide in regulating microglial prolif-
eration.
Proliferation of microglia is a key component of the
brain's inflammatory response, as microglia are central to
this response and levels of microglia in the resting (non-
inflammed) brain are low (roughly 5% of all brain cells)
[34]. Microglia are a major source of pro-inflammatory
cytokines, particularly IL-1β and TNF-α, that cause
inflammatory activation of the brain. We found that Aβ
1–
40
induces IL-1β production by isolated microglia, and
that this induced production is almost completely
blocked by either a specific inhibitor of PHOX (apocynin)
or agents that remove hydrogen peroxide (catalase, EUK-
8, EUK-134, Fig. 6), implicating hydrogen peroxide from
PHOX as the mediator of Aβ
1–40
-induced IL-1β produc-
tion. Fibrillar Aβ
1–40
also induced TNF-α production and/
or release from microglia (Fig. 4 &5). The Aβ
1–40
-induced
TNF-α production and/or release was much more rapid
than the Aβ
1–40
-induced IL-1β production and/or release,
was only partially sensitive to catalase and apocynin at 24
The effect of anti-TNF-α antibody on fibrillar Aβ
1–40
-induced microglial proliferationFigure 8
The effect of anti-TNF-α antibody on fibrillar Aβ
1–40
-induced microglial proliferation. Microglial cultures were incubated with 1
µM fibrillar (f) Aβ
1–40
, or fAβ together with either 40 µg/ml anti-rat TNF-α antibody or 10 ng/ml soluble TNF receptor inhibi-
tor, or with 10 pg/ml TNF-α, alone or together with antibody or inhibitor, or with the antibody or the inhibitor alone for 24
hours. Cells were then counted and their numbers expressed as percentage of cell number at the start of the treatment, or
time'0'. The dashed line indicates cell number at time '0'. sTNFRI – soluble TNF receptor inhibitor. Data are expressed as
mean of 3–7 experiments ± standard error. Statistical analysis used: Student's t-test, p < 0.05; * – significant difference com-
pared to the control; # – significant difference compared to samples treated with fibrillar Aβ
1–40
only; & – significant difference
compared to TNF-α only-treated samples.
s
T
N
F
R
I
a
n
t
iT
N
F
-
D
s
T
N
F
R
I
a
n
t
i
T
N
F
-
D
s
T
N
F
R
I
TNF-
D
a
n
t
i
T
N
F
-
D
f A
E
C
o
n
t
r
o
l
0
50
100
150
200
250
% of cell number at t
300
ime '0'
*
*
#
&
#
&
Journal of Neuroinflammation 2006, 3:24 />Page 11 of 13
(page number not for citation purposes)
hours, and was insensitive at 1 hour (Fig. 4 &5). This sug-
gests that Aβ
1–40
causes early TNF-α release by mecha-
nisms unrelated to NADPH oxidase activation, and
presumably not mediated by gene expression and transla-
tion, whereas the later TNF-α production may be medi-
ated by PHOX/H
2
O
2
regulated gene transcription and
translation. As Aβ causes early TNF-α release (Fig. 4), and
TNF-α stimulates microglial proliferation (Fig. 8), we
tested whether Aβ
1–40
-induced microglial proliferation
might be mediated by TNF-α release. We found that an
anti-TNF-α antibody and a soluble TNF receptor inhibitor
both prevented Aβ-induced proliferation (Fig. 8), indicat-
ing that Aβ-induced proliferation is mediated by TNF-α
release. As TNF-α induces microglial proliferation via
stimulating the NADPH oxidase to produce H
2
O
2
[10],
this is consistent with Aβ-induced proliferation being
mediated by PHOX. A minimal model consistent with
these results is presented in Fig. 10.
The concentration of Aβ
1–40
used in this work (1 µM) is a
pathophysiologically relevant concentration that has little
direct toxicity to neurons or astrocytes, but can cause tox-
icity to neurons indirectly by inflammatory activation of
co-cultured microglia [9]. Aβ
1–40
peptide is more abun-
dant in the brain than Aβ
1–42
peptide [35]. The means by
which these peptides, when fibrillized, activate NADPH
oxidase in microglia is unclear; it may involve stimulation
of phagocytosis via a receptor complex that includes a β1
integrin [36], or it may be mediated by TNF-α release.
Whatever the mechanism, these data suggest that TNF-α
and NADPH oxidase may be potential targets, and that
apocynin and the EUKs may be potential drugs for Alzhe-
Production of hydrogen peroxide by isolated microglial cells in the presence of Aβ
1–40
peptideFigure 9
Production of hydrogen peroxide by isolated microglial cells in the presence of Aβ
1–40
peptide. Microglial cells were incubated
in HBSS with 1 µM fibrillar (f) or soluble (s) Aβ
1–40
, or with f Aβ
1–40
together with 20 µM diphenylene iodonium (DPI) for 2
hours at 37°C. Hydrogen peroxide production was measured in a fluorometric assay. Data are expressed as mean of 4–7
experiments ± standard error. Statistical analysis used: Student's t-test, p < 0.05; * – significant difference compared to the con-
trol; # – significant difference compared to samples treated with fibrillar Aβ only.
n
o
c
e
l
ls
s
A
E
C
o
n
t
r
o
l
H
BS
S
D
P
I
D
P
I
0
0.5
1
1.5
2
2.5
3
H
2
O
2
, pmol / 10
5
cells x hour
*
f A
E
#
Journal of Neuroinflammation 2006, 3:24 />Page 12 of 13
(page number not for citation purposes)
imer's-associated inflammation and inflammatory neuro-
degeneration.
Conclusion
We found that fibrillar Aβ-induced microglial prolifera-
tion is mediated by NADPH oxidase, hydrogen peroxide
and TNF-α. In the presence of Aβ
1–40
, microglial cells pro-
life rate, and this is prevented either by inhibiting NADPH
oxidase, by removing hydrogen peroxide, or by neutralis-
ing released TNF-α with an antibody.
Fibrillar Aβ
1–40
induces a rapid, NADPH oxidase-inde-
pendent release of TNF-α by microglial cultures; however,
prolonged exposure to the peptide causes PHOX-depend-
ent TNF-α and IL-1β production that is prevented by
inhibiting NADPH oxidase or by removing hydrogen per-
oxide.
Competing interests
The author(s) declare that they have no competing inter-
ests.
Authors' contributions
AJ carried out all the experiments presented in the paper,
created Figures and wrote Methods and Results. PKM did
many preliminary studies, taught AJ how to prepare glial
cultures as well as other assays used for this study, and
made helpful comments preparing the manuscript. AT
synthesized the Aβ
1–40
peptide. MS synthesized EUK-8
and EUK-134 and helped to write the manuscript provid-
ing useful suggestions. GCB conceived of the study, and
participated in its design and coordination, and wrote
Introduction and Discussion of the manuscript. All the
authors have read and approved the final manuscript.
Acknowledgements
This research was funded by the Alzheimer's Research Trust (UK) and the
European Union (Marie Curie Fellowship).
References
1. Itagaki S, McGeer PL, Akiyama H, Zhu S, Selkoe D: Relationship of
microglia and astrocytes to amyloid deposits of Alzheimer
disease. J Neuroimmunol 1989, 24:173-182.
2. Dickson DW: The pathogenesis of senile plaques. J Neuropathol
Exp Neurol 1997, 56:321-339.
3. Zekry D, Epperson TK, Krause KH: A role for NOX NADPH oxi-
dases in Alzheimer's disease and other types of dementia?
IUBMB Life 2003, 55:307-313.
4. McGeer EG, Yasojima K, Schwab C, McGeer PL: The pentraxins:
possible role in Alzheimer's disease and other innate inflam-
matory diseases. Neurobiol Aging 2001, 22:843-848.
5. McGeer EG, McGeer PL: Inflammatory processes in Alzhe-
imer's disease. Prog Neuropsychopharmacol Biol Psychiatry 2003,
27:741-749.
6. Block ML, Hong JS: Microglia and inflammation-mediated neu-
rodegeneration: multiple triggers with a common mecha-
nism. Prog Neurobiol 2005, 76:77-98.
7. Bal-Price A, Matthias A, Brown GC: Stimulation of the NADPH
oxidase in activated rat microglia removes nitric oxide but
induces peroxynitrite production. J Neurochem 2002, 80:73-80.
8. Mander P, Brown GC: Activation of microglial NADPH oxidase
is synergistic with glial iNOS expression in inducing neuronal
death: a dual-key mechanism of inflammatory neurodegen-
eration. J Neuroinflammation 2005, 2:20.
9. Qin L, Liu Y, Cooper C, Liu B, Wilson B, Hong JS: Microglia
enhance beta-amyloid peptide-induced toxicity in cortical
and mesencephalic neurons by producing reactive oxygen
species. J Neurochem 2002, 83:973-983.
10. Mander PK, Jekabsone A, Brown GC: Microglia proliferation is
regulated by hydrogen peroxide from NADPH oxidase. J
Immunol 2006, 176:1046-1052.
11. Pawate S, Shen Q, Fan F, Bhat NR: Redox regulation of glial
inflammatory response to lipopolysaccharide and inter-
ferongamma. J Neurosci Res 2004, 77:540-551.
12. Qin L, Li G, Qian X, Liu Y, Wu X, Liu B, Hong JS, Block ML: Interac-
tive role of the toll-like receptor 4 and reactive oxygen spe-
cies in LPS-induced microglia activation. Glia 2005, 52:78-84.
13. Bal-Price A, Brown GC: Inflammatory neurodegeneration
mediated by nitric oxide from activated glia-inhibiting neu-
ronal respiration, causing glutamate release and excitotoxic-
ity. J Neurosci 2001, 21:6480-6491.
14. Brown GC, Bal-Price A: Inflammatory neurodegeneration
mediated by nitric oxide, glutamate, and mitochondria. Mol
Neurobiol 2003, 27:325-355.
15. Kinsner A, Pilotto V, Deininger S, Brown GC, Coecke S, Hartung T,
Bal-Price A: Inflammatory neurodegeneration induced by
lipoteichoic acid from Staphylococcus aureus is mediated by
glia activation, nitrosative and oxidative stress, and caspase
activation. J Neurochem 2005, 95:1132-1143.
16. McDonald DR, Brunden KR, Landreth GE: Amyloid fibrils activate
tyrosine kinase-dependent signaling and superoxide produc-
tion in microglia. J Neurosci 1997, 17:2284-2294.
17. Bianca VD, Dusi S, Bianchini E, Dal Pra I, Rossi F: beta-amyloid acti-
vates the O-2 forming NADPH oxidase in microglia, mono-
cytes, and neutrophils. A possible inflammatory mechanism
of neuronal damage in Alzheimer's disease. J Biol Chem 1999,
274:15493-15499.
18. Sharpe MA, Ollosson R, Stewart VC, Clark JB: Oxidation of nitric
oxide by oxomanganese-salen complexes: a new mechanism
A suggested model for Aβ-induced microglial proliferation and activationFigure 10
A suggested model for Aβ-induced microglial proliferation
and activation.
A
E
TNF-D release
PHOX activation
H
2
O
2
Proliferation
TNF-D
production
IL-1E
production
Publish with BioMed Central and every
scientist can read your work free of charge
"BioMed Central will be the most significant development for
disseminating the results of biomedical research in our lifetime."
Sir Paul Nurse, Cancer Research UK
Your research papers will be:
available free of charge to the entire biomedical community
peer reviewed and published immediately upon acceptance
cited in PubMed and archived on PubMed Central
yours — you keep the copyright
Submit your manuscript here:
/>BioMedcentral
Journal of Neuroinflammation 2006, 3:24 />Page 13 of 13
(page number not for citation purposes)
for cellular protection by superoxide dismutase/catalase
mimetics. Biochem J 2002, 366:97-107.
19. Tickler AK, Barrow CJ, Wade JD: Improved preparation of amy-
loid-beta peptides using DBU as Nalpha-Fmoc deprotection
reagent. J Pept Sci 2001, 7:488-494.
20. LeVine H 3rd: Thioflavine T interaction with synthetic Alzhe-
imer's disease beta-amyloid peptides: detection of amyloid
aggregation in solution. Protein Sci 1993, 2:404-410.
21. Pennell NA, Hurley SD, Streit WJ: Lectin staining of sheep micro-
glia. Histochemistry 1994, 102:483-486.
22. Marty S, Dusart I, Peschanski M: Glial changes following an exci-
totoxic lesion in the CNS – I. Microglia/macrophages. Neuro-
science 1991, 45:529-539.
23. Davies MH, Eubanks JP, Powers MR: Microglia and macrophages
are increased in response to ischemia-induced retinopathy in
the mouse retina. Mol Vis 2006, 12:467-477.
24. Morino T, Ogata T, Horiuchi H, Takeba J, Okumura H, Miyazaki T,
Yamamoto H: Delayed neuronal damage related to microglia
proliferation after mild spinal cord compression injury. Neu-
rosci Res 2003, 46:309-318.
25. Bornemann KD, Wiederhold KH, Pauli C, Ermini F, Stalder M, Schnell
L, Sommer B, Jucker M, Staufenbiel M: Abeta-induced inflamma-
tory processes in microglia cells of APP23 transgenic mice.
Am J Pathol 2001, 158:63-73.
26. Geula C, Wu CK, Saroff D, Lorenzo A, Yuan M, Yankner BA: Aging
renders the brain vulnerable to amyloid beta-protein neuro-
toxicity. Nat Med 1998, 4:827-831.
27. Davies KJ: The broad spectrum of responses to oxidants in
proliferating cells: a new paradigm for oxidative stress.
IUBMB Life 1999, 48:41-47.
28. Abid MR, Kachra Z, Spokes KC, Aird WC: NADPH oxidase activ-
ity is required for endothelial cell proliferation and migra-
tion. FEBS Lett 2000, 486:252-256.
29. Heinloth A, Heermeier K, Raff U, Wanner C, Galle J: Stimulation of
NADPH oxidase by oxidized low-density lipoprotein induces
proliferation of human vascular endothelial cells. J Am Soc
Nephrol 2000, 11:1819-1825.
30. Fialkow L, Chan CK, Downey GP: Inhibition of CD45 during neu-
trophil activation. J Immunol 1997, 158:5409-5417.
31. Suh HS, Kim MO, Lee SC: Inhibition of granulocyte-macrophage
colony-stimulating factor signaling and microglial prolifera-
tion by anti-CD45RO: role of Hck tyrosine kinase and phos-
phatidylinositol 3-kinase/Akt. J Immunol 2005, 174:2712-2719.
32. Hecht D, Zick Y: Selective inhibition of protein tyrosine phos-
phatase activities by H2O2 and vanadate in vitro. Biochem Bio-
phys Res Commun 1992, 188:773-779.
33. Lee K, Esselman WJ: Inhibition of PTPs by H(2)O(2) regulates
the activation of distinct MAPK pathways. Free Radic Biol Med
2002, 33:1121-1132.
34. Lawson LJ, Perry VH, Gordon S: Turnover of resident microglia
in the normal adult mouse brain. Neuroscience 1992,
48:405-415.
35. Naslund J, Schierhorn A, Hellman U, Lannfelt L, Roses AD, Tjernberg
LO, Silberring J, Gandy SE, Winblad B, Greengard P, Norstedt C,
Terenius L: Relative abundance of Alzheimer A beta amyloid
peptide variants in Alzheimer disease and normal aging. Proc
Natl Acad Sci USA 1994, 91:8378-8382.
36. Bamberger ME, Harris ME, McDonald DR, Husemann J, Landreth GE:
A cell surface receptor complex for fibrillar beta-amyloid
mediates microglial activation. J Neurosci 2003, 23:2665-2674.