Advanced Topics in Mass Transfer Part 2 pot
Bạn đang xem bản rút gọn của tài liệu. Xem và tải ngay bản đầy đủ của tài liệu tại đây (2.11 MB, 40 trang )
<
> < <<
Controlled Mixing and Transport in Comb-Like
and Random Jet Array Stirring Systems
S. Delbos
1
, E. Chassaing
1
, P. P. Grand
2
,
V. Weitbrecht
3
and T. Bleninger
4
1
Institute for Research and Development of Photovoltaic Energy (IRDEP),
UMR 7174 EDF - CNRS - Chimie-ParisTech
2
Nexcis
3
VA f. Wasserbau/Hydrologie/Glaziologie ETH Zürich
4
Institute for Hydromechanics, Karlsruhe Institute of Technology (KIT)
1,2
France
3
Switzerland
4
Germany
1. Introduction
Electrodeposition of alloys from low concentrated solutions or solutions whose elements
have very different redox potentials is often strongly dependent on mass-transfer rate of
one of the electroactive species. For such alloy systems, electrodeposition is carried out
potentiostatically because the deposition potential has to be controlled in order to monitor
good alloy composition. The applied potential is such that one of the species is deposited at
its diffusion limiting current, and the other is deposited under activation-controlled regime.
The diffusion layer’s thickness controls the limiting current, and its uniformity controls the
uniformity of the deposited film (Bard & Faulkner, 2001).
In electronical engineering, the paddle-cell system has been used for a long time to enhance
mass-transfer rate and homogeneity (Powers & Romankiw, 1972). It can be used for different
electrochemical systems (Datta & Landolt, 2000). The paddle-cell system, where a paddle-like
object is moved back and forth continuously through the solution, has been used for a long
time in electronical engineering to enhance mass transfer rate and homogeneity. It can be used
for different electrochemical systems such as Pb-Sn (Datta & Landolt, 2000) or Fe-Ni (Powers &
Romankiw, 1972). The paddle system is widely used in industry (McHugh et al., 2005; Keigler
et al., 2005), but few studies deal with improving the process conditions in relationship with
mean and local mass transfer.
A comb-like stirring system has been developed at IRDEP. It is similar to the paddle system
and the shear plate system (Wu et al., 2005). The comb can be considered as an improvement
of the paddle system by having several paddles one after another in a comb like arrangement.
The comb is moved back and forth continuously through the solution. It is used for enhancing
the homogeneity of electrodeposited Cu-In-Se layers that are the main component of CIS
thin-film photovoltaic devices (Lincot et al., 2004).
Another system, the jet array, can also be used to plate Ni-Fe (permalloy) static wafers
(Tzanavaras & Cohen, 1995). Hereby no moving parts pass through the solution, but the
3
2 Mass Transfer
solution itself is pumped through small openings causing jet mixing in the system. An
improvement of this system was investigated.
The mixing and transport processes are described for each stirring system. Firstly, the paddle
system characteristics are described based on a literature review. Secondly, the comb system
will be introduced by describing the performed experiments and results, as well as proposing
characteristic non-dimensional numbers for design purposes. Thirdly, the randomly firing jet
array system will by analysed and parametrized based on the experimental results obtained
from (Delbos et al., 2009b;a), which also describe the experimental details of their experiments,
but which will not be repeated here.
2. Paddle-cell system
The paddle-cell, which is quite similar to the comb-like system, is well documented and
can provide insight for comb-like system development. The paddle-cell was first developed
by IBM (Powers & Romankiw, 1972) to provide laminar agitation and to improve mass
transfer during copper electrodeposition. A paddle goes back and forth (reciprocates) above
a horizontal cathode (fig. 1). Experimental data (Schwartz et al., 1987; Rice et al., 1988) and
numerical simulations (Wilson & McHugh, 2005; Mandin et al., 2007) show that geometrical
parameters of the paddle, size and aspect ratio of the cell and paddle shape have a strong
influence on mass-transfer phenomena within the electrochemical cell.
In literature a relationship has been proposed between the diffusion layer thickness and
paddle geometrical parameters. The Sherwood number, which can be defined as the ratio
of the advection lengthscale and the diffusion lengthscale, was shown to be equal to:
Sh
=
Advection lengthscale
Diffusion lengthscale
=
g + h
δ
= αRe
m
Sc
1/3
(1)
where m and α are coefficients that depend on the geometry of the system, Re
= V ·(h + g)/ν,
Sh
=(h + g)/δ, Sc = ν/D. In the case of the paddle-cell, the advection lenghtscale is g + h,
because the size of the eddies is determined by the smallest dimension available to them. The
two other dimensions (heigth of the fluid and dimension of the cell in the direction parallel to
the comb movement) are clearly bigger.
When Sherwood, Reynolds and Schmidt numbers can be linked by such a relationship,
the diffusion layer thickness δ, through the Sherwood number, is totally controlled by the
geometrical parameters of the tank. The value of m depends on turbulence intensity : m
∼ 0.5
denotes laminar flow, m
∼ 0.75 denotes turbulent flow (Bard & Faulkner, 2001; Cussler, 1997;
Fig. 1. Schematic view of a paddle-cell from above
44
Advanced Topics in Mass Transfer
Controlled Mixing and Transport in Comb-Like and Random Jet Array Stirring Systems 3
Tennekes & Lumley, 1972; Brumley & Jirka, 1988). This type of analysis was also used for
other systems, for example the shear flow system (Wu et al., 2005).
Numerical simulations were performed by (Wilson & McHugh, 2005) proposing a
modification of equation 1 by including further characteristical numbers to describe the
physical meaning of the previous used coefficients. In Wilson and McHugh’s paper, three
adimensional numbers have been introduced : the blockage ratio h/H, the proximity ratio
h/g, the Strouhal number f
v
h/u
B
, where f
v
is the vortex shedding frequency and u
B
is the
eddy velocity:
Sh
= 0.566Re
0.583
h
g
0.151
h
H
0.168
St
0.283
Sc
1/3
(2)
The insight provided by these studies was useful for chosing relevant geometric parameters
and designing characteristic non-dimensional parameters.
3. Comb-like system
3.1 Electrochemical reactor
A comb-like system is used for stirring. It is a piece of chemically inert material such as
PP, PTFE or PVDF that has the shape of a comb. It is located in front of the cathode and it
reciprocates in the direction parallel to the cathode, thus creating turbulence near the cathode
(fig. 2). It has the advantages of simplicity and easy maintenance, but the drawback of a
built-in anisotropy: the teeths create vertical patterns on the electrodeposited layer.
A modular tank was built to analyze the influence of the hydrodynamical parameters on a
Cu-Ni electrodeposition process. In this tank local flow velocities have been measured in high
temporal resolution using Laser Doppler Velocimetry (LDV). In addition, electrodeposition of
Cu-Ni alloy films has been carried out on5x5cm
2
glass–Mo substrates.
The experimental tank allowed the study of a wide range of parameter variations (table 1).
Results from studies on the paddle-cell (Schwartz et al., 1987; Rice et al., 1988; Wilson &
McHugh, 2005) suggest that the most important parameters should be the distance between
the comb and the cathode (g, see figure 2), the stirring frequency (f ) and stroke (S, maximum
amplitude of stirring), the width of the comb (h), the shape of the teeth section, and the
dimensions of the cell (L and H). Prior unpublished studies also showed that the mesh of
the comb ( M) could have an influence on the hydrodynamical conditions.
Fig. 2. Schematics of a comb-like system seen from above.
45
Controlled Mixing and Transport in Comb-Like and Random Jet Array Stirring Systems
4 Mass Transfer
Parameter Range
g (mm) 4 – 500
M (mm) 3–16
w (mm) 1–8
h (mm) 1–20
S (mm) ≤ 40
f (Hz) ≤ 7
rectangular
Tooth circular
section triangular
double triangle
H 10 – 500 mm
L 150 – 700 mm
Table 1. Hydrodynamical conditions of the comb-like system.
3.2 Electrodeposition
In order to investigate mass-transport phenomena, an electrochemical model system was
developed in the laboratory (Ollivier et al., 2009). This system, the Cu-Ni system is an
appropriate model: copper deposition is controlled by mass transfer phenomena, while nickel
deposition is controlled by charge-transfer. Its deposition kinetics is a simplification of the
Cu-In-Se codeposition system that is used for synthetizing solar cells in the laboratory, but
easier to handle.
For the preparation of large volumes of Cu-Ni electrolyte (
∼ 40 L), the chemicals (NiSO
4
0.165 M, CuSO
4
0.025 M, Sodium Citrate 0.25 M) were first dissolved in smaller volumes
(2 x 5 L), and immediately diluted into the whole water volume, to prevent the caking (mass
precipitation) of the 40 L-electrolyte.
The electrodeposition takes place on a glass substrate covered with a sputtered Mo layer. The
resistivity of the Mo layer is ρ
ca
=13–17μΩ.cm, its thickness e = 0.38 – 0.52 μm and its sheet
resistance is = 0.27 – 0.44 Ω. This is the usual substrate for thin layer solar cells (Lincot et al.,
2004).
The substrate is placed in an adapted basket that allows the substrate to be carried through
the cleaning process. The substrate is first rinsed with high-purity water (18.2 MΩ), cleaned
with soaped water and thoroughly rinsed with high-purity water. Finally it is dipped for
10 minutes into a NH
3
solution (25 %) to deoxidize the Mo (mainly to remove MoO
2
). The
substrate is afterwards rinsed with flowing water, and dried with argon.
The electrodeposition is performed in potentiostatic mode. The counter-electrode is a vertical
5 x 15 cm
2
Ti mesh covered with IrO
2
(Dimensionally stable Anode, DSA). A saturated
Mercurous Sulfate Electrode (MSE, +0.65 V / Normal Hydrogen Electrode) is used as a
reference electrode. The potentiostat is an Autolab PGSTAT30 controlled by the GPES software
running under MS Windows.
A Pt wire is applied on the substrate to achieve the electrical contact, the substrate is then
rinsed with flowing water, just before being dipped in the electrolyte. The substrate is then
immersed and the potential of
−1.60 V/MSE is applied, and the total charge is −2.8 C/cm
2
The resulting electrodeposited layers are composed of 90 - 99 % of copper and1-10%of
nickel. This composition is the same as in similar experiments performed in a jet firing array
system (Delbos et al., 2009a).
46
Advanced Topics in Mass Transfer
Controlled Mixing and Transport in Comb-Like and Random Jet Array Stirring Systems 5
3.3 Chemical analysis
The thickness and chemical composition of the layers were analysed by Energy-Dispersive
Spectroscopy X-Ray Fluorescence Fischerscope Xray Xan controlled by the WinFTM software
running under Windows. The uncertainty of the measurement was 0.26 % for the thickness,
0.04 % for the copper content, 5.73 % for the nickel content. The local electrodeposited copper
quantity n
Cu
(x, y) (in mol/cm
2
) is linked to the local diffusion layer thickness δ(x,y) by this
relationship:
n
Cu(x,y)
=
i
Cu
(x, y)t
ρ
Cu
z
e
F
=
C
Cu
D
Cu
t
δ(x,y)
(3)
where i
Cu
(x, y) is the local copper partial current density, t is the electrodeposition time, z
e
= 2
is the number of electrons involved in the reaction, F is the Faraday’s constant, ρ
Cu
is the per
volume ratio of Cu, C
Cu
is the concentration of Cu
II
species in the electrolyte, and D
Cu
is the
diffusion coefficient of Cu
II
species.
The copper quantity is therefore locally dependent on the local diffusion layer thickness. In
this set of experiments, mappings of n
Cu(x,y)
were performed: 5 rows of 20 measurements.
Each row (parallel to the x direction) has a resolution of 2.5 mm, and each row is 10.75
mm from its neighbors. The standard deviation of these measurements is therefore a good
indication on the spatial variations of the diffusion layer thickness.
Because of flaking on the edges of the plates, the standard deviation is calculated on the three
central rows of measurements.
3.4 Laser Doppler Velocimetry
Velocity measurements have been performed using a 2-D Laser Doppler Velocimetry (LDV)
system to determine the mean and turbulent flow characteristics. Such a device was already
used to correlate flow velocity with electrodeposition patterns in a jet-firing plating cell
(Delbos et al., 2009a;b). A5WAr-Ion laser, a Dantec data acquisition apparatus (FiberFlow
60*81 BSA 55X) and the BSA Flow software running under MS Windows were used for data
acquisition. ZrO
2
particles were used as seeding particles, and they were approximately 3 μm
in diameter.
A backscatter probe with a focal length of 310 mm was used. The system provides a temporal
resolution of the order of 10
−2
s and the size of the measurement volume is about 0.1 mm x
0.1 mm x 1.6 mm.
The laser probe was located above the measurement volume, firing in the y-direction, and
the laser had to cross the free air-water interface. In order to keep the interface horizontal, a
small piece of glass is kept at the air-water interface above the measurement volume. The lack
of this piece of glass, or the presence of a drop of water on the piece of glass could lead the
acquisition data frequency to decrease by a factor of 100.
Each measurement series lasted 120 - 150 s, leading to approximately 2,000 - 3,000 velocity
signals at each point before moving to another point of measurement. Measurements were
taken on a horizontal line at a distance z
m
= 2 mm away from the deposition electrode and
70 mm from the bottom of the tank (total fluid depth: 120 mm). With the help of a 2-D
traversing system the LDV probe was positioned at the different measurement locations. The
set-up is schematized on figure 3.
u and w, the velocity components on the x- and z-directions were measured. Simple treatment
was applied to the data: for each point of measurement, in both measured velocity directions
(u in the x-direction and w in the z-direction), the mean velocity and the Root Mean Square
47
Controlled Mixing and Transport in Comb-Like and Random Jet Array Stirring Systems
6 Mass Transfer
Fig. 3. Schematics of the LDV measurement set-up in the comb experiment.
(RMS) velocity were calculated, e.g. for w:
w =
1
N
∑
i
w
i
is the mean velocity (4)
w
RMS
=
1
N
∑
i
(w
i
−w)
2
is the RMS velocity (5)
where each w
i
is one measurement in a series of N measurements. In the following, the RMS
velocity is also called the turbulent fluctuations.
The uncertainty of the mean and RMS velocity measurements was determined by measuring
the velocity at the same point 30 times and then calculating the normalized standard deviation
of the measurements (σ
norm
= σ/μ, see section 3.3). The uncertainty of measurement is high
for the w component (σ
w
= 13.2 %), but it is more acceptable for the u component (σ
u
< 5%).
These values are summarized in table 2.
4. Results : control parameters of Cu-Ni electrodeposition in comb-like systems
The objective was to define two control parameters for the comb-like system: one that controls
the limiting deposition current i
L
on the whole cathode, the other that controls the standard
deviation of electrodeposited copper σ
Cu
on a horizontal line (x direction) on the cathode.
Measurement u w u
RMS
w
RMS
σ 4.2 % 13.2 % 4.1 % 7.1 %
Table 2. Uncertainty of LDV measurements in the modular comb electrolyser.
48
Advanced Topics in Mass Transfer
Controlled Mixing and Transport in Comb-Like and Random Jet Array Stirring Systems 7
S (mm) 10 14 24
σ
Cu
13.32 8.87 3.73
Table 3. Stroke – Cu standard deviation.
Therefore, the effect of the variation of geometrical parameters on the limiting current and the
homogeneity of the electrodeposited layer was studied. From these results the two control
parameters were defined.
A set of experiments, previously described in (Delbos, 2008), were performed in order to
quantify the effect of each geometric parameter on copper deposition and flow parameters.
Geometric parameters f , S, M, g, H, and L were tested for relevance (see fig.2). In contrary
to the paddle-cell, the flow is confined between the comb and the cathode, leading to a
characteristic size of flow vortices (eddy size) u
B
∼ g. Consequently the parameters H and
L do not seem to have an influence on flow velocity and electrodeposition pattern. Only f, S,
M, g and teeth shape are found as relevant parameters (Delbos, 2008).
4.1 Effect of the variation of the stroke on electrodeposition and flow
In this section, the effect of the variation of the stroke of the comb is shown. In this set of
experiments all parameters but the stroke remain constant (H
= 66 mm, L = 310 mm, M = 7
mm, h
= 4 mm, g = 7 mm, f = 4 Hz, w = 1 mm, the shape of the teeth was rectangular). The
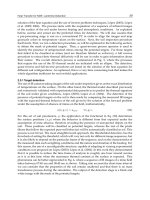
stroke S is varied from 10 mm to 24 mm. Fig. 4 shows the results: (a) presents the copper
quantity measured by XRF along the horizontal axis of the cathode, (b) and (c) present the
mean flow and the turbulent fluctuations measured at z
m
= 2 mm from the cathode on an axis
parallel to the axis were the copper quantity was measured.
The increase of the stroke at constant frequency increases the velocity of the comb, and
therefore the energy input. Consequently the turbulent fluctuations increase with comb stroke
(fig 4(c)), leading to increased mass transfer and increased deposited copper quantity (fig 4(a)).
Increasing the stoke also increases the variations of mean flow (fig 4(b), but apparently the
strong variations of the mean flow do not lead to inhomogeneous diffusion layer thickness:
the copper quantity is more homogeneous for high values of S (table 3 and fig. fig 4(a)).
4.2 Non-dimensional parameters
From the same kind of experiments that are shown in section 4.1 and the literature (Wilson &
McHugh, 2005; Schwartz et al., 1987; Rice et al., 1988), relevant non-dimensional parameters
were chosen to characterize the comb-like system:
– non-dimensional stroke S/M
In this system, each tooth of the comb behaves as a simple paddle, but the vortices shed by
each tooth interact with the vortices shed by the neighboring tooth. The non-dimensional
stroke S/M is therefore of primary importance for mass-transfer phenomena.
– Proximity ratio h/g
For grid stirring devices, the turbulent fluctuations (RMS) decay proportionally to the
inverse of the distance from the stirring device (at the cathode surface, u
RMS
∝ g
−1
)
(Thompson & Turner, 1975). For the comb system, the energy input is proportionnal to
the volume of fluid displaced by the comb, which is proportional to h, and its decay should
be proportional to the distance between comb and cathode g. The proximity ratio (h/g) was
therefore chosen as a relevant parameter for the system.
– Reynolds number
For the paddle cell, Re
=(g + h) fS/ν. The same definition was chosen for the comb system.
49
Controlled Mixing and Transport in Comb-Like and Random Jet Array Stirring Systems
8 Mass Transfer
In our experiments, 100 < Re < 4000. Nevertheless LDV measurements showed that the
flow was turbulent even for low Reynolds numbers (u
RMS
/u ∼2, see fig. 4).
– Solidity ratio M/w
For grid-stirring devices, a solidity ratio can be computed, it is equal to the surface of the
grid divided by the surface of the holes (Thompson & Turner, 1975). Similarly the solidity
ratio of a comb-like system is M/w: the solution volume displaced by the comb depends
on this mesh size over tooth thickness ratio. The larger this ratio, the bigger the volume
displaced by the comb, and the more energy is introduced in the system.
– The Schmidt number Sc
= ν/D
In these experiments, the diffusion coefficient is D
= 3 · 10
−10
m
2
/s and the kinematic
viscosity is ν
= 1.62 ·10
−6
m
2
/s (Henninot, 1999), leading to Sc = 5.4 ·10
3
.
4.3 Deposition current control
In case of diffusion-controlled reactions, the current can be linked to the diffusion layer
thickness through the classical relationship:
J
c
=
nFDC
B
δ
(6)
Fig. 4. Effect of the stroke on copper deposition and flow parameters
50
Advanced Topics in Mass Transfer
Controlled Mixing and Transport in Comb-Like and Random Jet Array Stirring Systems 9
δ is itself linked to the Sherwood number Sh = l
B
/δ, where l
B
is the typical size of the eddies.
For this system, we assumed that l
B
= g because the eddies are confined between the comb
and the cathode, therefore the largest possible size for the eddies is g.
The Sherwood number is linked to the Reynolds and Schmidt numbers (equation 7):
Sh
= αRe
1/2
Sc
1/3
(7)
Sh
=
M
w
1/4
·
Sf
(h + g
ν
1/2
·
ν
D
1/3
(8)
Combining eq. 6 with eq. 8 and taking l
B
= g yields:
J
c
= nFC
B
M
w
1/4
·
[
Sf(h + g)]
1/2
g
· D
2/3
·ν
−1/6
(9)
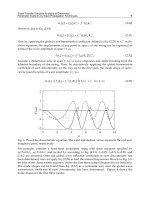
The experimental deposition current is plotted as a function of the geometric deposition
current J
C
in fig. 5. The measured current density is indeed proportional to the geometric
current density. That means that the number L
=(M/w)
1/4
· [Sf(h + g)]
1/2
/g is a geometric
control parameter for the deposition current: for higher values of L, the current density gets
higher.
Fig. 5. Measured deposition current J
measured
is plotted as a function of the geometric
deposition current J
geometric
4.4 Homogeneity control
To define a control parameter for the homogeneity of the electrodeposited layer the standard
deviation of the electrodeposited layer versus each relevant non-dimensional parameter has
been plotted separately. This allowed the design of a control parameter depending on the
non-dimensional stroke, the proximity ratio and a modified Reynolds Number
K
=
S
M
·
g
h
·
fSh
ν
(10)
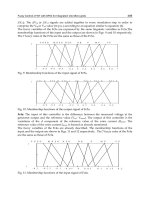
Figure 6 shows the standard deviation of copper in Cu-Ni layers σ
Cu
versus the
non-dimensional parameter K. The variation is monotonous: the standard deviation σ
Cu
51
Controlled Mixing and Transport in Comb-Like and Random Jet Array Stirring Systems
10 Mass Transfer
Fig. 6. σ
Cu
in Cu-Ni electrodepositions vs. non-dimensional control parameter K.
decreases when K increases, meaning that the homogeneity of the electrodeposition increases
when K increases.
The minimum standard deviation of Cu quantity obtained for this comb-like system was 1.07
%on5x5cm
2
. The experimental conditions for this electrodeposition were M = 9 mm, h =
4 mm, w = 1 mm, g = 25 mm, S = 24 mm, f = 5.4 Hz, and the tooth section was rectangular.
This value can be compared to the homogeneity of Fe-Ni layers synthesized in paddle-cell
industrial electrolysers: Andricacos et al. (1994) report that the normalized standard deviation
on circular wafers (diameter 30 cm) can be as low as 1.38 % for the Fe-Ni thickness and 0.86 %
for the Fe content of the Fe-Ni layer. The homogeneity of electrodeposited layers performed
in comb-like reactors are therefore comparable to the ones performed in industrial paddle-cell
electrolysers used for electronic applications.
4.5 Interactions between the two control parameters
The two previously defined two control parameters allow the optimization of Cu-Ni
homogeneity and the deposition current. As the control parameters K and L are made out
of the same geometrical parameter, their relashionship has been studied. Figure 7 shows the
geometrical deposition current J versus the homogeneity control parameter K.
For K
> 5000 corresponding to homogeneous deposition (see figure 6), J can take the
whole range of possible values. That means that it is possible to choose any deposition
current and still perform homogeneous electrodeposition, which is particularly interesting
for industrialization of such processes.
5. Results: control parameters of Cu-Ni electrodeposition in jet systems
5.1 Mixing and transport in randomly firing jet systems
The turbulence-generating device using a randomly firing jet array has been presented in
(Variano et al., 2004; Variano & Cowen, 2008), where an array of jets fires in the same direction
at the same discharge (volume of fluid per unit of time), randomly switched on and off. 1D
jet arrays are typically holed pipes, and 2D jet arrays are typically holed plates. A definition
diagram of a jet array is shown in figure 8. The stirring tank used in this study and related
electrochemical methods are described in (Delbos et al., 2009a;b).
52
Advanced Topics in Mass Transfer
Controlled Mixing and Transport in Comb-Like and Random Jet Array Stirring Systems 11
Fig. 7. Geometric deposition current J
geometric
vs homogeneity control parameter K
Previous studies Delbos et al. (2009b;a); Variano & Cowen (2008) showed that the important
parameters for turbulence control in such systems were mainly the distance between the jets
M, and the cathode z
d
, as well as the momentum source fraction, which is the ratio of time of
firing and time of sleep. However, no relationship between current density and geometrical
parameters of the jet array has been reported yet. Furthermore, no information has been found
related to the spatial variations of δ and its effects on the homogeneity of the electrodeposited
layer in such systems.
The following findings are based on the experimental results obtained from (Delbos et al.,
2009b;a), which also describe the experimental details of their experiments, which will not be
repeated here.
The operating conditions of the jet systems are described in table 4
Fig. 8. Definition diagram of a jet array, showing the single jet discharges and their merging.
53
Controlled Mixing and Transport in Comb-Like and Random Jet Array Stirring Systems