Advances in Optical Amplifiers Part 2 pdf
Bạn đang xem bản rút gọn của tài liệu. Xem và tải ngay bản đầy đủ của tài liệu tại đây (1.3 MB, 30 trang )
∂ f
∂t
=
(
1 − f
)
h
τ
21
−
f
(
1 − h
)
τ
12
−
f
2
τ
1R
−
g
p
L
N
Q
(
2f −1
)
S
p
c
√
ε
r
−
g
s
L
N
Q
(
2f −1
)
S
s
c
√
ε
r
. (40)
Here, S
p
, S
s
are the CW pump and on-off-keying (OOK) modulated signal wave photon
densities, respectively, L is the length of SOA, g
p
, g
s
are the pump and signal wave modal
gains, respectively, f is the electron occupation probability of GS, h is the electron occupation
probability of ES, e is the electron charge, τ
2w
is the electron escape time from the ES to
the WL, τ
wR
is the spontaneous radiative lifetime in WL, τ
1R
is the spontaneous radiative
lifetime in QDs, N
Q
is the surface density of QDs, N
w
is the electron density in the WL, L
w
is the effective thickness of the active layer, τ
21
is the electron relaxation time from the ES to
GS and τ
12
is the electron relaxation time from the GS to the ES, and ε
r
is the SOA material
permittivity. The modal gain g
p,s
(
ω
)
is given by Uskov (2004)
g
p,s
(
ω
)
=
2ΓN
Q
a
dωF
(
ω
)
σ
(
ω
0
)(
2f −1
)
(41)
where the number l of QD layers is assumed to be l
= 1, the confinement factor Γ is assumed
to be the same for both the signal and the pump waves, a is the mean size of QDs, σ
(
ω
0
)
is the cross section of interaction of photons of frequency ω
0
with carriers in QD at the
transition frequency ω including the homogeneous broadening factor, F
(
ω
)
is the distribution
of the transition frequency in the QD ensemble which is assumed to be Gaussian Qasaimeh
(2004), Uskov (2004). It is related to the inhomogeneous broadening and it is described by the
expression Uskov (2004)
F
(
ω
)
=
1
Δω
√
π
exp
−
(
ω −ω
)
2
(
Δω
)
2
(42)
where the parameter Δω is related to the inhomogeneous linewidth γ
in hom
= 2
√
ln 2Δω, and
ω is the average transition frequency.
In order to describe adequately XGM and XPM in QD SOA we should take into account
the interaction of QDs with optical signals. The optical signal propagation in a QD SOA is
described by the following truncated equations for the slowly varying CW and pulse signals
photon densities and phases S
CW ,P
= P
CW ,P
/
¯hω
CW ,P
v
g
CW ,P
A
eff
and θ
CW ,P
Agrawal
(1989).
∂S
CW ,P
(
z, τ
)
∂z
=
(
g
CW ,P
−α
int
)
S
CW ,P
(
z, τ
)
(43)
∂θ
CW ,P
∂z
= −
α
2
g
CW ,P
(44)
Here P
CW ,P
are the CW and pulse signal optical powers, respectively, A
eff
is the QD
SOA effective cross-section, ω
CW ,P
,
v
g
CW ,P
are the CW and pulse signal group angular
frequencies and velocities, respectively, g
CW ,P
are the active medium (SOA) gains at the
corresponding optical frequencies, and α
int
is the absorption coefficient of the SOA material.
For the pulse propagation analysis, we replace the variables
(
z, t
)
with the retarded frame
variables
z, τ
= t ∓z/v
g
. For optical pulses with a duration T
10ps the optical radiation
15
Semiconductor Optical Amplifiers
of the pulse fills the entire active region of a QD SOA of length L 1mm and the propagation
effects can be neglected Gehrig (2002). Hence, in our case the photon densities
S
CW ,P
(
z, τ
)
=
(
S
CW ,P
(
τ
))
in
exp
⎡
⎣
z
0
(
g
CW ,P
−α
int
)
dz
⎤
⎦
(45)
can be averaged over the QD SOA length L which yields
S
CW ,P
(
τ
)
=
1
L
(
S
CW ,P
(
τ
))
in
L
0
dz exp
⎡
⎣
z
0
(
g
CW ,P
−α
int
)
dz
⎤
⎦
(46)
Solution of equation (44) yields for the phases which should be inserted into MZI equation
(53)
θ
CW ,P
(
τ
)
= −
(
α/2
)
L
0
dzg
CW ,P
. (47)
The time-dependent variations of the carrier distributions in the QDs and WL result in strong
phase changes (44) during the light propagation in the QD SOA Gehrig (2002). System of
equations (38)-(40) with the average pump and signal photon densities (46) and phases (47)
constitutes a complete set of equations describing XGM and XPM in QD SOA related by the
LEF α as it is seen from equations (43), (44) and (47). The possibility of XGM in QD SOAs
due to the connections between different QDs through WL at detunings between a signal
and a pumping larger than the homogeneous broadening has been thoroughly investigated
theoretically Ben Ezra (2007).
The advantages of QD SOAs as compared to bulk SOAs are the ultrafast gain recovery of
about a few picoseconds, broadband gain, low NF, high saturation output power and high
FWM efficiency Akiyama (2007). For instance, distortion free output power of 23dBm has
been realized which is the highest among all the SOAs Akiyama (2007). A gain of
> 25dB,
NF of
< 5dB and output saturation power of > 20dBm can be obtained simultaneously in the
wavelength range of 90nm Akiyama (2007).
4. Recent advances in SOA applications
4.1 All-optical pulse generation
Ultra wideband (UWB) communication is a fast emerging technology that offers new
opportunities such as high data rates, low equipment cost, low power, precise positioning
capability and extremely low signal interference. A contiguous bandwidth of 7.5GHz is
available in the frequency interval of
(
3.1 −10.6
)
GHz at an extremely low maximum power
output of
−41.3dBm/MHz limited by the regulations of Federal Communication Commission
(FCC) Ghawami (2005). Impulse radio (IR) UWB communication technique is a carrier
free modulation using very narrow radio frequency (RF) pulses generated by UWB pulse
generators Yao (2007). However, high data rate UWB systems are limited to distances less than
10m due the constraints on allowed emission levels Yao (2007), Ran (2009). In order to increase
IR UWB transmission distances, a new concept based on UWB technologies and the optical
fiber technology has been proposed that is called UWB radio over optical fibre (UROOF) Ran
(2009). The IR UWB signals of several GHz are superimposed on the optical continuous wave
(CW) carrier and transmitted transparently over an optical fiber Ran (2009), Yao (2007). The
16
Advances in Optical Amplifiers
UROOF technology permits to avoid the high cost additional electronic components required
for signal processing and enables the integration of all RF and optical transmitter/receiver
components on a single chip.
In order to distribute UWB signals via optical fibers, it is desirable to generate these signals
directly in the optical domain. The advantages of the all-optical methods are following:
decreasing of interference between electrical devices, low loss and light weight of optical fibers
Lin (2005), Yao (2007), Wang (2006).
Typically, Gaussian waveforms are used in UWB communications due to their simplicity,
achievability, and almost uniform distribution over their frequency spectrum Yao (2007),
Ghawami (2005). The basic Gaussian pulse y
g1
, a Gaussian monocycle y
g2
and a Gaussian
doublet y
g3
are given by Ghawami (2005).
y
g1
= K
1
exp
−
t
2
τ
2
; (48)
y
g2
= K
2
−
2t
τ
2
exp
−
t
2
τ
2
; y
g3
= K
3
−
2
τ
2
1
−
2t
2
τ
2
exp
−
t
2
τ
2
(49)
where τ is the time-scaling factor, and K
1,2,3
are the normalization constants:
K
1
=
E
1
τ
√
π/2
; K
2
=
τE
2
√
π/2
; K
3
= τ
τE
3
3
√
π/2
(50)
There exist three main optical IR UWB generation techniques Yao (2007)
1. UWB pulse generation based on phase-modulation-to-intensity-modulation (PM-IM)
conversion.
2. UWB pulse generation based on a photonic microwave delay line using SOA.
3. UWB pulse generation based on optical spectral shaping and dispersion-induced
frequency-to-time mapping. All-optical methods of UWB pulse generation are based on
nonlinear optical processes in SOA such as XPM and XGM.
We concentrate on the all-optical methods of UWB pulse generation based on XPM and
XGM in SOA. Consider first the method based on XPM. A probe CW signal generated by
CW laser diode and a light wave modulated by the Mach-Zehnder modulator (MZM) are
simultaneously fed into SOA, the probe signal will undergo both XGM and XPM, and the
phase Φ
c
of the output signal varies approximately proportionally to Gaussian pulse train
power P
s
(
t
)
Dong (2009)
Φ
c
= KP
s
(
t
)
+
Φ
0
(51)
where K is the proportionality constant and Φ
0
is the initial phase. The chirp Δν
c
(
t
)
of the
probe signal is the first order derivative of the phase given by Dong (2009)
Δν
c
(
t
)
= −
1
2π
dΦ
c
dt
= −
K
2π
dP
s
(
t
)
dt
(52)
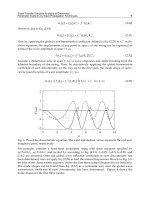
The chirp (52) is a monocycle, according to definition (49). Its value may be positive
or negative. UWB doublet pulses can be obtained by combining positive and negative
monocycles with a proper delay Dong (2009). The shortages of the proposed method are the
necessity for complicated electronic circuit for generation short electric Gaussian pulses, the
17
Semiconductor Optical Amplifiers
use of an electro-optic phase modulator (EOM), the need for a comparatively long singlemode
fiber (SMF), and a comparatively low operation rate and high bias currents of bulk SOAs.
Recently, the theory of a novel all-optical method of the IR UWB pulse generation has
been proposed Ben Ezra (2008). QD SOA can be inserted into one arm of an integrated
Mach-Zehnder interferometer (MZI) which results in an intensity dependent optical signal
interference at the output of MZI Ben Ezra (2008). The IR UWB pulse generation process
is based both on XPM and XGM in QD SOA characterized by an extremely high optical
nonlinearity, low bias current, and high operation rate Sugawara (2004). Unlike other
proposed all-optical methods, we need no optical fibers, FBG and EOM substantially reducing
the cost and complexity of the IR UWB generator. The IR UWB signals generated by the
proposed QD SOA based MZI structure have the form of the Gaussian doublet. The shape of
the signal and its spectrum can be tailor-made for different applications by changing the QD
SOA bias current and optical power. The diagram of the MZI with QD SOA is shown in Fig.
3.
Fig. 3. MZI with QD SOA in the upper arm
The pulsed laser produces a train of short Gaussian pulses counter-propagating with respect
to the input CW optical signal. The CW signal propagating through the upper arm of MZI
transforms into the Gaussian pulse at the output of the MZI due to XPM and XGM with the
train of Gaussian pulses. The optical signal in the linear lower arm of MZI remains CW, and
the phase shift φ
2
= const in the lower arm of MZI is constant. Both these pulses interfere
at the output of MZI, and the output pulse shape is defined by the power dependent phase
difference Δφ
(
t
)
=
φ
1
(
t
)
−
φ
2
(
t
)
where φ
1,2
(
t
)
are the phase shifts in the upper and lower
arms of MZI, respectively. The MZI output optical power P
out
is given by Wang (2004).
P
out
=
P
0
4
G
1
(
t
)
+
G
2
(
t
)
−
2
G
1
(
t
)
G
2
(
t
)
cos Δφ
(
t
)
(53)
where G
1,2
(
t
)
=
exp
(
g
1,2
L
1,2
)
, g
1,2
, L
1,2
are the amplification factors of the upper and
lower arms of MZI, the time-dependent gain, the SOA gain, and the active medium length,
respectively. The relation between the MZI phase shift and its amplification factor is given
by Δφ
(
t
)
= −
(
α
L
/2
)
ln G
1
(
t
)
. The shape of the output pulse is determined by the time
dependence of G
1
(
t
)
both directly and through Δφ
(
t
)
according to equation (53) resulting in
a Gaussian doublet under certain conditions determined by the QD SOA dynamics.
18
Advances in Optical Amplifiers
4.2 All-optical signal processing
Recently, theoretical model of an ultra-fast all-optical signal processor based on the QD
SOA-MZI where XOR operation, WC, and 3R signal regeneration can be simultaneously
carried out by AO-XOR logic gates for bit rates up to
(
100 −200
)
Gb/s depending on the
value of the bias current I
∼
(
30 −50
)
mA has been proposed. Ben Ezra (2009). The structure
of the proposed processor is shown in Fig. 4.
Fig. 4. The structure of the ultra-fast all-optical signal processor based on QD SOA-MZI
The theoretical analysis of the proposed ultra-fast QD SOA-MZI processor is based on
combination of the MZI model with the QD-SOA nonlinear characteristics and the dynamics.
At the output of MZI, the CW optical signals from the two QD SOAs interfere giving the
output intensity are determined by equation (53) with the CW or the clock stream optical
signal power P
in
instead of P
0
Sun (2005), Wang (2004). When the control signals A and/or
B are fed into the two SOAs they modulate the gain of the SOAs and give rise to the phase
modulation of the co-propagating CW signal due to LEF α
L
Agrawal (2001), Agrawal (2002),
Newell (1999). LEF values may vary in a large interval from the experimentally measured
value of LEF α
L
= 0.1 in InAs QD lasers near the gain saturation regime Newell (1999) up to
the giant values of LEF as high as α
L
= 60 measured in InAs/InGaAs QD lasers Dagens (2005).
However, such limiting cases can be achieved for specific electronic band structure Newell
(1999), Dagens (2005), Sun (2004). The typical values of LEF in QD lasers are α
L
≈
(
2 −7
)
Sun
(2005). Detailed measurements of the LEF dependence on injection current, photon energy,
and temperature in QD SOAs have also been carried out Schneider (2004). For low-injection
currents, the LEF of the dot GS transition is between 0.4 and 1 increasing up to about 10 with
the increase of the carrier density at room temperature Schneider (2004). The phase shift at
the QD SOA-MZI output is given by Wang (2004)
φ
1
(
t
)
−
φ
2
(
t
)
= −
α
L
2
ln
G
1
(
t
)
G
2
(
t
)
(54)
It is seen from equation (54) that the phase shift φ
1
(
t
)
−
φ
2
(
t
)
is determined by both LEF and
the gain. For the typical values of LEF α
L
≈
(
2 −7
)
, gain g
1,2
= 11.5cm
−1
, L
1,2
= 1500μm the
phase shift of about π is feasible.
19
Semiconductor Optical Amplifiers
4.3 All-optical logics
Consider an AO-XOR gate based on integrated SOA-MZI which consists of a symmetrical MZI
where one QD SOA is located in each arm of the interferometer Sun (2005). Two optical control
beams A and B at the same wavelength λ are inserted into ports A and B of MZI separately.
A third signal, which represents a clock stream of continuous series of unit pulses is split into
two equal parts and injected into the two SOAs. The detuning Δω between the signals A, B
and the third signal should be less than the homogeneous broadening of QDs spectrum. In
such a case the ultrafast operation occurs. In the opposite case of a sufficiently large detuning
comparable with the inhomogeneous broadening, XGM in a QD SOA is also possible due to
the interaction of QDs groups with essentially different resonance frequencies through WL for
optical pulse bit rates up to 10Gb/s Ben Ezra (September 2005). When A
= B = 0, the signal
at port C traveling through the two arms of the SOA acquires a phase difference of π when
it recombines at the output port D, and the output is ”0” due to the destructive interference.
When A
= 1, B = 0, the signal traveling through the arm with signal A acquires a phase
change due to XPM between the pulse train A and the signal. The signal traveling through
the lower arm does not have this additional phase change which results in an output ”1” Sun
(2005). The same result occurs when A
= 0, B = 1 Sun (2005). When A = 1 and B = 1the
phase changes for the signal traveling through both arms are equal, and the output is ”0”.
4.4 Wavelength conversion
An ideal wavelength convertor (WC) should have the following properties: transparency to
bit rates and signal formats, fast setup time of output wavelength, conversion to both shorter
and longer wavelengths, moderate input power levels, possibility for no conversion regime,
insensitivity to input signal polarization, low-chirp output signal with high extinction ratio
and large signal-to-noise ratio (SNR), and simple implementation Ramamurthy (2001). Most
of these requirements can be met by using SOA. The XGM method using SOAs is especially
attractive due to its simple realization scheme for WC Agrawal (2001). However, the main
disadvantages of this method are substantial phase distortions due to frequency chirping,
degradation due to spontaneous emission, and a relatively low extinction ratio Agrawal
(2001). These parameters may be improved by using QD-SOAs instead of bulk SOAs due
to pattern-effect-free high-speed WC of optical signals by XGM, a low threshold current
density, a high material gain, high saturation power, broad gain bandwidth, and a weak
temperature dependence as compared to bulk and MQW devices Ustinov (2003). We combine
the advantages of QD-SOAs as a nonlinear component and MZI as a system whose output
signal can be easily controlled. In the situation where one of the propagating signals A or B is
absent, the CW signal with the desired output wavelength is split asymmetrically to each arm
of MZI and interferes at the output either constructively or destructively with the intensity
modulated input signal at another wavelength. The state of interference depends on the
relative phase difference between the two MZI arms which is determined by the SOAs. In such
a case the QD SOA-MZI operates as an amplifier of the remaining propagating signal. Then,
the operation with the output ”1” may be characterized as a kind of WC due to XGM between
the input signal A or B and the clock stream signal. The possibility of the pattern-effect-free
WC by XGM in QD SOAs has been demonstrated experimentally at the wavelength of 1.3μm
Sugawara (2004).
20
Advances in Optical Amplifiers
4.5 3R regeneration
Short optical pulses propagating in optical fibers are distorted due to the fiber losses
caused by material absorption, Rayleigh scattering, fiber bending, and broadening caused
by the material dispersion, waveguide dispersion, polarization-mode dispersion, intermodal
dispersion Agrawal (2001), Agrawal (2002). 3R regeneration is essential for successful logic
operations because of the ultra-fast data signal distortions. 3R regeneration requires an optical
clock and a suitable architecture of the regenerator in order to perform a clocked decision
function Sartorius (2001). In such a case, the shape of the regenerated pulses is defined by the
shape of the clock pulses Sartorius (2001).
The proposed QD SOA-MZI ultra-fast all-optical processor can successfully solve three
problems of 3R regeneration. Indeed, the efficient pattern–effect free optical signal
re-amplification may be carried out in each arm by QD-SOAs. WC based on an all-optical
logic gate provides the re-shaping since noise cannot close the gate, and only the data signals
have enough power to close the gate Sartorius (2001). The re-timing in QD-SOA-MZI based
processor is provided by the optical clock which is also essential for the re-shaping Sartorius
(2001). Hence, if the CW signal is replaced with the clock stream, the 3R regeneration can
be carried out simultaneously with logic operations. The analysis shows that for strongly
distorted data signals a separate processor is needed providing 3R regeneration before the
data signal input to the logic gate.
4.6 Slow light propagation in SOA
One of the challenges of the optoelectronic technology is the ability to store an optical signal
in optical format. Such an ability can significantly improve the routing process by reducing
the routing delay, introducing data transparency for secure communications, and reducing
the power and size of electronic routers Chang-Hasnain (2006). A controllable optical delay
line can function as an optical buffer where the storage is proportional to variability of the
light group velocity v
g
defined as Chang-Hasnain (2006)
v
g
=
∂ω
∂k
=
c − ω
∂n
(
ω,k
)
∂ω
n
(
ω,k
)
+
ω
∂n
(
ω,k
)
∂k
(55)
Here n
(
ω,k
)
is the real part of the refractive index, and k is waveguide (WG) propagation
constant. The signal velocity can be identified as the light group velocity v
g
for the signals
used in the optical communications where the signal bandwidth
(
1 −100
)
GHz is much
less compared to the carrier frequency of about 193GHz Chang-Hasnain (2006). It is seen
from equation (55) that the group velocity v
g
can be essentially reduced for a large positive
WG dispersion ∂n/∂k and/or material dispersion ∂n/∂ω Chang-Hasnain (2006). Such a
phenomenon is called a slow light (SL) propagation Chang-Hasnain (2006), Dúill (2009), Chen
(2008). The WG dispersion can be realized by using gratings, periodic resonant cavities,
or photonic crystals Chang-Hasnain (2006). The material dispersion can be achieved by
gain or absorption spectral change. For instance, an absorption dip leads to a variation
of the refractive index spectrum with a positive slope in the same frequency range, due to
the Kramers-Kronig dispersion relation, which results in the SL propagation Chang-Hasnain
(2006). The slowdown factor S is given by Chang-Hasnain (2006).
S
=
c
v
g
=
n
(
ω,k
)
+
ω
c
∂n
(
ω,k
)
∂k
1 −
ω
c
∂n
(
ω,k
)
∂ω
(56)
21
Semiconductor Optical Amplifiers
Large material dispersion necessary for SL phenomenon can be obtained by using different
nonlinear optical effects such as electromagnetically induced transparency, FWM, stimulated
Brillouin scattering, stimulated Raman scattering, coherent population oscillations (CPO)
Chang-Hasnain (2006), Dúill (2009), Chen (2008). A sinusoidally modulated pump
propagating in a SOA induces XGM, XPM and FWM which results in amplitude and phase
changes. The sinusoidal envelope of the detected total field at SOA output exhibits a nonlinear
phase change that defines the slowdown factor S controllable via the SOA gain Dúill (2009).
It has been experimentally demonstrated that light velocity control by CPO can be realized in
bulk, QW and QD SOAs Chen (2008). The nanosecond radiative lifetime in SOAs corresponds
to a GHz bandwidth and is suitable for practical applications Chang-Hasnain (2006).
QW SOA is modelled as a two-level system. In such a system, a pump laser and a probe
laser of frequencies ν
p
nd ν
s
, respectively create coherent beating of carriers changing the
absorption and refractive index spectra Chang-Hasnain (2006). The sharp absorption dip
caused by CPO induced by the pump and probe was centered at zero detuning. For the
pump and probe intensities of 1 and 0.09kW/cm
2
, respectively, a slowdown factor S = 31200
and a group velocity v
g
= 9600m/s at zero detuning have been demonstrated Chang-Hasnain
(2006).
QD SOAs characterized by discrete electronic levels, efficient confinement of electrons and
holes, and temperature stability have been used for room temperature observation of CPO
based SL Chang-Hasnain (2006). SL effects have been observed in QD SOA under reverse bias,
or under a small forward bias current below the transparency level behaving as an absorptive
WG Chang-Hasnain (2006).
5. Conclusions
We reviewed the structure, operation principles, dynamics and performance characteristics
of bulk, QW and QD SOAs. The latest experimental and theoretical results concerning the
SOAs applications in modern communication systems clearly show that SOAs in general
and especially QW and QD SOAs are the most promising candidates for all-optical pulse
generation, WC, all-optical logics, and even SL generation. These applications are due to
SOA’s extremely high nonlinearity which results in efficient XGM, XPM and FWM processes.
In particular, QD SOAs are characterized by extremely low bias currents, low power level,
tunable radiation wavelength, temperature stability and compatibility with the integrated Si
photonics systems.
6. References
Agrawal, G.P. & Olsson, N.A. (1989). Self-phase modulation and spectral broadening of optical
pulses in semiconductor laser amplifiers. IEEE Journal of Quantum Electronics, Vol. 25,
No.11, (November 1989) 2297-2306, ISSN 0018-9197
Agrawal, G.P. (2001). Applications of Nonlinear Fiber Optics. Academic Press, ISBN
0-12-045144-1, New York
Agrawal, G.P. (2002). Fiber-Optic Communication Systems. Wiley, ISBN 0-471-21571-6, New York
Akiyama, T., Sugawara, M. & Arakawa, Y. (2007). Quantum-Dot semicondyctor optical
amplifiers. Proceedings of the IEEE, Vol. 95, No. 9 (September 2007) 1757-1766, ISSN
0018-9219
Bányai, L. & Koch, S. W. (2005). Semiconductor Quantum Dots (Second Edition). World
Scientific, ISBN 9810213905, London,
22
Advances in Optical Amplifiers
Ben-Ezra, Y.; Haridim, M. & Lembrikov, B. I. (2005). Theoretical analysis of gain-recovery time
and chirp in QD-SOA. IEEE Photonics Technology Letters, Vol. 17, No. 9, (September
2005) 1803-1805, ISSN 1041-1135
Ben-Ezra, Y.; Lembrikov, B. I. & Haridim, M. (2005). Acceleration of gain recovery and
dynamics of electrons in QD-SOA. IEEE Journal of Quantum Electronics, Vol. 41, No.
10, (October 2005) 1268-1273, ISSN 0018-9197
Ben-Ezra, Y.; Lembrikov, B. I. & Haridim, M. (2007). Specific features of XGM in QD-SOA. IEEE
Journal of Quantum Electronics, Vol.43, No. 8, (August 2007) 730-737, ISSN 0018-9197
Ben Ezra, Y.; Haridim, M.; Lembrikov, B.I. & Ran, M. (2008). Proposal for
All-optical Generation of Ultra Wideband Impulse Radio Signals in Mach-Zehnder
Interferometer with Quantum Dot Optical Amplifier. IEEE Photonics Technology
Letters, Vol. 20, No. 7 (April 2008) 484-486, ISSN 1041-1135
Ben Ezra, Y.; Lembrikov, B.I. & Haridim, M. (2009). Ultra-Fast All-Optical Processor Based on
Quantum Dot Semiconductor Optical Amplifiers (QD-SOA). IEEE Journal of Quantum
Electronics, Vol. 45, No.1 (January 2009) 34-41, ISSN 0018-9197
Berg, T.W.; Bischoff, S.; Magnusdottir, I. & Mørk, J. (2001). Ultrafast gain recovery and
modulation limitations in self-assembled quantum-dot devices. IEEE Photonics
Technology Letters, Vol. 13, No. 6 (June 2001) 541-543, ISSN 1041-1135
Berg, T.W.; Mørk, J. & Hvam, J.M. (2004). Gain dynamics and saturation in semiconductor
quantum dot amplifiers. New Journal of Physics, Vol. 6, No. 178, (2004) 1-23, ISSN
1367-2630
Berg, T.W. & Mørk, J. (2004). Saturation and Noise Properties of Quantum-Dot Optical
Amplifiers. IEEE J. of Quantum Electronics, Vol. 40, No. 11, (November 2004)
1527-1539, ISSN 0018-9197
Bimberg, D.; Grundmann, M. & Ledentsov, N. N. (1999). Quantum Dot Heterostructures. John
Wiley, ISBN 047 1973882, New York
Brennan, K.F. (1999). The Physics of Semiconductors with applications to optoelectronic devices.
Cambridge University Press, ISBN 0 521 59662 9, New York
Chang, W.S.C. (2005). Principles of Lasers and Optics. Cambridge University Press, ISBN
0-511-08061-1, Cambridge
Chang-Hasnain, C.J. & Chuang, S.L. (2006). Slow and fast light in semiconductor
quantum-well and quantum-dot devices. Journal of Lightwave Technology, Vol. 24, No.
12, (December 2006) 4642-4654, ISSN 0733-8724
Chen, H.; Zhu, G.; Wang, Q.; Jaques, J.; Leuthold, J.; Picirilli, A.B. & Dutta, N.K. (2002).
All-optical logic XOR using differential scheme and Mach-Zender interferometer.
Electronic Letters, Vol. 38, No. 21, (October 2002) 1271-1273, ISSN 0013-5194
Chen, Y., Xue, W., Öhman, F. & Mørk, J. (2008). Theory of optical-filtering enhanced slow and
fast light effects in semiconductor optical waveguides. Journal of Lightwave Technology,
Vol. 26, No. 23, (December 2008) 3734-3743, ISSN 0733-8724
Dagens, B.; Markus, A.; Chen, J.X.; Provost, J G.; Make, D.; de Gouezigou, O.; Landreau,
J.; Fiore, A. & Thedrez, B. (2005). Giant linewidth enhancement factor and purely
frequency modulated emission from quantum dot laser. Electronics Letters, Vol. 41,
No. 6, (17th March 2005) 323-324, ISSN 0013-5194
Dong, J.; Zhang, X.; Fu, S.; Xu, J.; Shum, P. & Huang, D. (2008) Ultrafast all-optical signal
processing based on single semiconductor optical amplifier. IEEE Journal of Selected
Topics in Quantum Electronics, Vol. 14, No. 3 (May/June 2008) 770-778, ISSN 1077-260X
23
Semiconductor Optical Amplifiers
Dong, J.; Zhang, X. & Huang (2009). All-optical ultra-wideband pulse generation based on
semiconductor optical amplifiers. Frontiers of Optoelectronics in China, Vol. 2, No.1,
(March 2009) 40-49, ISSN 1674-4128
Dúill, Seán Ó; O’Dowd, R. F. & Eisenstein, G. (2009) On the role of high-order coherent
population oscillations in slow and fast light propagation using semiconductor
optical amplifiers. IEEE Journal of Selected Topics in Quantum Electronics, Vol. 15, No. 3
(May/June 2009) 578-584, ISSN 1077-260X
Eisenstein, G. (1989). Semiconductor optical amplifiers. IEEE Circuits and Devices Magazine,
Vol. 5, No. 4 (July 1989) 25-30, ISSN 8755-3996
Freude, W. & al. (2010). Linear and nonlinear semiconductor optical amplifiers. Proceedings of
12th International Conference on Transparent Optical Networks (ICTON 2010), We.D4.1,
1-4, ISBN 978-1-4244-7799-9, Munich, Germany June 27-July 1, 2010 IEEE
Ghavami, M.; Michael, L.B. & Kohno, R. (2005). Ultra Wideband Signals and Systems in
Communication Engineering, Wiley, ISBN-10 0-470-86571-5(H/B), Chichester, England
Gehrig, E. & O. Hess, O. (2002). Mesoscopic spatiotemporal theory for quantum-dot lasers.
Phys. Rev. A, Vol. 65, No. 3, (March 2002) 033804-1-16, ISSN 1050-2947
Hamié, A.; Sharaiha, A.; Guégan, M. & Pucel, B. (2002). All-Optical logic NOR Gate Using
Two-Cascaded Semiconductor Optical Amplifiers. IEEE Photonics Technology Letters,
Vol. 14, No. 10, (October 2002) 1439-1441, ISSN 1041-1135
Joergensen, C. ; Danielsen, S.L.; Durhuus, T.; Mikkelsen, B. ; Stubkjaer, K.E.; Vodjdani,
N.; Ratovelomanana, F.; Enard, A.; Glastre, G.; Rondi, D. & Blondeau, R.
(1996). Wavelength conversion by optimized monolithic integrated Mach-Zender
interferometer, IEEE Photonics Technology Letters, Vol. 8, No. 4, (April 1996) 521-523,
ISSN 1041-1135
Kanellos, G.T.; Petrantonakis, D.; Tsiokos, D.; Bakopoulos, P.; Zakynthinos, P.; Pleros, N.;
Apostolopoulos, D.; Maxwell, G.; Poustie, A. & Avramopoulos, H. (2007). All-optical
3R burst-mode reception at 40 Gb/s using four integrated MZI switches. Journal of
Lightwave Technology, Vol. 25, No. 1, (January 2007) 184-192, ISSN 0733-8724
Kim, J.; Laemmlin, M.; Meuer, C.; Bimberg, D. & Eisenstein, G. (2009). Theoretical
and experimental study of high-speed small-signal cross-gain modulation of
quantum-dot semiconductor optical amplifiers. IEEE J. of Quantum Electronics, Vol.
45, No. 3, (March 2009) 240-248, ISSN 0018-9197
Leem, Y.A.; Kim, D. C.; Sim, E.; Kim, S B.; Ko, H.; Park, K.H.; Yee, D S.; Oh, J. O.; Lee,
S. H. & Jeon, M. Y. (2006). The characterization of all-optical 3R regeneration based
on InP-related semiconductor optical devices, IEEE J. of selected topics in Quantum
Electronics, Vol. 12, No. 4, (July/August 2006) 726-735, ISSN 1077-260X
Lin, W P. & Chen, J Y. (2005). Implementation of a new ultrawide-band impulse system,
IEEE Photonics Technology Letters, Vol. 17, No. 11, (November 2005) 2418-2420, ISSN
1041-1135
Matthews, D.K. ; Summers, H.D.; Smowton, P.M.; Blood, P.; Rees, P. & Hopkinson, M. (2005).
Dynamics of the wetting-layer-quantum-dot interaction in GaAs self-assembled
systems, IEEE Journal of Quantum Electronics, Vol. 41, No. 3, (March 2005), 344-350,
ISSN 0018-9197
Mukherjee, B. & Zang, H. (2001). Introduction. Survey of State-of-the-Art, In: Optical WDM
Networks. Principles and Practice, Sivalingam, K.M. & Subramaniam, S. (Ed.), 3-24,
Kluwer, ISBN 0-7923-7825-3, Boston
24
Advances in Optical Amplifiers
Newell, T.C.; Bossert, D.J.; Stinz, A.; Fuchs, A. & Malloy, K.J. (1999). Gain and linewidth
enhancement factor in InAs quantum-dot laser diodes, IEEE Photonics Technology
Letters, Vol. 11, (November 1999), 1527-1529, ISSN 1041-1135
Ohtsu, N.; Kobayashi, K.; Kawazoe, T.; Yatsui, T. & Naruse, N. (2008). Principles of
Nanophotonics, CRC Press, ISBN-13 978-1-58488-972-4, London
Premaratne, M., Neši´c, D. & Agrawal, G.P. (2008) Pulse amplification and gain recovery
in semiconductor optical amplifiers: a systematic analytical approach. Journal of
Lightwave Technology, Vol. 26, No. 12, (June 2008) 1653-1660, ISSN 0733-8724
Qasaimeh, O. (2003). Optical gain and saturation characteristics quantum-dot semiconductor
optical amplifiers. IEEE J. of Quantum Electronics, Vol. 39, No. 6, (June 2003) 793-798,
ISSN 0018-9197
Qasaimeh, O. (2004). Characteristics of cross-gain (XG) wavelength conversion in quantum
dot semiconductor optical amplifiers. IEEE Photonics Technology Letters, Vol. 16, No.
2, (February 2004) 542-544, ISSN 1041-1135
Ramamurthy, B. (2001). Swithches, wavelength routers, and wavelength converters. In:
Optical WDM Networks. Principles and Practice, Sivalingam, K.M. & Subramaniam,
S. (Ed.), 51-75, Kluwer, ISBN 0-7923-7825-3, Boston
Ran, M; Ben Ezra, Y. & Lembrikov B.I. (2009). Ultra-wideband Radio-over-optical-fibre
Technologies, In Short-Range Wireless Communications, Kraemer, R. & Katz, M. D.
(Eds.), 271-327, Wiley, ISBN 978-0-470-69995-9 (H/B), Chichester, England
Reale, A., Di Carlo, A. & Lugli, P. (2001). Gain dynamics in traveling-wave semiconductor
optical amplifiers. IEEE Journal of Selected Topics in Quantum Electronics, Vol. 7, No. 2
(March/April 2001) 293-299, ISSN 1077-260X
Sakamoto, A. & Sugawara, M. (2000). Theoretical calculation of lasing spectra of quantum-dot
lasers: effect of homogeneous broadening of optical gain, IEEE Photonics Technology
Letters, Vol. 12, No. 2, (February 2000) 107-109, ISSN 1041-1135
Sartorius, B. (2001). 3R regeneration for all-optical networks, Proceedings of 3rd International
Conference on Transparent Optical Networks (ICTON 2001), Th. A.4, pp. 333-337, ISBN
10 0780370961, Krakow, Poland, June 18-21, IEEE, Krakow
Schneider, S.; Borri, P.; Langbein, W.; Woggon, U.; Sellin, R.L.; Ouyang, D. & Bimberg, D.
(2004). Linewidth enhancement factor in InGaAs quantum-dot amplifiers, IEEE of
Quantum Electronics, Vol. 40, No. 10, (October 2004) 1423-1429, ISSN 0018-9197
Spiekman, L. (2009). Economics and markets of semiconductor optical amplifiers, Proceedings
of 11th International Conference on Transparent Optical Networks (ICTON 2009), Mo.B4.1,
1, ISBN 978-1-4244-4826-5, S. Miguel, Azores, Portugal, June 28-July 2, 2009 IEEE
Sugawara, M.; T. Akiyama, T.; N. Hatori, N. ; Y. Nakata, Y.; Ebe, H. & H. Ishikava, H. (2002).
Quantum-dot semiconductor optical amplifiers for high-bit-rate signal processing up
to 160 Gbs
−1
and a new scheme of 3R regenerators, Meas. Sci. Technol., Vol. 13, (2002),
1683-1691, ISSN 0957-0233
Sugawara, M.; Ebe, H.; Hatori, N.; Ishida, M.; Arakawa, Y.; Akiyama, T.; Otsubo, K. & Nakata,
Y. (2004) Theory of optical signal amplification and processing by quantum-dot
semiconductor optical amplifiers. Phys. Rev.B, Vol. 69, No. 23 (June 2004) 235332-1-39,
ISSN 1098-0121
Sun, G.; Khurgin, J.B. & Soref, R.A. (2004). Design of quantum-dot lasers with an indirect
bandgap short-period superlattice for reducing the linewidth enhancement factor,
IEEE Photonics Technology Letters, Vol.16, No. 10 (October 2004), 2203-2205, ISSN
1041-1135
25
Semiconductor Optical Amplifiers
Sun, H.; Wang, Q.; Dong, H. & Dutta, N.K. (2005). XOR performance of a quantum dot
semiconductor optical amplifier based Mach-Zender interferometer, Optics Express,
Vol. 13, No. 6, (March 2005) pp.1892-1899, ISSN 10944087
Uskov, A.V. ; Berg, T.W. & Mørk, J. (2004). Theory of pulse-train amplification without
patterning effects in quantum-dot semiconductor optical amplifiers. IEEE J. of
Quantum Electronics, Vol. 40, No. 3, (March 2004) 306-320, ISSN 0018-9197
Ustinov, V.M.; Zhukov, A.E.; Egorov, A. Yu. & Maleev, N. A. (2003). Quantum Dot Lasers,
Oxford University Press, ISBN 0 19 852679 2, Oxford
Wada, O. (2007). Femtosecond all-optical devices for ultrafast communication and signal
processing, In: Microwave Photonics, Lee, C. H. (Ed), 31-75, CRC Press, ISBN-10:
0-8493-3924-3
Wang, Q.; Zhu, G.; Chen, H. ; Jaques, J. ; Leuthold, J.; Picirilli, A.B. & Dutta, N.K. (2004). Study
of all-optical XOR using Mach-Zehnder interferometer and differential scheme. IEEE
J. of Quant. Electr., Vol. 40, No. 6, (June 2004) 703-710, ISSN 0018-9197
Wang, Q. & Yao, J. (2006). UWB doublet generation using nonlinearly-biased electro-optic
intensity modulator, Electronic Letters, Vol. 42, No. 22, (October 2006)1304-1305, ISSN
0013-5194
Yao, J.; Zeng, F. & Wang, Q. (2007). Photonic generation of ultrawideband signals. Journal of
Lightwave Technology, Vol. 25, No. 11, (November 2007) 3219-3235, ISSN 0733-8724
Zhao, B. & Yariv, A. (1999). Quantum well semiconductor lasers. In: Semiconductor Lasers I.
Fundamentals, Kapon, E. (Ed.), 1-121, Academic Press, ISBN 0-12-397630-8, San Diego,
USA
Zhu, Z.; Funabashi, M.; Zhong Pan; Paraschis, L.; Harris, D. & Ben Yoo, S.J. (2007).
High-performance optical 3R regeneration for scalable fiber transmission system
applications. Journal of Lightwave Technology, Vol. 25, No. 2, (January 2007) 504-511,
ISSN 0733-8724
26
Advances in Optical Amplifiers
2
Semiconductor Optical Amplifier
Nonlinearities and Their Applications for
Next Generation of Optical Networks
Youssef Said and Houria Rezig
Sys’Com Laboratory, National Engineering School of Tunis (ENIT)
Tunisia
1. Introduction
Semiconductor optical amplifiers (SOAs) have attracted a lot of interest because of their
application potential in the field of optical communications. Their use has been envisaged in
different applications in the access, core and metropolitan networks. Particularly, they have
been envisioned for all-optical signal processing tasks at very high bit rates that cannot be
handled by electronics, such as wavelength conversion, signal regeneration, optical
switching as well as logic operations. To implement such all-optical processing features, the
phenomena mostly used are: cross gain modulation (XGM), cross phase modulation (XPM),
four-wave mixing (FWM) and cross polarization modulation (XPolM).
The aim of the present work is to present a qualitative and an exhaustive study of the
nonlinear effects in the SOA structure and their applications to achieve important functions for
next generation of optical networks. These phenomena are exploited in high speed optical
communication networks to assure high speed devices and various applications, such as:
wavelength converters in WDM networks, all-optical switches, optical logic gates, etc.
Particularly, we focus on analyzing the impact of variation of intrinsic and extrinsic
parameters of the SOA on the polarization rotation effect in the structure. This nonlinear
behavior is investigated referring to numerical simulations using a numerical model that we
developed based on the Coupled Mode Theory (CMT) and the formalism of Stokes.
Consequently, it is shown that the azimuth and the ellipticity parameters of the output signal
undergo changes according to injection conditions, i.e. by varying the operating wavelength,
the input polarization state, the bias current, the confinement factor and obviously the SOA
length, which plays an important role in the gain dynamics of the structure. We will show that
the obtained results by the developed model are consistent with those obtained following the
experimental measurements that have been carried out in free space.
In addition, an investigation of the impact of nonlinear effects on the SOA behavior in linear
operating and saturation regimes will be reported. Their exploitation feasibility for
applications in high bit rate optical networks are therefore discussed. Hence, the impact of
variation of the SOA parameters on the saturation phenomena is analyzed by our numerical
simulations. It was shown that high saturation power feature, which is particularly required
in wavelength division multiplexing (WDM) applications to avoid crosstalk arising from
gain saturation effects, can be achieved by choosing moderate values of the operating
Advances in Optical Amplifiers
28
parameters. Moreover, we will address one of the essential processes to consider in SOAs
analysis, which is the noise. Particularly, we numerically simulate the impact of noise effects
on the SOA behavior by measuring the gain, the optical signal to noise ratio and the noise
figure. Although its gain dynamics provide very attractive features of high speed optical
signal processing, we show that the noise is important in SOAs and can limit the
performance of the structure. In order to remedy this, we show that using high bias current
at moderate input signal power is recommended.
We report and characterize the impact of the nonlinear polarization rotation on the behavior
of a wavelength converter based on XGM effect in a SOA at 40 Gbit/s. Moreover, we
investigate and evaluate its performance as function of the intrinsic and extrinsic SOA
parameters, such as the bias current, the signal format, the input signal power and its
polarization state that determine the magnitude of the polarization rotation by measuring
the ellipticity and the azimuth. Also, the impact of noise effects on the structure behavior is
investigated through determining the noise figure. In particular, we focus on the
performance of an improved wavelength conversion system via the analysis of quality
factor and bit error rate referring to numerical simulation.
In this chapter, we deal either with the investigation of the SOA nonlinearities; particularly
those are related to the polarization rotation, to exploit them to assure important optical
functions for high bit rate optical networks. The dependence of SOA on the polarization of
the light is an intrinsic feature which can lead to the deterioration of its performance. As a
system, it is very inconvenient because of the impossibility to control the light polarization
state, which evolves in a random way during the distribution in the optical fiber
communication networks. For that reason, the technological efforts of the designers were
essentially deployed in the minimization of the residual polarimetric anisotropy of the
SOAs, through the development of almost insensitive polarization structures. On the other
hand, various current studies have exploited the polarization concept to assure and
optimize some very interesting optical functions for the future generation of the optical
networks, as the wavelength converters, the optical regenerators and the optical logical
gates. In this frame, many studies have demonstrated, by exploiting the nonlinear
polarization rotation, the feasibility of the implementation of optical logical gates,
wavelength converters and 2R optical regenerators.
2. Semiconductor optical amplifier: Concept and state of the art
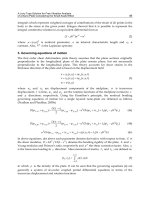
2.1 SOA architecture
A semiconductor optical amplifier (SOA) is an optoelectronic component, which is
characterized by a unidirectional or bidirectional access. Its basic structure, represented in
figure 1, is slightly different from that of the laser diode. Indeed, there will be creation of the
following effects: the inversion of population due to the electric current injection, the
spontaneous and stimulated emission, the non-radiative recombination. Contrary to
semiconductor lasers, there are no mirrors in their extremities but an antireflection coating,
angled or window facet structures have been adopted to reduce light reflections into the
circuit. SOAs manufacturing is generally made with III-V alloys, such as the gallium
arsenide (GaAs), indium phosphide (InP) and various combinations of these elements
according to the required band gap and the characteristics of the crystal lattice. In particular
case for use around 1,55 µm, the couple InGaAsP and InP is usually used for the active layer
and the substratum, respectively.
Semiconductor Optical Amplifier Nonlinearities
and Their Applications for Next Generation of Optical Networks
29
Fig. 1. SOA architecture.
Typical physical features of the SOA structure, used in simulations, are listed in Table 1.
Symbol Description Value
I
bias
Injection current 200 mA
η
in
Input coupling loss 3 dB
η
out
Output coupling loss 3 dB
R
1
Input facet reflectivity 5e-005
R
2
Output facet reflectivity 5e-005
L Active layer length 500 µm
W Active layer width 2.5 µm
d Active layer height 0.2 µm
Γ Optical confinement factor 30%
v
g
Group velocity 75 000 000 m/s
n
r
Active refractive index 3.7
Table 1. SOA parameters used in simulation.
2.2 SOA structure characteristics
The SOA has proven to be a versatile and multifunctional device that will be a key building
block for next generation of optical networks. The parameters of importance, used to
characterize SOAs, are:
• the gain bandwidth,
Input
signal
ASE
Output si
g
nal
ASE
I
bias
Output
facet
Input facet
Active
layer
Electrode
Advances in Optical Amplifiers
30
• the gain saturation,
• the noise figure,
• the polarisation independence,
• the conversion efficiencies,
• the input dynamic range,
• the extinction ratio/crosstalk,
• the tuning speed,
• the wavelength of operation.
The evolution of the SOA output power as function of the wavelength for various values of
the input power is represented in figure 2. It shows that when the wavelength increases, the
output power decreases. So, we can notice that when the input power injected into the SOA
increases, the maximum of the output power will be moved towards the high wavelengths,
which is due to the decrease of the carriers’ density. For example, for an input power of - 18
dBm, the maximal output power is 5,41 dBm for a wavelength equal to 1520 nm; but for an
injected power equal to -5 dBm, the maximum of the output power is 8,29 dBm and
corresponds to a wavelength of 1540 nm. Whereas for an input power equal to 5 dBm, the
maximal value of the output power is 8,95 dBm for a wavelength of 1550 nm.
Fig. 2. SOA output power versus the wavelength of operation for different input powers.
A wide optical bandwidth is a desirable feature for a SOA, so that it can amplify a wide range
of signal wavelengths. In order to analyze the impact of the injection condition on this
parameter, we represent simulation results of the SOA gain as function of the wavelength of
the signal for different input powers. Referring to figure 3, we note that wavelength variations
and the injected power have a significant impact on the gain bandwidth evolution. However,
we can notice according to the obtained curves, which are drawn for a bias current of 200 mA,
that when the input power increases, the gain maximum (known as the peak of the gain) is
Semiconductor Optical Amplifier Nonlinearities
and Their Applications for Next Generation of Optical Networks
31
moved towards the high wavelengths, which is due to the decrease of the carriers’ density. For
an input power of -30 dBm, the gain peak is 26,6 dB at a wavelength equal to 1510 nm, but for
an injected power of -10 dBm, the gain maximum is 17,65 dBm for a wavelength of 1535 nm.
On the other hand, for a high input power of 5 dBm, for example, the gain peak, having a
value of 3,96 dB, is reached for a signal wavelength of 1550 nm, which is higher than the
wavelength corresponding to the last case.
Fig. 3. Gain spectrum as a function of the injected input power.
In order to look for the conditions which correspond to an improvement of the SOA
functioning, we have analyzed the influence of the intrinsic parameters on the SOA
performance by representing, in figure 4, the gain and the noise figure as function of the
bimolecular recombination coefficient (B). We notice that the increase of the B coefficient
entails a diminution of the gain and consequently an increase of the noise figure. These
results are justified by the fact that when the B coefficient increases, there will be an increase
of the carriers’ losses that are caused by the radiative and non-radiative recombination
processes and consequently the carriers’ density decreases, which involves a gain decrease.
In that case, the maximal value of the gain is 26,16 dB, which corresponds to a minimum of
noise figure of 5,27 dB, a B coefficient equal to 9.10
-16
m
3
.s
-1
and an input power P
in
= -30
dBm.
2.3 Noise effects in a SOA structure
One of major processes to consider in the SOA analysis is the amplified spontaneous
emission (ASE) noise, because it strongly affects the structure performance. It is also crucial
in determining the bit error rate (BER) of the transmission system within which the
amplifier resides. The injected signal and the ASE noise interact nonlinearly as they
propagate along the SOA structure. Then, the interaction correlates different spectral
components of the noise. Consequently, we can distinguish three types of noise, which are:
Advances in Optical Amplifiers
32
• The shot noise.
• The signal-spontaneous beat noise.
• The spontaneous-spontaneous beat noise.
Fig. 4. Evolution of the gain and the noise as a function of the bimolecular recombination
coefficient (B) and the SOA injected power.
The power of the ASE noise generated internally within the SOA is given by:
0
2. ( 1).
ASE sp
PnhGB
ν
=
− (1)
Where:
G: is the gain at the optical frequency ν,
h: represents the Planck’s constant,
B
0
: is the optical bandwidth of a filter within which P
ASE
is determined,
n
sp
: refers to the population inversion factor (sometimes called the spontaneous emission
factor).
For an ideal amplifier, n
sp
is equal to 1, corresponding to a complete inversion of the
medium. However, in the usual case, the population inversion is partial and so n
sp
> 1.
The shot noise results in the detection of the received total optical power due to the signal
and the power of the ASE noise. It is given by the following equation:
2
0
.
2. . . .( 1)
.
in
shot e sp
GP
NeB nBG
h
ν
⎛⎞
=+−
⎜⎟
⎝⎠
(2)
Where B
e
is the electrical bandwidth of the photo-detector.
The noise contribution due to the signal exists as well there is no optical amplifier; this later
simply modifies the signal power, then the shot noise power related to this introduces a
supplementary shot noise that is associated to the detection of the ASE.
Semiconductor Optical Amplifier Nonlinearities
and Their Applications for Next Generation of Optical Networks
33
The two intrinsic components related to beat noise are produced when optical signals and
ASE coexist together. The first type of beat noise which is the signal-spontaneous beat noise
occurs between optical signals and ASE having frequency close to that of the optical signals.
It is given by the following equation:
2
4. . . . . .( 1)
.
ssp e in sp
e
NBPnGG
h
ν
−
=
− (3)
The second type, which is the spontaneous-spontaneous beat noise, occurs between ASEs. It
is expressed as follows:
222
0
.(2 ). . .( 1)
sp sp e e sp
NeBBBnG
−
=− − (4)
The signal-spontaneous beat noise is preponderant for a strong input signal, whereas the
spontaneous-spontaneous beat noise is dominating when there is an injection of a small
input power. Compared to the shot noise and the signal-spontaneous beat noise, the
spontaneous-spontaneous beat noise can be significantly minimized by placing an optical
filter having a bandwidth B
0
after the amplifier.
A convenient way to quantify and characterize the noise and describe its influence on the
SOA performance is in terms of Noise Figure (NF) parameter. It represents the amount of
degradation in the signal to noise ratio caused by amplification process, and it is defined as
the ratio between the optical signal to noise ratio (OSNR) of the signal at the input and
output of SOA:
in
out
OSNR
NF
OSNR
= (5)
The OSNR of the input signal is given by the following equation (Koga & Matsumoto, 1991):
2. . .
in
in
e
P
OSNR
hB
ν
= (6)
The OSNR of the input signal is proportional to the optical power of the input signal, or
more specifically to the input number of photons per unit time (P
in
/hν). Whereas, the OSNR
of the output signal is defined by:
2
1
.
.
in
out
shot s s
p
s
p
s
p
eP G
OSNR
hNNN
ν
−−
⎛⎞
=
⎜⎟
++
⎝⎠
(7)
Accordingly, by substituting equations (2), (3), (4), (6) and (7) into (5), the noise figure can be
written as follows:
22
00
22
. . .( 1) (2 ). . .( 1)
11
2. .
2.
sp in e sp in
sp
out out
h BnP G h B BnP G
G
NF n
GG P P
νν
−−−
−
=+ + + (8)
In practical case, the last two terms can be neglected because the ASE power is weak
compared with the signal power; otherwise the spontaneous-spontaneous beat noise can be
Advances in Optical Amplifiers
34
minimized by placing an optical filter at the output. So the noise figure can be rewritten as
(Simon et al., 1989):
11
2. .
sp
G
NF n
GG
−
≈+
(9)
Since spontaneous emission factor (n
sp
) is always greater than 1, the minimum value of NF
is obtained for n
sp
=1. So, for large value of gain (G>>1), the noise figure of an ideal optical
amplifier is 3dB. This is considered as the lowest NF that can be achieved. This implies that
every time an optical signal is amplified, the signal to noise ratio is reduced to the half.
The NF can be expressed as function of the power of ASE noise, which is given by (1), as
follows:
0
1
2.
.
ASE
P
NF
GhGB
ν
≈+ (10)
Fig. 5. Evolution of the noise figure as a function of the SOA gain for different bias current
values.
The NF is represented as function of the gain in figure 5. This result is very significant
because it allows us to choose the characteristics of the SOA in order to obtain the highest
value of the gain for a minimum noise figure. So, we can notice that a low gain corresponds
to a high value of NF; whereas to have the possible maximum of the gain while satisfying
the criterion of low noise, it is necessary to choose the highest bias current possible.
2.4 Linear and saturation operating regimes in a SOA structure
A SOA amplifies input light through stimulated emission by electrically pumping the
amplifier to achieve population inversion. It should have large enough gain for such
application. The gain is dependent on different parameters, such as the injected current, the
Semiconductor Optical Amplifier Nonlinearities
and Their Applications for Next Generation of Optical Networks
35
device length, the wavelength and the input power levels. The SOA gain decreases as the
input power is increased.
This gain saturation of the SOA is caused not only by the depletion of carrier density owing
to stimulated emission, but also by the main intraband processes, such as spectral hole
burning (SHB) and carrier heating (CH). However, when the SOA is operated with pulses
shorter than a few picoseconds, intraband effects become important.
The origin of gain saturation lies in the power dependence of the gain coefficient where the
population inversion due to injection current pumping is reduced with the stimulated
emission induced by the input signal.
The saturation power parameter of the SOAs is of practical interest. It is a key parameter of
the amplifier, which influences both the linear and non-linear properties. It is defined as the
optical power at which the gain drops by 3 dB from the small signal value. That is to say, it
is the optical power which reduces the modal gain to half of the unsaturated gain.
The saturation output power of the SOA is given by (Connelly, 2002):
.
sat s
A
PI=
Γ
(11)
Where:
.
.
s
Ns
h
I
a
ν
τ
= (12)
A: denotes the active region cross-section area,
Γ: represents the optical confinement factor coefficient,
a
N
: symbolizes the differential modal gain,
τ
s
: makes reference to spontaneous carrier lifetime.
High saturation output power is a desirable SOA characteristic, particularly for power
booster and multi-channel applications. Referring to equation (11), the saturation output
power can be improved by increasing the saturation output intensity (I
s
) or reducing the
optical confinement factor. The former case can be achieved either by reducing the
differential modal gain and/or the spontaneous carrier lifetime. Since the last parameter (τ
s
)
is inversely proportional to carrier density, operation at a high bias current leads to an
increase in the saturation output power. Nevertheless, when the carrier density increases,
the amplifier gain also increases, making resonance effects more significant.
As the saturation output power depends inversely on the optical confinement factor, the
single pass gain can be maintained by reducing this coefficient or by increasing the amplifier
length. This process is not always necessary for the reason that the peak material gain
coefficient shifts to shorter wavelengths as the carrier density is increasing.
When the average output power is at least 6 dB less than the output saturation power, non-
linear effects are not observed and the SOA is in the linear regime. This linear operating
regime, which is closely related to the output saturation power, is defined as the output
power of an SOA where the non-linear effects do not affect the input multi-channel signal.
Gain saturation effects introduce undesirable distortion to the output signal. So, an ideal
SOA should have very high saturation output power to achieve good linearity and to
maximize its dynamic range with minimum distortion. Moreover, high saturation output
power is desired for using SOAs especially in wavelength division multiplexing (WDM)
Advances in Optical Amplifiers
36
systems. Figure 6 shows that the highest value of the saturation output power, which
corresponds to very fast dynamics of the carriers’ density, is obtained when a strong bias
current is used. Furthermore, we can notice that a high value of the bias current can
engender a high gain with a high saturation output power. On the other hand, a low bias
current corresponds to a less strong gain with a less high saturation output power, but the
saturation input power is stronger.
Fig. 6. Evolution of the gain as a function of the output power and the SOA bias current.
Because of the SOA’s amplification and nonlinear characteristics, SOAs or integrated SOAs
with other optical components can be exploited to assure various applications for high bit
rate network systems. Moreover, large switching matrices comprised of SOA gates can be
constructed to take advantage of the SOA gain to reduce insertion losses, to overcome
electronic bottlenecks in switching and routing. The fast response speed can also be utilized
effectively to perform packet switching.
3. SOA nonlinearities
SOAs are showing great promise for use in evolving optical networks and they are
becoming a key technology for the next generation optical networks. They have been
exploited in many functional applications, including switching (Kawaguchi, 2005),
wavelength conversion (Liu et al., 2007), power equalization (Gopalakrishnapillai et al.,
2005), 3R regeneration (Bramerie et al., 2004), logic operations (Berrettini et al., 2006), etc.,
thanks to their nonlinear effects, which are the subject of the current section. The effects are:
the self gain modulation (SGM), the self phase modulation (SPM), the self induced nonlinear
polarization modulation (SPR), the cross-gain modulation (XGM), the cross-phase
modulation (XPM), the four-wave mixing (FWM) and the cross-polarization modulation
(XPolM). These functions, where there is no conversion of optical signal to an electrical one,
are very useful in transparent optical networks.
Semiconductor Optical Amplifier Nonlinearities
and Their Applications for Next Generation of Optical Networks
37
In SOA operational regime, there is a variation of the total density of the carriers and their
distributions. This variation engenders intraband and interband transitions. The interband
transition changes the carrier density but does not affect the carrier distribution. It is
produced by the stimulated emission, the spontaneous emission and the non-radiative
recombination. The modification of the total density of the carriers comes along with the
modification of the carriers in the same band. The intraband transitions, such as spectral
hole burning (SHB) and carrier heating (CH) are at the origin of the fast dynamics of the
SOAs. They change the carrier distribution in the conduction band.
The main nonlinear effects involved in the SOAs, having for origin carriers dynamics and
caused mainly by the change of the carriers density induced by input signals, are the
following ones:
3.1 Self Gain Modulation
The self gain modulation (SGM) is an effect which corresponds to the modulation of the
gain induced by the variation of the input signal power. It can be used to conceive a
compensator of signal distortion.
3.2 Self Phase Modulation
The self phase modulation (SPM) is a nonlinear effect that implies the phase modulation of
the SOA output signal caused by the refractive index variation induced by the variation of
the input signal power.
3.3 Self induced nonlinear Polarization Rotation
The self induced nonlinear polarization rotation (SPR) translates the self rotation of the
polarization state of the SOA output signal with regard to input one.
3.4 Cross-Gain Modulation
The cross-gain modulation (XGM) is a nonlinear effect, which is similar to the SGM. It implies
the modulation of the gain induced by an optical signal (known as a control or pump signal),
which affects the gain of a probe signal propagating simultaneously in the SOA. The XGM can
take place in a SOA with a co-propagative or counter-propagative configuration.
3.5 Cross-Phase Modulation
The cross-phase modulation (XPM) is a nonlinear effect, which is similar to the SPM. It
corresponds to the change of the refractive index induced by an optical signal (known as a
control or pump signal), which affects the phase of another optical signal (probe)
propagating at the same time in the SOA structure.
3.6 Four Wave Mixing
The four wave mixing (FWM) is a parametric process, which is at the origin of the
production of new frequencies. It can be explained by the beating between two or several
optical signals having different wavelengths propagating in the SOA structure, which
generates signals having new optical frequencies.
The FWM effect in SOAs has been shown to be a promising method for wavelength
conversion. It is attractive since it is independent of modulation format, capable of
Advances in Optical Amplifiers
38
dispersion compensation and ultra fast. So, wavelength conversion based on FWM effect
offers strict transparency, including modulation-format and bit-rate transparency, and it is
capable of multi-wavelength conversions. However, it has low conversion efficiency and
needs careful control of the polarization of the input lights (Politi et al., 2006). The main
drawbacks of wavelength conversion based on FWM are polarization sensitivity and the
frequency-shift dependent conversion efficiency.
3.7 Cross-Polarization Modulation
The cross-polarization modulation (XPolM) effect in a SOA structure, which has been
subject of many investigations in recent years, is a nonlinear effect similar to the SPR. It
denotes the polarization rotation of a beam propagating in a SOA affected by the
polarization and the power of a relatively strong control beam, introduced simultaneously
into the amplifier. When two signals are injected in the SOA, an additional birefringence
and gain compression affects the SOA. The two signals affect one another by producing
different phase and gain compression on the transverse electric (TE) and transverse
magnetic (TM) components (because the gain saturation of the TE and TM modes is
different). This results in a rotation of the polarization state for each signal. The SOA bias
current, and the input signal power are among the parameters that determine the
magnitude of the polarization rotation. As a result, the XPolM effect in SOA is then directly
related to the TE/TM mode discrepancy of XPM and XGM.
The nonlinear polarization rotation that occurs in the SOA is demonstrated to perform very
interesting functionalities in optical networks. However, it is exploited in optical gating, in
wavelength conversion, in regeneration and in all-optical switching configurations that are
required for wavelength routing in high-speed optical time-division multiplexing networks.
4. Modelling of polarization rotation in SOAs using the Coupled Mode Theory
4.1 Analysis of the polarization rotation in SOA with application of Stokes parameters
A convenient method to describe the state of polarization is in terms of Stokes parameters.
They provide a very useful description of the polarization state of an electromagnetic wave.
Moreover, they characterize the time-averaged electric-field intensity and the distribution of
polarization among three orthogonal polarization directions on the Poincaré sphere. They
are used in this work to analyze the polarization change at the SOA output with relation to
its state at the input for various length of the active region. They are noted as (S
0
, S
1
, S
2
, S
3
)
and defined as (Flossmann et al., 2006):
()
()
22
0
22
1
2
3
2. .cos
2. .sin
TE TM
TE TM
TE TM TM TE
TE TM TM TE
S
AA
S
AA
S
AA
S
AA
φφ
φφ
⎛⎞
+
⎛⎞
⎜⎟
⎜⎟
−
⎜⎟
⎜⎟
=
⎜⎟
⎜⎟
−
⎜⎟
⎜⎟
⎜⎟
⎜⎟
−
⎝⎠
⎝⎠
(13)
Where:
S
0
is a parameter that translates the total intensity.
S
1
refers to the intensity difference between the horizontal polarization and the vertical
polarization.
S
2
makes reference to the difference between intensities transmitted by the axes (45°, 135°).
Semiconductor Optical Amplifier Nonlinearities
and Their Applications for Next Generation of Optical Networks
39
S
3
is a parameter that expresses the difference between intensities transmitted for the left
and right circular polarizations.
TE
φ
and
TM
φ
denote the phase shift for the TE and TM modes, respectively.
The normalized Stokes parameters that can be measured at the SOA structure output by
using a polarization analyzer are given by:
0
i
i
S
s
S
= with i ∈{1, 2, 3} (14)
The phase shift variation can be written as follows:
3
2
arctan
TM TE
s
s
φφ φ
⎛⎞
Δ= − =
⎜⎟
⎝⎠
(15)
The relationship of the normalized Stokes parameters to the orientation (azimuth) and the
ellipticity angles, ψ and χ, associated with the Poincaré Sphere is shown in the following
equations (Guo & Connelly, 2005):
1
2
3
cos(2 ).cos(2 )
sin(2 ).cos(2 )
sin(2 )
s
s
s
ψ
χ
ψ
χ
χ
⎛⎞⎛ ⎞
⎜⎟⎜ ⎟
=
⎜⎟⎜ ⎟
⎜⎟⎜ ⎟
⎝⎠⎝ ⎠
(16)
Therefore, the polarization change at the SOA output can be analyzed and evaluated by the
azimuth and the ellipticity that can be expressed as function of normalized Stokes parameters:
()
2
1
3
1
arctan
2
1
arcsin
2
s
s
s
ψ
χ
⎧
⎛⎞
=
⎪
⎜⎟
⎪
⎝⎠
⎨
⎪
=
⎪
⎩
(17)
4.2 Concept of the proposed model
In this model, which is based on the coupled mode theory (CMT), we assume that the
optical field is propagating in the z-direction of the SOA structure and it is decomposed into
TE and TM component. In addition, the TE/TM gain coefficients are supposed, in a
saturated SOA, to be not constant along the amplifier length and then can be written as the
following forms (Connelly, 2002):
() . ()
() . ()
TE TE m TE
TM TM m TM
gz gz
gz gz
α
α
=
Γ−
⎧
⎨
=Γ −
⎩
(18)
Where g
TE
and g
TM
are the gain coefficients, Γ
TE
and Γ
TM
denote the confinement factors, α
TE
and α
TM
symbolize the efficient losses, respectively for TE and TM modes. g
m
designates the
gain material coefficient.
To estimate the polarization sensitivity of a saturated amplifier, the material intensity gain
coefficient is assumed to be saturated by the light intensity as the following equation
(Gustavsson, 1993):