báo cáo hóa học: " Persistently elevated T cell interferon-γ responses after treatment for latent tuberculosis infection among health care workers in India: a preliminary report" pot
Bạn đang xem bản rút gọn của tài liệu. Xem và tải ngay bản đầy đủ của tài liệu tại đây (347.53 KB, 7 trang )
BioMed Central
Page 1 of 7
(page number not for citation purposes)
Journal of Occupational Medicine
and Toxicology
Open Access
Research
Persistently elevated T cell interferon-γ responses after treatment
for latent tuberculosis infection among health care workers in India:
a preliminary report
Madhukar Pai*
1,2,3
, Rajnish Joshi
1,2
, Sandeep Dogra
2
, Deepak K Mendiratta
2
,
Pratibha Narang
2
, Keertan Dheda
4
and Shriprakash Kalantri
2
Address:
1
Division of Epidemiology, School of Public Health, University of California, Berkeley, USA,
2
Departments of Medicine & Microbiology,
Mahatma Gandhi Institute of Medical Sciences, Sevagram, India,
3
Division of Pulmonary & Critical Care Medicine, San Francisco General
Hospital, University of California, San Francisco, USA and
4
Centre for Infectious Diseases and International Health The Royal Free and University
College Medical School, London, UK
Email: Madhukar Pai* - ; Rajnish Joshi - ; Sandeep Dogra - ;
Deepak K Mendiratta - ; Pratibha Narang - ;
Keertan Dheda - ; Shriprakash Kalantri -
* Corresponding author
Abstract
Background: T cell-based interferon-γ (IFN-γ) release assays (IGRAs) are novel tests for latent tuberculosis infection
(LTBI). It has been suggested that T cell responses may be correlated with bacterial burden and, therefore, IGRAs may
have a role in monitoring treatment response. We investigated IFN-γ responses to specific TB antigens among Indian
health care workers (HCWs) before, and after LTBI preventive therapy.
Methods: In 2004, we established a cohort of HCWs who underwent tuberculin skin testing (TST) and a whole-blood
IGRA (QuantiFERON-TB-Gold In-Tube [QFT-G], Cellestis Ltd, Victoria, Australia) at a rural hospital in India. HCWs
positive by either test were offered 6 months of isoniazid (INH) preventive therapy. Among the HCWs who underwent
therapy, we prospectively followed-up 10 nursing students who were positive by both tests at baseline. The QFT-G assay
was repeated 4 and 10 months after INH treatment completion (i.e. approximately 12 months and 18 months after the
initial testing). IFN-γ responses to ESAT-6, CFP-10 and TB7.7 peptides were measured using ELISA, and IFN-γ ≥0.35 IU/
mL was used to define a positive QFT-G test result.
Results: All participants (N = 10) reported direct contact with smear-positive TB patients at baseline, during and after
LTBI treatment. All participants except one started treatment with high baseline IFN-γ responses (median 10.0 IU/mL).
The second QFT-G was positive in 9 of 10 participants, but IFN-γ responses had declined (median 5.0 IU/mL); however,
this difference was not significant (P = 0.10). The third QFT-G assay continued to be positive in 9 of 10 participants, with
persistently elevated IFN-γ responses (median 7.9 IU/mL; P = 0.32 for difference against baseline average).
Conclusion: In an environment with ongoing, intensive nosocomial exposure, HCWs had strong IFN-γ responses at
baseline, and continued to have persistently elevated responses, despite LTBI treatment. It is plausible that persistence
of infection and/or re-infection might account for this phenomenon. Our preliminary findings need confirmation in larger
studies in high transmission settings. Specifically, research is needed to study T cell kinetics during LTBI treatment, and
determine the effect of recurrent exposures on host cellular immune responses.
Published: 23 May 2006
Journal of Occupational Medicine and Toxicology 2006, 1:7 doi:10.1186/1745-6673-1-7
Received: 10 February 2006
Accepted: 23 May 2006
This article is available from: />© 2006 Pai et al; licensee BioMed Central Ltd.
This is an Open Access article distributed under the terms of the Creative Commons Attribution License ( />),
which permits unrestricted use, distribution, and reproduction in any medium, provided the original work is properly cited.
Journal of Occupational Medicine and Toxicology 2006, 1:7 />Page 2 of 7
(page number not for citation purposes)
Background
The World Health Organization (WHO) has estimated
that approximately one third of the world's population is
infected with Mycobacterium tuberculosis [1,2]. This large
pool of individuals with latent infection poses a major
hurdle for global tuberculosis (TB) control efforts.
Between 8 and 9 million people develop TB disease each
year, and about 2 million die from TB every year [1,3].
Until recently, the only tool available to detect latent
tuberculosis infection (LTBI) was the tuberculin skin test
(TST). Although the TST is useful in clinical practice, it has
several known limitations, including variable specificity,
cross-reactivity with BCG vaccine and non-tuberculous
mycobacterial (NTM) infection, and problems with relia-
bility [4-6].
Because of advances in molecular biology and genomics,
for the first time, an alternative has emerged in the form
of a new class of T cell-based, in vitro assays that measure
interferon-γ (IFN-γ) released by sensitized T cells after
stimulation by Mycobacterium tuberculosis antigens [7-10].
Early versions of IFN-γ release assays (IGRAs) used puri-
fied protein derivative (PPD) as the stimulating antigen,
but these tests have been replaced by newer versions that
use antigens (early secreted antigenic target 6 [ESAT-6]
and culture filtrate protein 10 [CFP-10]) that are more
specific to M. tuberculosis than PPD. These antigens,
encoded by genes located within the region of difference
1 (RD1) segment of the M. tuberculosis genome, are more
specific because they are not shared with any of the BCG
vaccine strains or certain species of NTM [11,12].
Two IGRAs are now available as commercial kits: the T-
SPOT.TB
®
test (Oxford Immunotec, Oxford, UK), and the
QuantiFERON
®
-TB Gold
®
(Cellestis Ltd, Carnegie, Aus-
tralia) assay. The QuantiFERON
®
-TB Gold (QFT-G) assay
is available in two formats, a 24-well culture plate format
(approved by the US Food and Drug Administration
[FDA] [13]), and a newer, simplified In Tube format (not
FDA approved as yet; but available in other countries
[14]). The T-SPOT.TB test is currently CE marked for use
in Europe.
Research evidence, extensively reviewed elsewhere [7-
10,13-15], suggests that IGRAs are more specific than TST,
better correlated with markers of TB exposure in low inci-
dence settings, and less affected by BCG vaccination than
the TST. In the US, the Centers for Disease Control and
Prevention (CDC) has recommended that QFT-G can be
used in place of the TST for all indications, including
screening of contacts, immigrants, and health care work-
ers [13]. In the UK, the National Institute for Health and
Clinical Excellence (NICE) Tuberculosis guidelines rec-
ommend a two-step strategy for LTBI diagnosis: initial
screen with TST, and those who are positive (or in whom
TST may be unreliable) should then be considered for
IGRA testing, if available, to confirm positive TST results
[16].
Although IGRAs are promising and offer several logistical
advantages [7,8,13,14], unresolved issues remain
[7,8,10,13,17,18]. One area of controversy is whether
they can be used for monitoring treatment responses
[7,8,10]. It has been hypothesized that short incubation
assays (e.g. both commercial assays use 16 – 24 hours
incubation) detect responses of partially activated, effec-
tor T cells that have recently encountered antigens in vivo,
and can therefore rapidly release IFN-γ when stimulated in
vitro [19,20]. In contrast, long-lived central memory T
cells that may persist even after clearance of the organism
(e.g. previously treated TB) are less likely to release IFN-γ
with short incubation [20]. Effector response may be
driven by the antigen load, and there is evidence that
reduction of the antigen load by treatment decreases T cell
responses [19,20].
Although studies have examined the effect of active TB
treatment on IFN-γ responses, the results have been incon-
sistent. As reviewed elsewhere [7,8], some studies have
shown declining responses after treatment, whereas oth-
ers have shown unchanging, fluctuating, or increasing
responses over treatment. It is plausible that variations in
incubation periods (short vs. long), antigens (proteins vs.
peptides), and assay formats (ELISA vs. ELISPOT) might
explain some of the discrepancies [7,8]. In contrast to
active TB, limited data exist on T cell responses after LTBI
preventive therapy [21,22]. In this preliminary report, we
present data on T cell responses before and after preven-
tive therapy among health care workers (HCWs) in rural
India. TB is an important but poorly studied occupational
risk among Indian HCWs [23-25]. As in the case of most
developing countries, infection control measures are
rarely used in Indian hospitals, and HCWs tend to get
repeatedly exposed to smear-positive TB patients. How-
ever, not much research has been conducted using newer
IGRAs among HCWs who work in high incidence coun-
tries.
Methods
Description of the study cohort
In early 2004, we established a cohort of 726 HCWs
(median age, 22 years; 62% women) who underwent TST
and QFT-G In-Tube testing at a rural medical school hos-
pital in India [23]. This hospital has a high TB case load,
and like most hospitals in India, repeated exposure to TB
is common among HCWs [23]. Our cohort of 726 HCWs
was comprised of 353 (49%) medical students and nurs-
ing students, 73 (10%) interns and residents, 161 (22%)
nurses, 13 (2%) attending physicians/faculty, and 126
Journal of Occupational Medicine and Toxicology 2006, 1:7 />Page 3 of 7
(page number not for citation purposes)
(17%) orderlies and laboratory workers. About 71% of
the cohort had BCG vaccine scars, and only 5% had
received TST prior to the baseline study. At baseline, of the
726 HCWs, 68% reported having had at least one direct
contact with a patient with TB (direct contact was defined
as contact between two people that is of sufficient distance
to allow conversation between them [26]).
Tuberculin skin test and QuantiFERON-TB Gold In Tube
assay
At baseline, all HCWs underwent a TST (Mantoux tech-
nique) using 1 TU PPD RT23, the standard dose in India
[27]. 1 TU of the PPD was administered on the volar sur-
face of the forearm by a certified technician using the
Mantoux method. The maximum transverse diameter of
the induration was read after 48 – 72 hours using a
blinded caliper. IFN-γ responses to ESAT-6, CFP-10, and
TB7.7 (Rv2654) were measured by the QFT-G In Tube
assay, as per the manufacturer's instructions (Cellestis
Limited, Victoria, Australia).
The QFT-G In Tube assay involved two stages: (1) incuba-
tion of whole blood with antigens, and (2) measurement
of IFN-γ production in harvested plasma by ELISA.
Venous blood was directly collected into three 1 mL
heparin-containing tubes. One tube contained only
heparin as negative control, another also contained the T-
cell mitogen phytohemagglutinin as positive control, and
the third tube had overlapping peptides representing the
entire sequences of ESAT-6 and CFP-10 and another pep-
tide from the TB antigen TB7.7 (Rv2654). Within 2 – 6
hours of blood draw, the tubes were incubated at 37°C.
After 24 hours of incubation, the tubes were centrifuged
and plasma was harvested and frozen at -70°C until the
ELISA was performed. The amount of IFN-γ was quanti-
fied using the QFT ELISA. The ELISA readout was analyzed
using the QFT-G software. IFN-γ values (International
Units [IU] per mL) for TB-specific antigens and mitogen
were corrected for background by subtracting the value
obtained for the respective negative control.
As recommended by the manufacturer and used in previ-
ous studies [23,24,28-30], an IFN-γ ≥0.35 IU/mL for (TB
antigens – Negative control) was considered indicative of
TB infection. For a QFT-G result to be valid, the (Mitogen
– Negative control) must be = 0.5 IU/mL and/or (TB anti-
gens – Negative control) must be ≥ 0.35 IU/mL. All assays
were deemed valid, and met the internal quality stand-
ards. No indeterminate results were reported.
Cohort follow-up
As reported previously [23], at baseline (in 2004), valid
TST results were available for 720 of 726 HCWs, and valid
QFT-G results were available for 725 of 726 HCWs. The
baseline prevalence estimates of TST and QFT-positivity
were comparable (41% [95% CI 38% – 45%] and 40%
[95% CI 37% – 43%], respectively). Baseline agreement
between TST and QFT-G was high (81%, κ = 0.61 [95% CI
0.56–0.67]). Increasing age and years in the health profes-
sion were significant risk factors for both QFT and TST
Table 1: T cell interferon-γ responses in nursing students treated for latent tuberculosis infection with isoniazid preventive therapy for
6 months (N = 10)
ID
number
Age at
baseline
Sex
M/F
BCG
scar (Y/
N)
TST at
baseline
(mm)
IFN-γ responses at baseline
(Jan/Feb 2004)
IFN-γ responses at second
survey, 4 months after INH
treatment (Jan 2005)
IFN-γ responses at third
survey, 10 months after INH
treatment (July 2005)
Result
(Pos/Neg)*
IU/mL** Result
(Pos/Neg)*
IU/mL** Result
(Pos/Neg)*
IU/mL**
10055 19 F Y 14 P 10.0 P 10.0 P 10.0
10066 19 F Y 15 P 10.0 P 2.55 P 10.0
10069 19 F Y 17 P 9.55 P 10.0 P 10.0
10077 19 F N 19 P 10.0 P 4.34 P 2.04
10082 19 F Y 18 P 10.0 P 10.0 P 5.86
10089 19 F Y 16 P 10.0 P 8.35 P 1.51
10093 19 F N 20 P 10.0 P 5.13 P 3.31
10115 24 F Y 17 P 0.39 N 0 N 0.21
10282 19 F N 15 P 1.21 P 4.40 P 10.0
10290 18 F N 18 P 10.0 P 4.81 P 10.0
Mean
(SD)
8.1 (3.9) 5.9 (3.5) 6.3 (4.2)
Median 10.0 5.0 7.9
*QFT-G cut-point for positivity: ≥0.35 IU/mL
** IFN-γ values >10.0 IU/mL have been shown as 10 IU/mL
TST: tuberculin skin test; QFT-G: QuantiFERON-TB Gold In Tube assay; INH: isoniazid; BCG: bacille Calmette-Guerin; SD: standard deviation
Journal of Occupational Medicine and Toxicology 2006, 1:7 />Page 4 of 7
(page number not for citation purposes)
positivity. Since 2004, this HCW cohort has been under
follow-up. Notably, a repeat survey of this cohort in 2005
showed a high annual risk of TB infection (ARTI) among
young trainees at this hospital [24]; the ARTI was esti-
mated to be 5%, and this rate is higher than the popula-
tion average of 1.5% for India [31].
After baseline testing in 2004, individuals positive by
either TST or QFT-G were offered 6 months of standard
isoniazid (INH) as preventive therapy. At baseline, 360 of
726 (50%) HCWs were positive by either TST or QFT-G
[23]. However, only 61 (17%) accepted INH, and 35
(10%) completed treatment.
In January 2005, 22 nursing students who had undergone
baseline testing in January/February 2004, and had com-
pleted INH treatment 4 months earlier, underwent a fol-
low-up QFT-G. These students underwent a third QFT-G
in July 2005, 10 months after treatment. Of the 22 stu-
dents, 10 students were TST and QFT-G positive at base-
line (i.e. TST+/QFT-G+), and underwent both follow-up
QFT-G tests. These students also completed question-
naires on their work patterns and TB exposure during the
follow-up. Identical assay protocols were used for all QFT-
G tests, and follow-up assays were performed blinded to
the previous results. Because these HCWs were TST-posi-
tive at baseline, they were not asked to undergo repeat
tuberculin skin testing. All participants gave informed
consent, and the research protocol was approved by ethics
committees in India and USA [23].
Statistical analyses
Data were analyzed using Stata 9 (Stata Corp, Texas, USA).
The main outcome was effect of treatment on QFT-G
results, expressed as dichotomous (positive/negative) and
continuous measures (IFN-γ expressed as IU/mL). Because
the QFT-G ELISA cannot accurately measure IFN-γ values
>10 IU/mL, values >10 IU/mL were treated as 10 IU/mL
in all the analyses. Differences between average IFN-γ lev-
els were analyzed using the Wilcoxon signed-rank test.
Results
All the participants (N = 10) were female nursing students
(median age 19 years, range 18 to 24), and reported direct
contact (pragmatically defined as contact between two
people that is of sufficient distance to allow conversation
between them [23,26]) with smear-positive TB patients at
baseline, during and after LTBI treatment. All participants
were TST and QFT-G positive at baseline (in 2004), and all
had completed INH treatment with good adherence. The
median baseline TST induration was 17 mm (range 14 to
20 mm), and 6 of 10 (60%) participants had BCG scars.
As seen in the Table and Figure, all participants except one
started treatment with high baseline IFN-γ responses
(median 10.0 IU/mL, after correcting for the background).
The second QFT-G assay was positive in 9 of 10 (90%)
participants, but IFN-γ responses had declined (median
5.0 IU/mL); however, this difference was not statistically
significant (P = 0.10). The third QFT-G assay continued to
be positive in 9 of 10 (90%) participants, with persistently
elevated IFN-γ responses (median 7.9); P = 0.32 for differ-
ence against the baseline average. Only one participant
had a reversion; this individual had a baseline response of
0.39 IU/mL, just above the diagnostic threshold of 0.35
IU/mL.
Discussion
In latent TB infection, bacterial burden is low, and preven-
tive therapy with a single drug (isoniazid) for 6–9 months
is considered adequate to prevent active disease [32,33].
However, currently there is no test or surrogate marker to
monitor response to LTBI preventive therapy. Also, there
is no reliable test that can detect new exogenous TB infec-
tion after successful clearance of the original infection. An
association between INH treatment and tuberculin rever-
sions has been reported in the past [34,35], and based on
the results of some studies that showed declining IFN-γ
responses after active TB treatment [36-39], it is plausible
that INH treatment might decrease IFN-γ responses. In
contrast to active TB, the kinetics of T cell responses dur-
ing LTBI treatment has not been well studied, and, to our
knowledge, this is the first report of longitudinal changes
in IFN-γ responses after LTBI treatment among HCWs in a
high burden, developing country, measured using the lat-
est In Tube version of the QFT-G assay.
In a recent study from Japan, 37 HCWs underwent QFT-G
assays after INH for 6 months [21]. Although many HCWs
continued to remain QFT-G positive, IFN-γ levels were sig-
nificantly lower soon after treatment: ESAT-6 responses
decreased from 3.36 ± 4.97 to 1.21 ± 2.23 IU/mL; CFP-10
responses decreased from 1.69 ± 3.15 to 0.23 ± 2.04 IU/
mL [21]. The authors speculated that it might take longer
than 6 months for clearance of infection, and recom-
mended longer follow-up.
In another recent study, healthy TST-positive immigrants
in the UK underwent an ELISPOT assay at the beginning,
during, and end of INH and rifampicin for 12 weeks [22].
Treatment resulted in a 1.8 fold rise in the numbers of
IFN-γ producing T cells within 26 ± 4 days of starting treat-
ment, followed by a decrease to below baseline by the end
of treatment [22]. There was no significant overall change
in T cell responses in an untreated group.
Our study, although limited by the small numbers, and
lack of an untreated control group, offers a different per-
spective, because it was conducted in a nosocomial setting
in a high-prevalence country. Almost all HCWs in our
Journal of Occupational Medicine and Toxicology 2006, 1:7 />Page 5 of 7
(page number not for citation purposes)
study had persistent high T cell IFN-γ responses, even 10
months after treatment completion. Although there was a
modest decline in the average IFN-γ responses after treat-
ment, the post-treatment responses remained substan-
tially higher than the diagnostic threshold. It is possible
that some of the observed changes were due to regression
to the mean, or to random variability. The only partici-
pant who had a reversion, had a low baseline IFN-γ
response, close to the threshold. This finding is consistent
with our previous follow-up study of this HCW cohort
[24]. In the absence of any longitudinal data on out-
comes, it is not clear if individuals with high T cell
responses after treatment are at greater or lesser risk of
progressing to disease. Long-term follow-up of large
cohorts are needed to answer these questions.
In the absence of a strong evidence base on this topic, we
put forth several tentative hypotheses that might explain
our findings. First, in high incidence settings, individuals
with LTBI may have very strong IFN-γ responses at diagno-
sis. In fact, 80% of our participants had baseline values
≥10 IU/mL, much higher than those reported from Japan
[21]. Therefore, unless the IFN-γ levels drop drastically,
QFT-G reversions are unlikely, even after treatment. Sec-
ond, it is possible, that in HCWs repeatedly exposed to TB,
6 months of INH is inadequate to clear the infection. INH
resistance might influence this. In India, about 10% of
newly diagnosed smear-positive TB patients have INH
resistance [40]. It will be interesting to do similar experi-
ments after the longer, 9 month INH regimen, or alterna-
tive LTBI regimens (e.g. rifampin for 4 months).
Third, ongoing exposure and/or exogenous re-infection
might keep the effector T cells partially activated, and
therefore T cell responses remain robust even after antigen
load declines with therapy. Interestingly, some individu-
als had a transient decline in T cell responses shortly after
treatment, but much higher responses subsequently. It is
plausible that these individuals became re-infected after
successful clearance of their primary infection. Studies in
high incidence settings are required to address these
intriguing questions, but will be challenging to conduct
because of potential confounders such as malnutrition,
BCG vaccination, non-tuberculous mycobacteria, and
tropical infections (e.g. helminthiasis). In low incidence
settings (e.g. Japan and UK), it is possible that treatment
might cause steeper declines in IFN-γ responses [21,22].
Fourth, the duration of follow-up in our study may have
been inadequate. It might take longer for IFN-γ levels to
decline to negativity after treatment [21]. However, in
high incidence countries where recurrent exposure is
widespread, IFN-γ responses may not disappear, even
with longer follow-up. Fifth, exposure to certain non-
tuberculous (environmental) mycobacteria (e.g. M. mari-
num) may play a role in inducing T cell responses, even
after clearance of the original M. tuberculosis infection
[39]. All of these hypotheses deserve further study, partic-
ularly in high incidence settings.
In conclusion, our preliminary study, although limited by
numbers, raises the interesting hypothesis that in an envi-
ronment with ongoing, intensive nosocomial exposure,
HCWs may have high IFN-γ responses at baseline, and
continue to have persistently elevated T cell responses,
despite LTBI treatment. It is possible, although unproven
as yet, that persistence of infection and/or re-infection
might account for this phenomenon, and raises concerns
about efficacy of conventional preventive therapy in high
incidence settings with recurrent exposure. Further
research is needed to study T cell kinetics during LTBI
treatment, and determine the effect of repeated exposures
on host cellular immune responses, particularly in high
incidence settings. The availability of standardized, com-
mercial T cell-based IGRAs might greatly facilitate such
novel investigations.
Abbreviations
BCG: bacille Calmette-Guerin
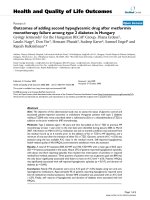
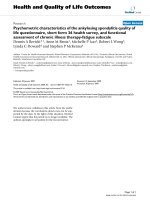
Pre-treatment and post-treatment interferon-γ responses in nursing students treated with isoniazid preventive therapy for 6 months (N = 10)Figure 1
Pre-treatment and post-treatment interferon-γ
responses in nursing students treated with isoniazid
preventive therapy for 6 months (N = 10). Baseline
interferon-γ (IFN-γ) levels were measured using the QuantiF-
ERON-TB Gold In Tube assay at the time of latent tubercu-
losis infection diagnosis (January/February 2004). The second
measurement was made in January 2005, 4 months after iso-
niazid (INH) preventive therapy completion. The third meas-
urement was made in July 2005, 10 months after INH
treatment completion. All subjects were positive by the
QuantiFERON-TB Gold In Tube assay and tuberculin skin
test at baseline. The QuantiFERON-TB Gold diagnostic cut-
point of 0.35 IU/mL is shown as a horizontal dotted line. IFN-
γ levels >10.0 IU/mL have been shown as 10 IU/mL
Journal of Occupational Medicine and Toxicology 2006, 1:7 />Page 6 of 7
(page number not for citation purposes)
CFP10: culture filtrate protein 10
ESAT-6: early secreted antigenic target 6
HCW: health care worker
IGRA: Interferon-γ release assay
IFN-γ: interferon-γ
INH: isoniazid
LTBI: latent tuberculosis infection
NTM: non-tuberculous mycobacteria
PPD: purified protein derivative
QFT-G: QuantiFERON-TB Gold
RD1: region of difference 1
TB: tuberculosis
TST: tuberculin skin test
Competing interests
The author(s) declare that they have no competing inter-
ests.
Authors' contributions
MP conceived and designed the study, raised funding sup-
port, participated in its supervision, performed the data
analyses and drafted the manuscript. RJ carried out the
field work and interviews, participated in the analysis and
helped revise the manuscript. SD assisted in carrying out
the immunoassays, and revised the manuscript. DK and
PN participated in the study design, provided technical
support, and supervision of the laboratory work. KD pro-
vided technical assistance with interpretation of immu-
nology data, and helped draft the manuscript. SK
conceived of the study, and participated in its design and
supervision, and helped to draft the manuscript. All
authors read and approved the final manuscript.
Acknowledgements
Supported in part by a training grant from the Fogarty AIDS International
Training Program (grant 1-D43-TW00003-17), University of California,
Berkeley. This funding source had no involvement in the design, execution,
review or approval of this manuscript. We thank the nursing students at
MGIMS hospital, Sevagram, for their participation; and Padmakar Dhone,
Santosh Chavhan, Prashant Raut, and Sandeep Taksande, for their contri-
butions to this project. We are grateful to Philip Hill (Medical Research
Council, The Gambia), and Robert Jasmer (University of California, San
Francisco) for their feedback on a draft of this manuscript.
References
1. Corbett EL, Watt CJ, Walker N, Maher D, Williams BG, Raviglione
MC, Dye C: The growing burden of tuberculosis: global trends
and interactions with the HIV epidemic. Arch Intern Med 2003,
163(9):1009-1021.
2. Dye C, Scheele S, Dolin P, Pathania V, Raviglione MC: Consensus
statement. Global burden of tuberculosis: estimated inci-
dence, prevalence, and mortality by country. WHO Global
Surveillance and Monitoring Project. JAMA 1999,
282(7):677-686.
3. World Health Organization: Global tuberculosis control. Sur-
veillance, planning, financing. WHO Report 2005. Geneva ,
World Health Organization; 2005:1-247.
4. Menzies RI: Tuberculin skin testing. In Tuberculosis: a comprehen-
sive international approach Edited by: Reichman LB, Hershfield ES. New
York , Marcel Dekker; 2000:279-322.
5. Huebner RE, Schein MF, Bass JBJ: The tuberculin skin test. Clin
Infect Dis 1993, 17(6):968-975.
6. Menzies D: What does tuberculin reactivity after bacille Cal-
mette-Guerin vaccination tell us? Clin Infect Dis 2000, 31 Suppl
3:S71-4.
7. Pai M, Riley LW, Colford JMJ: Interferon-gamma assays in the
immunodiagnosis of tuberculosis: a systematic review. Lancet
Infect Dis 2004, 4(12):761-776.
8. Dheda K, Udwadia ZF, Huggett JF, Johnson MA, Rook GA: Utility of
the antigen-specific interferon-gamma assay for the man-
agement of tuberculosis. Curr Opin Pulm Med 2005,
11(3):195-202.
9. Lalvani A: Spotting latent infection: the path to better tuber-
culosis control. Thorax 2003, 58(11):916-918.
10. Pai M, Kalantri S, Dheda K: New tools and emerging technolo-
gies for the diagnosis of tuberculosis: Part 1. Latent tubercu-
losis. Expert Rev Mol Diagn 2006, 6(3):413-422.
11. Andersen P, Munk ME, Pollock JM, Doherty TM: Specific immune-
based diagnosis of tuberculosis. Lancet 2000,
356(9235):1099-1104.
12. Mahairas GG, Sabo PJ, Hickey MJ, Singh DC, Stover CK: Molecular
analysis of genetic differences between Mycobacterium
bovis BCG and virulent M. bovis. J Bacteriol 1996,
178(5):1274-1282.
13. Mazurek GH, Jereb J, Lobue P, Iademarco MF, Metchock B, Vernon
A: Guidelines for using the QuantiFERON-TB Gold test for
detecting Mycobacterium tuberculosis infection, United
States. MMWR Recomm Rep 2005, 54(RR-15):49-55.
14. Rothel JS, Andersen P: Diagnosis of latent Mycobacterium
tuberculosis infection: is the demise of the Mantoux test
imminent? Expert Rev Anti Infect Ther 2005, 3(6):981-993.
15. Nahid P, Pai M, Hopewell PC: Advances in the diagnosis and
treatment of tuberculosis. Proc Am Thorac Soc 2006, 3:103-110.
16. National Institute for Health and Clinical Excellence: Clinical Guide-
line 33. Tuberculosis: clinical diagnosis and management of
tuberculosis, and measures for its prevention and control.
URL: />page.aspx?o=CG033NICEguideline. Volume 2006. London ,
NICE; 2006.
17. Pai M, Lewinsohn DM: Interferon-gamma assays for tuberculo-
sis: is anergy the Achilles' heel? Am J Respir Crit Care Med 2005,
172(5):519-521.
18. Pai M, Kalantri S, Menzies D: Discordance between tuberculin
skin test and interferon-gamma assays [letter]. Int J Tuberc
Lung Dis 2006 in press.
19. Godkin AJ, Thomas HC, Openshaw PJ: Evolution of epitope-spe-
cific memory CD4(+) T cells after clearance of hepatitis C
virus. J Immunol 2002, 169(4):2210-2214.
20. Lalvani A: Counting antigen-specific T cells: a new approach
for monitoring response to tuberculosis treatment? Clin Infect
Dis 2004, 38(5):757-759.
21. Higuchi K, Harada N, Mori T: Effect of prophylaxis on responses
for ESAT-6/CFP-10 in whole blood IFN-g test. Eur Respir J
2005, 26(Suppl 49):22S.
22. Wilkinson KA, Kon OM, Newton SM, Meintjes G, Davidson RN, Pas-
vol G, Wilkinson RJ: Effect of Treatment of Latent Tuberculo-
sis Infection on the T Cell Response to Mycobacterium
tuberculosis Antigens. J Infect Dis 2006, 193(3):354-359.
23. Pai M, Gokhale K, Joshi R, Dogra S, Kalantri SP, Mendiratta DK,
Narang P, Daley CL, Granich RM, Mazurek GH, Reingold AL, Riley
Publish with BioMed Central and every
scientist can read your work free of charge
"BioMed Central will be the most significant development for
disseminating the results of biomedical research in our lifetime."
Sir Paul Nurse, Cancer Research UK
Your research papers will be:
available free of charge to the entire biomedical community
peer reviewed and published immediately upon acceptance
cited in PubMed and archived on PubMed Central
yours — you keep the copyright
Submit your manuscript here:
/>BioMedcentral
Journal of Occupational Medicine and Toxicology 2006, 1:7 />Page 7 of 7
(page number not for citation purposes)
LW, Colford JMJ: Mycobacterium tuberculosis infection in
health care workers in rural India: comparison of a whole-
blood, interferon-g assay with tuberculin skin testing. JAMA
2005, 293:2746-2755.
24. Pai M, Joshi R, Dogra S, Mendiratta DK, Narang P, Kalantri SP, Rein-
gold AL, Colford JM, Riley LW, Menzies D: Serial testing of health
care workers for tuberculosis using interferon-g assay. In Am
J Respir Crit Care Med Volume May 11; [Epub ahead of print: http://
ajrccm.atsjournals.org/cgi/content/abstract/200604-472OCv1]. Chicago ;
2006.
25. Rao KG, Aggarwal AN, Behera D: Tuberculosis among physi-
cians in training. Int J Tuberc Lung Dis 2004, 8(11):1392-1394.
26. Rieder HL: Epidemiologic basis of tuberculosis control. Paris ,
International Union Against Tuberculosis and Lung Disease; 1999.
27. Chadha VK, Jagannatha PS, Vaidyanathan PS, Jagota P: PPD RT23 for
tuberculin surveys in India. Int J Tuberc Lung Dis 2003,
7(2):172-179.
28. Mori T, Sakatani M, Yamagishi F, Takashima T, Kawabe Y, Nagao K,
Shigeto E, Harada N, Mitarai S, Okada M, Suzuki K, Inoue Y, Tsuyu-
guchi K, Sasaki Y, Mazurek GH, Tsuyuguchi I: Specific detection of
tuberculosis infection: an interferon-gamma-based assay
using new antigens. Am J Respir Crit Care Med 2004, 170(1):59-64.
29. Brock I, Weldingh K, Lillebaek T, Follmann F, Andersen P: Compar-
ison of tuberculin skin test and new specific blood test in
tuberculosis contacts. Am J Respir Crit Care Med 2004,
170(1):65-69.
30. Dogra S, Narang P, Mendiratta DK, Chaturvedi P, Reingold AL, Col-
ford JMJ, Riley LW, Pai M: Comparison of a whole blood inter-
feron-gamma assay with tuberculin skin testing for the
detection of tuberculosis infection in hospitalized children in
rural India. J Infect 2006. [Epub ahead of print: ence-
direct.com/science/journal/01634453]
31. Chadha VK, Kumar P, Jagannatha PS, Vaidyanathan PS, Unnikrishnan
KP: Average annual risk of tuberculous infection in India. Int
J Tuberc Lung Dis 2005, 9(1):116-118.
32. American Thoracic Society: Targeted tuberculin testing and
treatment of latent tuberculosis infection. In Am J Respir Crit
Care Med Volume 161. Issue 4 Pt 2 American Thoracic Society &
Centers for Disease Control; 2000:S221-47.
33. Ferebee SH: Controlled chemoprophylaxis trials in tuberculo-
sis. A general review. Bibl Tuberc 1970, 26:28-106.
34. Houk VN, Kent DC, Sorensen K, Baker JH: The eradication of
tuberculosis infection by isoniazid chemoprophylaxis. Arch
Environ Health 1968, 16(1):46-50.
35. Daniel TM, Bowerfind ESJ: Reversion of recently acquired tuber-
culin reactivity during isoniazid prophylaxis. Am Rev Respir Dis
1967, 95(3):500-502.
36. Carrara S, Vincenti D, Petrosillo N, Amicosante M, Girardi E, Goletti
D: Use of a T cell-based assay for monitoring efficacy of
antituberculosis therapy. Clin Infect Dis 2004, 38(5):754-756.
37. Lalvani A, Nagvenkar P, Udwadia Z, Pathan AA, Wilkinson KA, Shastri
JS, Ewer K, Hill AV, Mehta A, Rodrigues C: Enumeration of T cells
specific for RD1-encoded antigens suggests a high preva-
lence of latent Mycobacterium tuberculosis infection in
healthy urban Indians. J Infect Dis 2001, 183(3):469-477.
38. Pathan AA, Wilkinson KA, Klenerman P, McShane H, Davidson RN,
Pasvol G, Hill AV, Lalvani A: Direct ex vivo analysis of antigen-
specific IFN-gamma-secreting CD4 T cells in Mycobacte-
rium tuberculosis-infected individuals: associations with clin-
ical disease state and effect of treatment. J Immunol 2001,
167(9):5217-5225.
39. Aiken AM, Hill PC, Fox A, McAdam KP, Jackson-Sillah DJ, Lugos MD,
Donkor SA, Adegbola RA, Brookes RH: Reversion of the ELIS-
POT test after treatment in Gambian tuberculosis cases.
BMC Infect Dis 2006, 6(1):66.
40. Santha T, Thomas A, Chandrasekaran V, Selvakumar N, Gopi PG,
Subramani R, Rajeswari R, Rani B, Paramasivan CN, Perumal M,
Wares F, Narayanan PR: Initial drug susceptibility profile of M.
tuberculosis among patients under TB programme in south
India. Int J Tuberc Lung Dis 2006, 10(1):52-57.