Artificial Neural Networks Industrial and Control Engineering Applications Part 2 doc
Bạn đang xem bản rút gọn của tài liệu. Xem và tải ngay bản đầy đủ của tài liệu tại đây (796.05 KB, 35 trang )
Artificial Neural Networks - Industrial and Control Engineering Applications
24
Study Area No Title Author Journal Year Vol(No),pp. Findings Limitations
fabric
development by
an engineered
approach of a
radial basis
function network
which was trained
with worsted
fabric
constructional
parameters
In few cases, the
network has
predicted
contradictory
trends, which are
found difficult to
be explained
20 An Artificial Neural
Network Model for
the Prediction of
Spirality of Fully
Relaxed Single Jersey
Fabrics
Murrells
et al.
Textile
Research
Journal
2009 79(3),
227-234.
the prediction of
the degree of
spirality of single
j
erse
y
fabrics
made from a total
of 66 fabric
samples produced
from three types
of 100% cotton
yarn samples
The neural
network model
outperformed the
multiple
regression model
in predicting the
angle of spirality
using data that
were not used to
train the network.
This indicates that
it is worthwhile
using the more
complex ANN
technique if a
large amount of
different types of
data are available
Review of Application of Artificial Neural Networks
in Textiles and Clothing Industriec over Last Decades
25
Study Area No
Title Author Journal Year Vol(No),pp. Findings Limitations
21 The Prediction of
Initial Load-extension
Behavior of Woven
Fabrics Using
Artificial Neural
Network
Hadizad
eh et al.
Textile
Research
Journal
2009 79(17),
1599-1609.
predicting initial
load-extension
behavior (Youn
g
’s
modulus) in the
warp and weft
directions of plain
weave and plain
weave derivative
fabrics
/
22 Application of an
Adaptive Neuro-fuzz
y
System for Prediction
of Initial Load
Extension Behavior of
Plain-woven Fabrics
Hadizad
eh et al.
Textile
Research
Journal
2010 80(10),
981-990.
predicting initial
load–extension
behavior of plain-
woven fabrics
based on an
adaptive neuro-
fuzzy inference
system (ANFIS)
/
3.3 Fabric
defect
23 Fabric Inspection
Based on Best Wavelet
Packet Bases
Hu and
Tsai
Textile
Research
Journal
2000
70(8),
662-670.
best wavelet
packet bases and
an artificial neural
network (ANN) to
inspect four kinds
of fabric defects
/
24 Classifying Web
Defects with a Back-
Propagation Neural
Network by Color
Image Processing
Shiau et
al.
Textile
Research
Journal
2000
70(7),
633-640.
a back-
propagation
neural network
topology to
automatically
recognize neps
and trash in a web
by color image
processing
Since neps and
trash in a web can
be recognized,
y
arn
quality not only
can be assessed but
also improved
using a reference
for adjusting
manufacturing
parameters
Artificial Neural Networks - Industrial and Control Engineering Applications
26
Study Area No Title Author Journal Year Vol(No),pp. Findings Limitations
25 Detecting Fabric
Defects with
Computer Vision and
Fuzzy Rule
Generation. Part II:
Defect Identification
by a Fuzzy Expert
System
Choi et
al.
Textile
Research
Journal
2001
71(7),
563-573.
a fabric defect
identif
y
in
g
s
y
stem
by using fuzzy
inference in
multicondi-tion
The CCD (charge
coupled device)
must be mounted,
despite the
scanner, because
of on-line
considerations.
Patterned
and complex
fabrics can be
inspected as well
as plain fabrics.
For further
research such as a
neuro-fuzzy
expert system can
identify actual
defect types like
reed marks,
mispicks, pilling,
finger marks, and
others.
26 Neural-Fuzzy
Classification for
Fabric Defects
Huang
and
Chen
Textile
Research
Journal
2001
71(3),
220-224.
an image
classification by a
neural-fuzzy
system for normal
fabrics and eight
kinds of fabric
defects
/
Review of Application of Artificial Neural Networks
in Textiles and Clothing Industriec over Last Decades
27
Study Area No
Title Author Journal Year Vol(No),pp. Findings Limitations
27 Computer Vision-
Aided Fabric
Inspection System for
On-Circular Knitting
Machine
Saeidi et
al.
Textile
Research
Journal
2005 75(6),
492-497.
a computer vision-
based fabric
inspection system
implemented on a
circular knitting
machine to inspect
the fabric
under
construction
Since this research
is limited by the
speed of the
knitting machine,
further studies are
required to
inspect the fabric
defects in higher
speed, circular
knitting machines.
28 Detection and
Classification of
Defects in Knitted
Fabric Structures
Shad
y
et
al.
Textile
Research
Journal
2006 76(4),
295-300.
for knitted fabric
defect detection
and classification
using image
analysis and
neural networks
/
29 Fabric Stitching
Inspection Using
Segmented Window
Technique and BP
Neural Network
Yuen et
al.
Textile
Research
Journal
2009
79(1),
24-35.
a novel method to
detect the fabric
defect
automaticall
y
with
a segmented
window technique
which was
presented to
segment an image
for a three layer
BP neural network
to classify fabric
stitching defects
Work is still
needed to be done
in two major
aspects: (1) the
applicability of
the developed
method in
studying other
manufacturing
defects needs to
be validated; and
(2) the current 2-
D-based
investigation
needs to be
Artificial Neural Networks - Industrial and Control Engineering Applications
28
Study Area No Title Author Journal Year Vol(No),pp. Findings Limitations
extended to three-
dimensional (3-D)
space for actual
manual
inspection.
3.4 Sewing 30 Selecting Optimal
Interlinings with a
Neural Network
Jeong et
al.
Textile
Research
Journal
2000 70(11),
1005-1010.
a neural network
and subjoined
local
approximation
technique for
application to the
sewing process by
selecting optimal
interlinings for
woolen fabrics
/
31 Application of
artificial neural
networks to the
prediction of sewing
performance of fabrics
Hui et
al.
Internatio
nal
Journal of
Clothing
Science
and
Technolo
gy
2007
19(5),
291-318.
to predict the
sewing
performance of
woven fabrics for
efficient planning
and control for the
sewing operation
based on the
physical and
mechanical
properties of
fabrics
/
Review of Application of Artificial Neural Networks
in Textiles and Clothing Industriec over Last Decades
29
Study Area No
Title Author Journal Year Vol(No),pp. Findings Limitations
3.5 Seam
performance
32 Predicting Seam
Performance of
Commercial Woven
Fabrics Using
Multiple Logarithm
Regression and
Artificial Neural
Networks
Hui and
Ng
Textile
Research
Journal
2009
79(18),
1649-1657.
the capability of
artificial neural
networks based on
a back
propagation
algorithm with
weight decay
technique and
multiple
logarithm
regression (MLR)
methods for
modeling seam
performance of
fifty commercial
woven fabrics
used for the
manufacture of
men’s and
women’s
outerwear
/
33 Predicting the Seam
Strength of Notched
Webbings for
Parachute Assemblies
Using the Taguchi's
Design of Experiment
and Artificial Neural
Networks
Onal et
al.
Textile
Research
Journal
2009 79(5),
468-478.
the effect of
factors on seam
strength of
webbings made
from polyamide
6.6
In these
comparisons,
RMSE values
were used as
comparative
metrics. As a
result, it can be
said that ANN
appears to be a
Artificial Neural Networks - Industrial and Control Engineering Applications
30
Study Area No Title Author Journal Year Vol(No),pp. Findings Limitations
reliable and useful
tool in
characterizing the
effect of some
critical
manufacturing
parameters on the
seam strength of
webbing, if a
sufficient number
of replicated
experimental data
are available to
train the ANN.
4. Applications
to Chemical
Processing
34 Fuzzy Neural
Network Approach to
Classifying Dyeing
Defects
Huang
and Yu
Textile
Research
Journal
2001 71(2),
100-104.
image processing
and fuzzy neural
network
approaches to
classify seven
kinds of dyeing
defects
Fuzzification
maps the input
feature value to
fuzzy sets and so
increases the
dimensions of the
feature space.
When
fuzzy sets are
appropriately
chosen, they can
increase the
separability of
classes in the
feature space. This
allows the fuzzy
neural network
Review of Application of Artificial Neural Networks
in Textiles and Clothing Industriec over Last Decades
31
Study Area No
Title Author Journal Year Vol(No),pp. Findings Limitations
model to fit input-
output data more
accurately with
enhanced
classification
ability.
5. Applications
to Clothing
5.1 Pattern
fitting
prediction
35 A Hybrid Neural
Network and Immune
Algorithm Approach
for Fit Garment
Design
Hu et al. Textile
Research
Journal
2009 79(14),
1319-1330.
to predict the fit of
the garments and
search optimal
sizes
For future
research
directions, the
dataset needs to
be enriched. The
current scale is
definitely not
enough to study
all
sizes of the
garment. In order
to present the
fuzzy and
stochastic nature
of the garment
and body sizes, it
should be
modeled as fuzzy
vector or
stochastic vector.
In addition, it is
valuable to
incorporate NN-
ICEA into
garment CAD
Artificial Neural Networks - Industrial and Control Engineering Applications
32
Study Area No Title Author Journal Year Vol(No),pp. Findings Limitations
system, thus the
2D and 3D effects
of garments can
provide intuitive
impressions
5.2 Clothing
sensory
comfort
36 Neural Network
Predictions of Human
Psychological
Perceptions of
Clothing Sensory
Comfort
Won
g
et
al.
Textile
Research
Journal
2003 73(1), 31-37. the predictability
of clothing
sensory comfort
from
psychological
perceptions by
using a feed-
forward back-
propagation
network in an
artificial neural
network (ANN)
system
The functions and
interrelationships
of individual
sensory
perceptions and
comfort are
unknown.
37 Predicting Clothing
Sensory Comfort with
Artificial Intelligence
Hybrid Models
Won
g
et
al.
Textile
Research
Journal
2004 74(1), 13-19. to develop an
intellectual
understanding of
and methodology
for predicting
clothing comfort
performance from
fabric
physical
properties
/
Review of Application of Artificial Neural Networks
in Textiles and Clothing Industriec over Last Decades
33
8. Reference
Admuthe, L.S. and Apte, S. Adaptive Neuro-fuzzy Inference System with Subtractive
Clustering: A Model to Predict Fiber and Yarn Relationship. Textile Research Journal,
2010, 80(9), 841-846.
Behera, B.K. and Goyal, Y. Artificial Neural Network System for the Design of Airbag
Fabrics. Journal of Industrial Textiles, 2009, 39(1), 45-55.
Behera, B.K. and Karthikeyan, B. Artificial Neural Network-embedded Expert System for
the Design of Canopy Fabrics. Journal of Industrial Textiles, 2006, 36(2), 111-123.
Behera, B.K. and Mishra, R. Artificial neural network-based prediction of aesthetic and
functional properties of worsted suiting fabrics. International Journal of Clothing
Science and Technology. 2007, 19(5), 259-276.
Beltran, R., Wang, L. and Wang, X. Predicting Worsted Spinning Performance with an
Artificial Neural Network Model. Textile Research Journal, 2004, 74(9), 757-763.
Chen, Y., Zhao, T. and Collier, B.J. Prediction of Fabric End-use Using a Neural Network
Technique. Journal of the Textile Institute, 2001, 92(2), 157-163.
Choi, H.T., Jeong, S.H., Kim, S.R., Jaung, J.Y. and Kim, S.H. Detecting Fabric Defects with
Computer Vision and Fuzzy Rule Generation. Part II: Defect Identification by a
Fuzzy Expert System. Textile Research Journal, 2001, 71(7), 563-573.
Durand, A., Devos, O., Ruckebusch, C. and Huvenne, J.P. Genetic algorithm optimisation
combined with partial least squares regression and mutual information variable
selection procedures in near-infrared quantitative analysis of cotton–viscose
textiles. Analytica Chimica Acta, 2007, 595(1-2), 72-79.
Ertugrul, S. and Ucar, N. Predicting Bursting Strength of Cotton Plain Knitted Fabrics Using
Intelligent Techniques. Textile Research Journal, 2000, 70(10), 845-851.
Farooq, A. and Cherif, C. Use of Artificial Neural Networks for Determining the Leveling
Action Point at the Auto-leveling Draw Frame. Textile Research Journal, 2008, 78(6),
502-509.
Hadizadeh, M., Jeddi, A.A.A., and Tehran, M.A. The Prediction of Initial Load-extension
Behavior of Woven Fabrics Using Artificial Neural Network. Textile Research
Journal, 2009, 79(17), 1599-1609.
Hadizadeh, M., Tehran, M.A. and Jeddi, A.A.A. Application of an Adaptive Neuro-fuzzy
System for Prediction of Initial Load Extension Behavior of Plain-woven Fabrics.
Textile Research Journal, 2010, 80(10), 981-990.
Huang, C.C. and Chen, I.C. Neural-Fuzzy Classification for Fabric Defects. Textile Research
Journal, 2001, 71(3), 220-224.
Huang, C.C. and Yu, W.H. Fuzzy Neural Network Approach to Classifying Dyeing Defects.
Textile Research Journal, 2001, 71(2), 100-104
Hui, C.L. and Ng, S.F. Predicting Seam Performance of Commercial Woven Fabrics Using
Multiple Logarithm Regression and Artificial Neural Networks. Textile Research
Journal, 2009, 79(18), 1649-1657.
Hui, C.L.P., Chan, C.C.K., Yeung, K.W. and Ng, S.F.F. Application of artificial neural
networks to the prediction of sewing performance of fabrics. International Journal of
Clothing Science and Technology. 2007, 19(5), 291-318.
Hu, M.C. and Tsai, I.S. Fabric Inspection Based on Best Wavelet Packet Bases. Textile
Research Journal, 2000, 70(8), 662-670.
Hu, Z.H., Ding, Y.S., Yu, X.K., Zhang, W.B. and Yan, Q. A Hybrid Neural Network and
Immune Algorithm Approach for Fit Garment Design. Textile Research Journal, 2009,
79(14), 1319-1330.
Artificial Neural Networks - Industrial and Control Engineering Applications
34
Jeong, S.H., Kim, J.H. and Hong, C.J. Selecting Optimal Interlinings with a Neural Network.
Textile Research Journal, 2000, 70(11), 1005-1010.
Kang, T.J. and Kim, S.C. Objective Evaluation of the Trash and Color of Raw Cotton by
Image Processing and Neural Network. Textile Research Journal, 2002, 72(9), 776-782.
Khan, Z., Lim, A.E.K., Wang, L., Wang, X. and Beltran, R. An Artificial Neural Network-
based Hairiness Prediction Model for Worsted Wool Yarns. Textile Research Journal,
2009, 79(8), 714-720.
Kuo, C.F.J., Hsiao, K.I. and Wu, Y.S. Using Neural Network Theory to Predict the Properties
of Melt Spun Fibers. Textile Research Journal, 2004, 74(9), 840-843.
Lin, J.J. Prediction of Yarn Shrinkage using Neural Nets. Textile Research Journal, 2007, 77(5),
336-342.
Murrells, C.M., Tao, X.M., Xu, B.G. and Cheng, K.P.S. An Artificial Neural Network Model
for the Prediction of Spirality of Fully Relaxed Single Jersey Fabrics. Textile Research
Journal, 2009, 79(3), 227-234.
Onal, L., Zeydan, M., Korkmaz, M. and Meeran, S. Predicting the Seam Strength of Notched
Webbings for Parachute Assemblies Using the Taguchi's Design of Experiment and
Artificial Neural Networks. Textile Research Journal, 2009, 79(5), 468-478.
Saeidi, R.G., Latifi, M., Najar, S.S. and Saeidi, A.G. Computer Vision-Aided Fabric
Inspection System for On-Circular Knitting Machine. Textile Research Journal, 2005,
75(6), 492-497.
Shady, E., Gowayed, Y., Abouiiana, M., Youssef, S. and Pastore, C. Detection and
Classification of Defects in Knitted Fabric Structures. Textile Research Journal, 2006,
76(4), 295-300.
She, F.H., Kong, L.X., Nahavandi, S. and Kouzani, A.Z. Intelligent Animal Fiber
Classification with Artificial Neural Networks. Textile Research Journal, 2002, 72(7),
594-600.
Shiau, Y.R., Tsai, I.S. and Lin, C.S. Classifying Web Defects with a Back-Propagation Neural
Network by Color Image Processing. Textile Research Journal, 2000, 70(7), 633-640.
Shyr, T.W., Lai, S.S. and Lin, J.Y. New Approaches to Establishing Translation Equations for
the Total Hand Value of Fabric. Textile Research Journal, 2004, 74(6), 528-534.
Ünal, P.G., Arikan, C., Özdil, N. and Taskin, C. The Effect of Fiber Properties on the
Characteristics of Spliced Yarns: Part II: Prediction of Retained Spliced Diameter.
Textile Research Journal, 2010, 0(0), 1-8.
Wong, A.S.W., Li, Y., Yeung, P.K.W. and Lee, P.W.H. Neural Network Predictions of
Human Psychological Perceptions of Clothing Sensory Comfort. Textile Research
Journal, 2003, 73(1), 31-37.
Wong, A.S.W., Li, Y., Yeung, P.K.W. Predicting Clothing Sensory Comfort with Artificial
Intelligence Hybrid Models. Textile Research Journal, 2004, 74(1), 13-19.
Xu, B., Dong, B. and Chen, Y. Neural Network Technique for Fiber Image Recognition.
Journal of Industrial Textiles, 2007, 36(4), 329-336.
Yao, G., Guo, J. and Zhou, Y. Predicting the Warp Breakage Rate in Weaving by Neural
Network Techniques. Textile Research Journal, 2005, 75(3), 274-278.
Yuen, C.W.M., Wong, W.K., Qian, S.Q., Fan, D.D., Chan, L.K. and Fung, E.H.K. Fabric
Stitching Inspection Using Segmented Window Technique and BP Neural
Network
. Textile Research Journal, 2009, 79(1), 24-35.
Zeng, Y.C., Wang, K.F. and Yu, C.W. Predicting the Tensile Properties of Air-Jet Spun Yarns.
Textile Research Journal, 2004, 74(8), 689-694.
2
Artificial Neural Network Prosperities
in Textile Applications
Mohammad Amani Tehran and Mahboubeh Maleki
Amirkabir university of Technology
Islamic Republic of IRAN
1. Introduction
Such as other fields, textile industry, deal with numerous large inputs and possible outputs
parameters and always feed with a complex interdependence between parameters, it is
highly unlikely that an exact mathematical model will ever be developed. Furthermore,
since there are many dependent and independent variables during different textile progress,
it becomes difficult to conduct and to cover the entire range of the parameters. Moreover,
the known and unknown variables cannot be interpolated and extrapolated in a reasonable
way based on experimental observations or mill measurements due to the shortage of
knowledge on the evaluation of the interaction and significance at weight contributing from
each variable. For example, it is quite difficult to develop some universal practical models
that can accurately predict yarn quality for different mills (Chattopadhyay & Guha, 2004).
Statistical models have also shown up their limitations in use—not least their sensitivity to
rogue data—and are rarely used in any branch of the textile industry as a decision-making
tool. The mechanistic models proposed by various authors overtly simplify the case to make
the equations manageable and pay the price with their limited accuracy. In any case, the
vast volume of process parameter- related data is hardly ever included in these models,
making them unsuitable for application in an industrial scenario.
By using neural networks, it seems to be possible to identify and classify different textile
properties (Guruprasad & Behera, 2010). Some of the studies reported in recent years on the
application of neural networks are discussed hereunder.
2. Fiber classification
The usual tests for fiber identification (usually chemical tests), in addition to being difficult
to perform, are almost always destructive in nature.
Leonard et al., 1998 had used Near-infrared (NIR) spectroscopy as input data to a neural
network to identify fibers in both original and normalised spectra. The performance of the
network was judged by computing the root mean square error of prediction (RMSEP) and
was compared with similar results given by multiple linear regressions (MLR).
Accurate classification of animal fibers used in the wool industry is very difficult. Some
techniques distinguish these fibers from patterns of their cuticular scales and others from
their physical and chemical properties. However, classification of animal fibers is actually a
typical task of pattern recognition and classification (Leonard et al., 1998). She et al., 2002
Artificial Neural Networks - Industrial and Control Engineering Applications
36
developed an intelligent fiber classification system to objectively identify and classify two
types of animal fibers, merino and mohair, by two different methods based on image
processing and artificial neural network. There are considerable variations in the shape and
contour of the scale cells and their arrangement within the cuticle. They used these two
systems based on how the scale features of the animal fibers were extracted. The data was
cast images of fibers captured by optical microscopy. Then they applied principal
component analysis (PCA) to reduce the dimension of input images and extract an optimal
linear feature before applying neural network. Furthermore neural network classifiers
generalize better when they have a small number of independent inputs. Finally they used
an unsupervised neural network in which the outputs used as inputs in the supervised
network (a multilayer perception with a back propagation algorithm) for classification while
the fiber classes were the outputs of the output layer. For the unsupervised network,
learning rate at 0.005 (step size) was set which linearly decayed to 0.0005 within the first 100
epochs and three different numbers of units in the hidden layer (80, 50, and 20) was used.
Multilayer perception used for fiber classification had a hyperbolic tangent activation
function in the processing elements of the hidden layer and output layer. They also
compared their two systems and concluded that neural network system was more robust
since only raw images were used and by developing more powerful learning strategies, the
classification accuracy of model would be improved (She et al., 2002).
There are some studies which have been introduced different design of neural network
classifier to categorize different type of fibers based on their colors too.
Raw cotton contains various kinds of trash, such as leaf, bark, and seed coat. The content of
each of these trash particles is vital for deciding upon the cleaning process (Xu et al., 1999).
For instance, the trash and color of raw cotton are very important and decisive factors in the
current cotton grading system that determine spinning quality and market value.
For many years, the USDA (United States Department of Agriculture) has used both a visual
grading method by trained classers and an instrumental method with HVI (High Volume
Instrument) systems to evaluate the color and trash of raw cotton. However it is expensive,
slow, and a time consuming process (Kang & Kim, 2002). Xu et al., 1999 used three
classification techniques (sum of squares, fuzzy, and neural network) into four groups (bark,
leaf, hairy seed coats, and smooth seed coat). They applied two hidden layer with four and
six neurons and their results showed that the neural network clustering method
outperformed the other used two methods (Xu et al., 1999).
Kang & Kim, 2002 developed an image system to characterize trash from a raw cotton image
captured by a color CCD camera and acquired color parameters. They trained and tested
neural network based on back propagation algorithm using color parameters as input data
from physical standard samples. A sigmoid function was used for an error back propagation
model and the number of input and output nodes was eight and seven respectively in
accordance with the color parameters and seven grades in the subcategories. The results
predicted by neural network were compared with the grades that classers judged (Kang &
Kim, 2002).
3. Yarn, fabric, nonwoven and cloth defect detection and categorization
In general, textile quality control is determined by measuring a large number of properties
(including mechanical and physical properties, and etc), which in many cases can only be
done by skilled workers or expensive equipments (Lien & Lee, 2002). Generally, In textile
Artificial Neural Network Prosperities in Textile Applications
37
industry, textiles are inspected manually for defects, but some problems arise in this visual
inspection, such as excessive time consumed, human subjective factors, stress on mind and
body, and fatigue. These problems further influence production volume and inspection
accuracy. Therefore, techniques that can replace manual inspection have emerged (Kuo &
Lee, 2003). In recent years, neural networks have been used to inspect yarn, fabric and cloth
defects and to identify their types (Kuo, 2003). Neural networks are among the best classifier
used for fault detection due to their non-parametric nature and ability to describe complex
decision regions.
A key issue in many neural network applications is to determine which of the available
input features should be used for modeling (Kumar, 2003). Mostly, researchers have used
different ways for feature selection based on image processing methods in conjunction with
neural network. An image acquisition setup that yields suitable images is crucial for a
reliable and accurate judgment. This system is usually including the specimen, the camera
or scanner and the illumination assembly (Bahlmann et al., 1999). Some studied have used
near sensor image processing (NSIP) technology as well. Most researchers had converted the
original color image to gray level image to improve the computer processing speed and
reducing the dimensions of information. However, Tilocca et al., 2002 presented a method to
fabric inspection based both on gray levels and 3D range profile data of the sample (Tilocca,
2002). Most studies usually have employed histogram equalization, noise reduction
operation by filtering, etc to improve visual appearance of the image (Jeon, 2003). When
they use image technology in conjunction with neural networks, some problems may occur;
For example recognizable rate of defect may be related to light source conditions (Kuo &
Lee, 2003). Since a fine feature selection can simplify problem identification by ranking the
feature and those features that do not affect the identification capability can be removed to
increase operation efficiency and decrease the cost of evaluation systems without losing
accuracy (Lien & Lee, 2002). So some studies have applied principal component analysis
(PCA) as pre processing methods to reduce the dimension of feature vectors (Kumar, 2003).
Usually, in ANN, the available data are divided into three groups. The first group is the
training set. The second group is the validation set, which is useful when the network begins
to over-fit the data so the error on the validation set typically begins to rise; during this time
the training is stopped for a specified number of iterations (max fails) and the weights and
biases at the minimum of the validation error are returned. The last group is the
performance test set, which is useful to plot the test set error during the training process
(Liu, 2001).
Data are further processed to extract specific features which are then transmitted to either
supervised or unsupervised neural network for identification and classification. This feature
extraction step is in accordance with textural structure, the difference in gray levels, the
shape and size of the defects and etc (Kuo et al., 2003) and it is necessary to improve the
performance of the neural network classifier (Tilocca, 2002). Consequently, a large amount
of study is usually related to this step to extract useful information from images and feed
them to neural network as input to recognize and categorize yarn, nonwoven, fabric, and
garment defects.
In supervised systems, the neural network can establish its own data base after it has
learned different defects with different properties. Most researchers have been used multi
layer feed forward back propagation Neural network since it is a nonlinear regressional
algorithm and can be used for learning and classifying distinct defects.
Artificial Neural Networks - Industrial and Control Engineering Applications
38
There are numerous publications on neural network applications addressing wide variety of
textile defects including yarn, fabric and garment defects. Some of the studies reported on
this application of neural networks are discussed hereunder.
3.1 Yarn defects
Sliver levelness is one of the critical factors when producing quality yarn products in
spinning processes. However, it is difficult to model the drafting process exactly since these
controls do not need to model the process and can handle very complicate processes, they
are useful. Moreover, they possess the ability to improve the intelligence of systems working
in an uncertain, imprecise, noisy environment. Therefore, Huang & Chang, 2001 developed
an auto leveling system with a drawing frame using fuzzy self-organizing and neural
network applied on a laboratory scale drawing frame with two drafting zones and two-
sliver doubling samples. They used a three layer neural network model to compute the
Jacobean matrix, which was needed in training the weights and thresholds on-line. A back
propagation learning algorithm was used to tune the connection weights and thresholds
and the unipolar sigmoid function as the activation function to compute the output of a
node. Levelness performance was evaluated by the CV% of sliver products in which their
results showed that neural network controller yielded more level slivers than the fuzzy self-
organizing controller. The neural network controller kept learning from the feedback of the
output linear density and generated the control action by the feed linear density and the
desired output linear density. The weight and thresholds of the neural network controller
were tuned on-line, leading to reduced variance in the output with respect to the desired
value (Huang & Chang, 2001).
It is well known that spinning process is a complex manufacturing system with the
uncertainty and the imprecision, in which raw materials, processing methodologies, and
equipments and so on all influence the yarn quality (Yin & Yu, 2007). Yarn physical
properties like strength, appearance, abrasion and bending are the most important
parameters, affecting on the quality and performance of end products and also cost of the
yarn to fabric process (Cheng & Lam, 2003).
Lien & Lee, 2002 reported feature selection for textile yarn grading to select the properties of
minimum standard deviation and maximum recognizable distance between clusters to achieve
effectiveness and reduce grading process costs. Yarn features were ranked according to
importance with the distance between clusters (EDC) which could be applied to either
supervised or unsupervised systems. However, they used a back propagation neural network
learning process, a mathematical method and a normal algebraic method to verify feature
selection and explained the observed results. A thirty sets data were selected containing
twenty data as training sets and the other ten data as testing sets. Each of these data were the
properties of single yarn strength, 100 meter weight, yarn evenness, blackboard neps, single
yarn breaking strength, and 100-meter weight tolerance (Lien & Lee, 2002).
A performance prediction of the spliced cotton yarns was estimated by Cheng & Lam, 2003
using a regression model and also a neural network model. Different spliced yarn properties
such as strength, bending, abrasion, and appearance were merged into a single score which
was then used to analyze the overall performance of the yarns by those two models. The
appearance of the spliced yarns was expressed as the retained yarn appearance (RYA)
which 5 was identical, 3 was acceptable and 1 was fail values. They used the transfer
functions of hyperbolic tangent sigmoid transfer function and linear transfer function.
Artificial Neural Network Prosperities in Textile Applications
39
According to their analytical results, the neural network model (R=0.98) gave a more
accurate prediction that the regression model (R=0.74) (Cheng & Lam, 2003).
It is well known that worsted spinning process is a complex manufacturing system and
there are many dependent and independent variables during spinning which becomes
difficult to conduct and cover the entire range of the parameters using mathematical and
empirical models. Yin & yu, 2007 firstly analyze all the variables collected from the mill
through grey superior analysis (GS) in order to select the important variables and as a result
better improve the yarn quality before ANNs model (multi-layer perceptron) was used by
adopting the back-propagation neural network (BP) to estimate the validity of the input
variables. In their research, they evaluated yarn qualities i.e. yarn unevenness, strength,
extension at break, and ends-down per 1000 spindle hours; by means of inputs including the
processing parameters such as fiber properties, spinning method, and process variables
influencing on the yarn properties and spinning performance. From the 77 sets of data, 69
lots were selected at random to serve as learning set and the residual eight sets data were
recorded as test sets. A one layer hidden layer was decided based on experiments by
achieving the highest coefficient using back propagation learning. The prediction accuracy,
A (%) and relative coefficient, R (%), between the predicted values and achieved values were
calculated in order to validate the approaches of the variables selection. The comparison of
the performance of ANNs model using grey superior analysis (GS), subjective and empirical
approach (SE), and multilinear regress method (MLR) showed that the model using the
input variables selected by GS was superior to that by SE and MLR. They also simulated the
spinning of the worsted yarn with the high coincidence using the processing data in the
mills based on the artificial neural networks and grey superior analysis (Yin & yu, 2007).
One of the important properties of yarns is unevenness. Mass or weight variation per unit
length of yarn is defined as unevenness or irregularity. It can adversely influence many of
the properties of textile materials such as tenacity, yarn faults, twist variation, abrasion,
pilling, soil retention, drape, absorbency, reflectance or luster. Unevenness in blended yarns
is depended mainly on the physical properties of fibers (fiber cross section deviation, length
and length uniformity etc.), number of fibers and fiber location or positioning in the yarn
cross section, blend ratio and working performance of the yarn spinning machine.
Therefore, Demiryurek & Koc, 2009 developed an artificial neural network and a statistical
model to predict the unevenness of polyester/viscose blended open-end rotor spun yarns.
They used a back propagation multi layer perceptron network and a mixture process
crossed regression model with two process variables (yarn count and rotor speed). They
selected blend ratio, yarn count and the rotor speed as input parameters and unevenness of
the yarns as output parameter. Sigmoid function was used as activation function, and
number of hidden layer was determined as 25, the learning rate and momentum were
optimized at 0.2 and 0.0 respectively in this study. They compared the result of both
presented model and it was concluded that both models had satisfactory and acceptable
results, however the correlation coefficient of neural network (0.98) was slightly greater than
statistical model (0.93) and the mean square errors (0.077) were identical. The mean absolute
percentage error was also calculated and was %1.58 and %0.73 for the ANN and statistical
model respectively. Contrary to general opinion of the more reliable prediction of ANN
than statistical models, they reported that statistical model developed was more reliable
than ANN and by increasing the number of experiments, prediction performance of ANN
would increase (Demiryurek & Koc, 2009).
Artificial Neural Networks - Industrial and Control Engineering Applications
40
2.2 Woven fabric defects
Image processing analyses in conjunction with neural networks have been widely used for
woven and knitted fabric defect detection and grading.
Karras et al., 1998 investigated a vision based system to detect textile defects from the
textural properties of their corresponding wavelet transformed images. They applied
supervised (multilayer perceptrons trained with the back propagation algorithm) and
unsupervised (Kohonen's self organizing feature maps) neural classification techniques by
exploiting information coming from textural analysis and SVD in the wavelet transformed
original images to provide second order information about pixel intensities and localize
important information respectively. They considered defect detection as the approximation
of the defect spatial probability distribution within the original image. The inputs to the
MLP and SOFM networks were the 24 features contain 1009 patterns of the feature vector
extracted from each sliding window. 280 out of the 1009 patterns belonged to the long and
thin defective area of the upper side, while the rest belonged to the class of non defective
areas. Reported classification accuracy was an overall 98.50% (Karras et al., 1998).
Tilocca et al., 2002 presented a direct method to fabric inspection based both on gray levels
and 3D range profile data of the sample. They used a smart vision sensor for image
acquisition system. The neural network was trained to classify three different categories
which were normal fabric, defect with a marked 3D component and defect with no 3D
component. A three layered feed forward neural network with sigmoid activation function
and back propagation learning algorithm by a fixed learning rate at 0.2. They extracted 1500
training patterns including nondefective region, defects with marked 3D characteristics, and
defects without 3D marks and another group of 500 patterns constituted the test sets. The
number of hidden neurons was adjusted by trial and error at 24. They obtained the
percentage of right, unknown, and wrong classifications for each class, both for the training
and test sets. Percentage of test clean patterns correctly classified was almost 92%, showing
that the ANN was able to identify and separate defective from nondefective regions. They
suggested using this system for on-line monitoring of fabric defects since no further
transformation of the data was needed before classification (Tilocca et al., 2002).
At present, fabric inspection still relies on the human eye, and the reliability and accuracy of
the results are based on inspectors. Wrinkles in cloth usually develop with deformation during
wearing, after washing and drying, and with folding during storage and it is not easy even for
trained observers to judge the wrinkles. Mori & Komiyama, 2002 used gray scale image
analysis of six kinds of plain fabrics to evaluate visual features of wrinkles in plain fabrics
made from cotton, linen, rayon, wool, silk, and polyester using neural network. The angular
second moment, contrast, correlation, and entropy were extracted from the gray level co-
occurrence matrix and fractal dimension from fractal analysis of the image as input and the
mean sensory value presenting the grade of wrinkled fabrics as output. The hidden units had
logistic function as transfer function. Eight sets of data were selected arbitrarily as training
data and the seven remaining data sets for testing the neural networks were used. They used a
training algorithm with Kalman filter to tune the network in order to maximize the accuracy of
the visual evaluation system. Sum of the square error (SSE) was used as total output error of
the network. Overtraining was occurred in the region of more than 200 learning cycles,
therefore they decided 150 learning cycles for checking or testing the network. They also
compared the accuracy of the evaluating system for wrinkled images captured by the digital
camera method with that for wrinkled images captured by the color scanner method and
observed better accuracy for the color scanner than digital camera (Mori & Komiyama, 2002).
Artificial Neural Network Prosperities in Textile Applications
41
Kuo & Lee, 2003 used a back-propagation neural network for recognizing woven fabric
defects. They used an image system (filtered and threshold images) to distinguished holes,
oil stains, wrap-lacking and weft-lacking defects. Maximum length, maximum width and
gray level of the defects were presented as the input units of the neural network. They used
a back propagation neural network by eight defect samples for off line training. The initial
learning rate was 0.1; keeping reducing to 0.01 and the momentum factor was 0.5. The error
mean square value converged to 0.05 after 45000 iterations. According to their test, the
recognizable rate of warp-lacking and weft-lacking was up to 95%, and up to 100% for holes
and oil stains (Kuo & Lee, 2003). Kuo et al., 2003 used an image system for dynamic
inspection of plain white fabrics using a linear scan digital camera with direct light to take
images. The corresponding fabric conveying speed was 50 cm/s. the back propagation
neural network of this research comprised an input layer with three input units (maximum
length of the defect, maximum width of defect, and gray level value of the defect), a hidden
layer, and an output layer by three output units. They reported average overall recognition
rates up to 90% (Kuo et al., 2003).
Segmentation of defects provides accurate distinguishing of size and location of defects.
Therefore, Kumar, 2003 investigated an approach to segment a variety of local textile (twill
and plain weave fabrics) defects using feed-forward neural network. Since every fabric
defect alters the gray-level arrangement of neighboring pixels, he extracted the feature
vector for every pixel of backlighting captured images and applied a pre-processing using
normalization of the feature vectors followed by principal component analysis (PCA) to
reduce the dimension of feature vectors. He also used post-processed operation (a 9*9
median filtering) to generate the required output values. Hyperbolic tangent sigmoid
activation function was chosen and the weights were updated using Levenberg-Marquardt
algorithm for faster convergence rate. The network was trained for the maximum of 1000
steps with the learning rate of 0.01 and the training was stopped if the maximum
performance gradient of 1e-10 was reached. Finally, a low-cost web inspection system based
on linear neural network with a single layer to evaluate real fabric samples was proposed
since the web inspection based on defect segmentation required additional DSP hardware,
which would increase the cost of the inspection system (Kumar, 2003).
Pilling may be defined as a surface fabric fault comprising of circular accumulations of
entangled fibers that cling to the fabric surface thereby affecting the appearance and handle
of the fabric. The pilling of fabrics is a serious problem for the apparel industry and in
particular wool knitwear fabrics. The formations of pills occur as a consequence of
mechanical action during washing or wear (Beltran et al., 2005). The development of pills on
a fabric surface, spoils the original appearance and hand, initiates garment attrition and
reduces serviceability. Therefore evaluating pilling degree (from grade 5 which means no
pilling to grade 1 which is very severe pilling) of fabric is important and usually it is
inspected visually. Because of the inconsistency and inaccuracy of rating results obtained
with the visual method, more reliable and objective methods for pilling evaluation are
desirable for the textile industry. Chen & Huang, 2004 evaluated and graded fabric pilling
based on light projection using image analysis and neural network to overcome the common
difficulty of interference with fabric pill information from fabric color and pattern. Firstly,
they eliminated interference with pilling information from fabric color and pattern. Their
method was included a device to acquire the projected cross-sectional images, detecting the
profile of projected images, segmenting pills appearing on converted gray images,
extracting of a pill's feature index, and finally assessing pilling grade by Kohonen self
Artificial Neural Networks - Industrial and Control Engineering Applications
42
organizing feature map neural network. There were ten input neurons corresponding to ten
feature indexes and five output nodes representing five cluster centers (five pilling grades)
by training twenty kinds of samples including colored and patterned pilled worsted fabrics.
The total number of iterations in the training process was 400, and the learning rate was
initialized to be 0.02.They concluded that the objective pilling grade was in good agreement
with the subjective pilling grade. The correlation coefficient for training and testing samples
were reported up to 0.94 and 1 respectively (Chen & Huang, 2004).
Beltran et al., 2005 also used artificial neural networks to model the multi-linear relationship
between fiber, yarn and fabric properties and their effect on the pilling propensity of pure
wool knitted fabrics. They used key fiber (diameter, CV, diameter > 30 μm and curvature),
top (Hauteur, CV, short fiber <30mm, bundle strength and strain), yarn (count, hairiness,
thin and thick places, twist factor, folding twist ratio) and fabric properties (cover factor) as
quantitative inputs (normalized data) along with their corresponding pilling intensities in
an ANN to predict the pilling performance of knitted wool fabrics. The corresponding mean
pill rating was served as the target output. 105 sets of randomized data were assigned to
training, 20 sets were assigned for cross validation and 10 data sets were selected for testing
the network. The network consisted of a single hidden layer multi layer perception trained
with the error back propagation algorithm possessing hyperbolic tanh activation function in
both the hidden and output layers (Beltran et al., 2005).
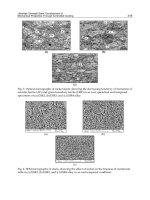
Zhang et al., 2010 investigated an approach for fabric defect classification using radial basis
function (RBF) network improved by Gaussian mixture model (GMM). First, the gray level
arrangement in the neighborhood of each pixel was extracted as the feature. This raw
feature was subject to principal component analysis (PCA) which adopted the between class
scatter matrix as the generation matrix to eliminate the variance within the same class.
Second, the RBF network with Gaussian kernel was used as the classifier because of the
nonlinear discrimination ability and support for multi-output. To train the classifier, GMM
was introduced to cluster the feature set and precisely estimate the parameter in Gaussian
RBF, in which each cluster strictly conforms to a multi-variance Gaussian distribution. Thus
the parameter of each kernel function in RBF network could be acquired from a
corresponding cluster. The proposed algorithm was experimented on fabric defect images
with nine classes (mould, miss weft, damaged, double pick, cloud pick, coarse end, color
smear, broken edge, and filling end) and achieved superior performance. Fabric images
were collected under the back-lighting condition with the cloth moving speed of 100
m/min. in the training process, 30 images of each class were processed and repeated 5
times. They also compared the performance of three classifiers including ANN (9-16-10 feed
forward structure using back propagation algorithm), SVM (Support Vector Machine which
can automatically determine support vectors from the sample set which is normalized and
preprocessed by PCA using Gaussian function as kernel), and RBF network on fabric defect
classification. These schemes were evaluated on the same nine classes of fabric defect
images. The training and test process was repeated five times to get an average
performance. The result was measured by correct classification rate (CCR) which was
defined as the number of correctly classified images divided by the number of total images.
They found that ANN had the worst performance with an average CCR of 74% while the
performance of RBF network was the best with CCR of 83.2% and the performance of SVM
was sensitive to the parameters. Therefore, they reported that RBF network was an
appropriate choice for the real time fabric defect classification. It has to be noted that this
work was the first time that the RBF network was applied in fabric defect classification
Artificial Neural Network Prosperities in Textile Applications
43
which achieved excellent performance in combination with GMM in comparison with
classical feed forward network (Zhang et al., 2010).
2.3 Knitted fabric defects
The apparent quality of knitted fabrics can be divided into two categories. First, the fabrics
with a large number of area faults that were occurring in the knitting process and eventually
make them useless. In the second category, there are inputted faults that originate from yarn
faults and the apparent quality of yarn is directly related to the configuration of fibers on its
surface (Liu et al., 2001). Different studies have been reported and identified both problems
simultaneously or separately.
Detecting and classifying knitted fabric defects using image analysis and neural network
were performed by Shady et al., 2006. They utilized two approaches including statistical
procedures and fourier transforms to extract image features for six different knitted fabric
defects using a defect free fabric as a control sample. All images were processed using
histogram equalization and then converted to grayscale images. The feature vectors were
used as input vectors to the network and six types of defects including broken needle, fly,
hole, barre, thick yarn and thin yarn were identified and classified. Two neural networks
were trained and tested for each feature extraction approach. The first one contained seven
neurons in the input layer representing the seven features of the statistical approach, and
seven neurons in the output layer representing the sic different defects and the free defect
sample. This network was successful only in classifying broken needle, hole, thick and thin
yarn defects. In the second neural network, six neurons were used in the input layer
representing the features and seven neurons in the output layer representing the six defects
and the free defect sample. The worst results were observed for the barre defects. In their
work, the neural network was trained by the learning vector quantization (LVQ) algorithm
to detect and classify the knitted fabric defects. Their results showed success in classifying
most of the defects excluding barre defects (Shady et al., 2006).
Fabric spirality is a problem which affects the esthetics and quality of knitted fabrics. This
problem is complex and there is a large amount of data required to establish quantitative
relationship to model this phenomenon accurately. an artificial neural network model was
proposed by Murrells et al., 2009 for the prediction of the degree of spirality of single jersey
fabrics made from 100% cotton conventional and modified ring spun yarns from a number
of factors considered to have the potential to influence fabric spirality after wash and dry
relaxation such as twist liveliness, yarn type, yarn linear density, fabric tightness factor, the
number of feeders, rotational direction, gauge of knitting machine and dyeing method. They
compared ANN model (R=0.976) with a multiple regression model (R=0.970) and concluded
that ANN model produced superior results to predict the degree of fabric spirality after
three washing and drying cycles. The hyperbolic tangent sigmoid transfer function was
assigned as the activation function in the hidden layer and the linear function was used in
the output layer. During the process, 60%, 20%, and remaining 20% of the original data were
set aside for training, validation, and testing respectively. They also investigated the relative
importance of the investigated factors influencing the spirality of the fabric and tried
various network structures with one hidden layer and finally demonstrated that multilayer
feed forward network based on Levenberg-Marquardt learning algorithm had better results.
Furthermore, both the ANN and the regression approach showed that twist liveliness,
tightness factor, and yarn linear density were the most important factors in predicting fabric
spirality (Murrells et al., 2009).
Artificial Neural Networks - Industrial and Control Engineering Applications
44
Semnani & Vadood, 2009 applied the artificial neural network (ANN) to predict the
apparent quality of weft knitted fabrics. They considered, only the appearance of the safe
knitted fabric without any knitting faults, tightened fibers with uniform configuration, big
faults with less area, non-uniform and extended faults with spread configuration, and small
spread faults such as non-uniform coating fibers and short tangled hairs had been
considered (Semnani & Vadood, 2009).
There are some variables in the applied neural network where their variation affects on the
obtained results are significant. These variables include the number of hidden layers, the
number of neurons in hidden layers, the value of max fail and the percentage of validation
and testing data.
Therefore, Semnani & Vadood, 2009 applied genetic algorithm in their research because of
its intuitiveness, ease of implementation and the ability to effectively solve highly nonlinear,
mixed integer optimization problems. Their results showed that the ANN could be
optimized very well by the genetic algorithm method and the designed ANN was very
accurate and applicable to predict the apparent parameters. Their optimized ANN was
formed from two hidden layers, in which the first hidden layer had 8 and the second layer
had 7 neurons, one neuron for output layer, five epochs for max fail, 20% available data for
test and 10% of available data for validation (Semnani & Vadood, 2009).
2.4 Nonwoven defects
Liu et al., 2010 proposed an algorithm based on wavelet transform (feature extraction
procedure) and learning vector quantization (LVQ) neural network for nonwoven
uniformity identification and grading. Six hundred and twenty-five nonwoven images of
five different grades, 125 images of each grade, were decomposed at four different levels
with five wavelet bases of Daubechies family, and two kinds of energy values L
1
and L
2
extracted from the high frequency subbands were used as the input features of the LVQ
neural network solely and jointly. The network outputs were class labels, which were
defined with five integer numbers, from 1 to 5, denoting five different uniformity grades.
The number of neurons in hidden layer, training epochs and goal, of the LVQ neural
network were as 5, 200 and 0.01 respectively. They used the identification accuracy of each
grade and average identification accuracy (AIA%) of five grades as performance parameters.
Their results were expressed and compared five wavelet bases (db
2
, db
4
, db
6
, db
8
, and db
10
)
and even different features (L
1
, L
2
, and L
1
UL
2
) at the four levels (level 1 to 4). They noted
three points as Firstly, with the same feature set and decomposition level, the length of the
filter had little effect in performance in all methods. Secondly, with the same feature set and
wavelet base, the decomposition level had a significant effect in the performance in all
methods. Thirdly, the highest identification accuracy was gotten at the crossing point db
4
or
db
6
and level 3 (Liu et al., 2010).
Liu et al., 2010 presented a method to recognize the visual quality of nonwoven by
combining wavelet texture analysis, Bayesian neural network and outlier detection. Each
nonwoven image was decomposed with orthogonal wavelet bases at four levels and two
textural features, norm-1 and norm-2, which were used as the input of Bayesian neural
network for training and test. To detect the outlier in the training set, the scaled outlier
probability was introduced to increase its robustness. All nonwoven samples were classified
into five grades according to visual qualities (such as surface uniformity, the condition of
pilling, wrinkles and defects). Each image was individually normalized to zero mean and
Artificial Neural Network Prosperities in Textile Applications
45
unit variance before wavelet transform. They reported with the increase of decomposition
level, the average classification error and cross entropy of training and test set decreased
sharply and the recognition accuracy of the five grades was also affected (Liu et al., 2010).
2.5 Cloth defects
Quality inspection of garments is an important aspect of clothing manufacturing. For many
textile products, a major quality control requirement is judging seam quality visually by
human experts. Presently, this is still accomplished by human experts, which is very time
consuming and suffers from variability due to human subjectivity. Consequently,
investigations about automated seam quality classification and an implementation of an
automated seam classificator are highly desirable. Bahlmann et al., 1999 presented a method
for automated quality control of textile seams by a scale of five grades (from grade 5 which
was best to grade 1 which was worst). Their system was consisting of an image acquisition
setup (to record seams structures), an algorithm for locating the seam (transforming acquired
seam images to normalize position), a feature extraction stage (based on fourier coefficients of
one dimensional image columns) and a neural network of the self organizing map type
(SOFM) for feature classification. The classification results were documented by three aspects
including the classification confusion matrix, the inspection of the NMSE (normalized mean
square error), and an investigation of the resulting Kohonen map. The classification rate
amounted to 80% correct classifications, the rest differed from the correct grade by one and
their results were not worse than the human exports error (Bahlmann et al., 1999).
Because of the special property of the knitted fabric which is very easy to be pleated,
puckered or distorted in stitching, automatic inspection of stitching is necessary. Yuen et al.,
2009 proposed a hybrid model (integration of genetic algorithm and neural network) to
classify garment defects. Firstly, to process the garment sample images captured by digital
camera, they used a morphological filter and a method based on genetic algorithms to find
out an optimal structuring element. They also presented a segmented window technique to
segment images into pixel blocks under three classes using monochrome single-loop
ribwork of knitted garments caused by stitching (seams without swing defects, seams with
pleated defects and seams with puckering defects). Four characteristic variables (size of the
seams and defective regions, average intensity value, standard deviation and entropy value)
were collected to describe the segmented regions and input into back propagation neural
network to provide decision support in defect classification. The number of the nodes was
set as 10 by many experiments. The training function of the neural network was a gradient-
descending method based on momentum and an adaptive learning rate. The learning
function of connection weights and threshold values was a momentum-learning method
based on gradient descending. Twenty two images of each class were used as training
samples and the other ten images were testing samples. They did not report any
misclassified sample and the identification rate was 100% (Yuen et al., 2009).
3. Yarn and fabric properties prediction and modeling
The main objective of many scientific studies in textile is to reveal the complex functional
relationships that exist between structural parameters of fiber, yarn and fabric properties. If
the relationships between different parameters that determine the specific yarn or fabric
property are known, they can be used to optimize that particular property for different end-
use applications so as to minimize the cost. Predictive modeling methodologies, which are
Artificial Neural Networks - Industrial and Control Engineering Applications
46
complex and inherently nonlinear, can be used to identify the different levels of
combinations of process parameters and material variables that yield the desired fabric
property. Since the network can accurately capture the nonlinear relationships between
input and output parameters, they have extremely good predictive power (Behera &
Muttagi, 2005). The use of an artificial neural network model as an analytical tool may
facilitate material specification/selection and improved processing parameters governed by
the predicted outcomes of the model (Khan et al., 2002).
An ANN model adjusts itself to establish the relation between the input and the output. In
spite to this, an ANN model does not require any explicit formula but instead it is an
implicit model by itself where it can be trained to adopt and adjust itself to perform certain
tasks (Nirmal, 2010).
3.1 Mechanical behavior prediction of textiles
Breaking elongation properties of yarns influence the performance of them during winding,
warping, and weaving. Yarn elongation like other yarn properties is chiefly influenced by
fiber properties, yarn twist, and yarn count. Because there is a strong correlation between
yarn elongation and loom efficiency, it would be very helpful if a prediction model could
forecast yarn elongation accurately (Majumdar & Majumdar, 2002). Furthermore, breaking
strength of yarn is the one of the most important physical property of yarn as it is the main
parameter for physical quality control. It takes a long time for the yarn producer to get the
experimental results for the physical properties of yarn. Therefore, faster determination of
yarn physical properties is needed (Dayik, 2009). Generally, modeling and prediction of
yarn properties based on fiber properties and process parameters have been considered by
many researchers such as mechanistic models, statistical regression models (Gharehaghaji et
al., 2007). In recent years, artificial neural network models have been widely used to predict
different kind of yarn and fabric mechanical properties based on process parameters and
fiber and yarn parameters. Among the various kinds of learning algorithms for the neural
network, back propagation is the most widely used.
Majumdar & Majumdar, 2004 predicted the breaking elongation of ring cotton yarns by
three modeling methodologies including mathematical, statistical and artificial network by
back propagation learning algorithm. 72 and 15 samples, respectively, were used for
training and testing the three prediction models. They tried five different network
structures with one hidden layer by different number of neurons (6, 8, 10, 12, and 14) in the
hidden layer. Learning rate and momentum were optimized at 0.1 and 0.0, respectively. The
neural network with ten nodes in the hidden layer had the best prediction results in the
testing sets after 2500 iterations. Inputs to these models were constituent cotton fiber
properties (fiber bundle tenacity, elongation, upper half mean length, uniformity index,
micronaire, reflectance degree, and yellowness) measured by high-volume instruments
(HVI) along with yarn count (Ne). They used statistical parameters such as the correlation
coefficient (R) between the actual and predicted breaking elongation, mean squared error,
mean absolute error (%), cases with more than 10% error, maximum error (%), and
minimum error (%) to judge the predictive power of various models and concluded that
neural network model had showed the best prediction results. The correlation coefficient
between actual and predicted elongation was R=0.938 for the ANN model, R=0.731 for the
mathematical model and R=0.870 for the statistical model. Percent of maximum error was
also reported for ANN, mathematical and statistical models which were 13.23%, 34.04%, and
15.60% respectively. The only output of each prediction model was the breaking elongation
Artificial Neural Network Prosperities in Textile Applications
47
of yarns. They also measured the relative importance of various cotton fiber properties
using neural network model (Majumdar & Majumdar, 2004).
Behera & Muttagi, 2005 compared the ability of three modeling methodologies based on
mathematical, empirical and artificial neural network based on radial basis function (RBF)
(using orthogonal least square learning procedure) to predict fabric properties. The inputs to
the network were fabric constructional parameter, yarn bending rigidities and outputs were
fabric initial tensile moduli. Before feeding to network, the input-output data set was scaled
down to be within (0, 1), by dividing each value by the maximum value of the overall data.
Data were randomly divided into 14 sets and 4 sets of input-output pairs for training and
testing the network respectively. They also studied the effect of network design parameters
on error of prediction. The effects of neurons number of the hidden layer, error goal, and
bias constant on prediction performance of RBF network were assessed. They observed that
ANN model produced the lease error as well as minimum range of error as compared to the
other modeling methods and ANN required a much smaller data set than the one required
for conventional regression analysis. For example, percentage prediction error for warp and
weft way fabric tensile modulus were respectively 10.2% and 8.63% for ANN, 20.4% and
12.33% for empirical model and 20.53% and 13.65% for mathematical model. They also
predicted bending rigidity of woven fabric by these three models and ANN had a better and
accurate result than those two models (Behera & Muttagi, 2005).
Gharehaghaji et al., 2007 investigated tensile properties modeling of cotton-covered nylon
core yarns by artificial neural networks based on back propagation algorithm and multiple
linear regression methods which the first method had better performance than the second.
They predicted breaking strength and breaking elongation simultaneously as output and by
using count of core part, count of sheath part, twist factor of core-spun yarn and pretension
as input. In order to eliminate the effect units of input and output parameters, data
normalizing was carried out. The data set of 54 samples was divided randomly into 5
subsets, each containing 10 or 11 samples, to train and test the network five times by using
four sets as training set and one subset as testing set. Overfitting was prevented by using
weight decay technique. The adaptive learning rate with momentum training algorithm
(optimized at 0.9) was used to enhance the training performance. They determined the
number of hidden neurons and the number of hidden layers by trial and error by using 20
topologies with different number of hidden layers and numbers. Their results showed a two
hidden layers by eight nodes into first hidden layer and six nodes into second hidden layer
gave the best topology. They assessed their models using verifying mean square error (MSE)
and correlation coefficient (R-value). The difference between the MSE value of two models
for predicting breaking elongation and breaking strength of testing data were 0.119 and
0.365 respectively (Gharehaghaji et al., 2007).
Dayik, 2009 determined the breaking strength of 100% cotton yarn properties by using Gene
expression programming, neural network and classical statistical approach (multiple
regression algorithms) and compared the predictive power of them by correlation coefficient
(R-square) and mean square error (MSE). The inputs were included foreign matter,
micronaire, uniformity, elongation, strength of fiber, length of fiber, short fiber index and
neps which were collected for a three month period data. He used seven different neural
network architectures which were including multilayer perception, Generalized feed
forward, Modular network, Jordan/Elman, Self organizing map, Principal component and
Recurrent network to identify the best one. However the best results were obtained from the
generalized feed forward neural network algorithms. He examined the predictive power by
Artificial Neural Networks - Industrial and Control Engineering Applications
48
multiple linear regression analysis. The statistical method showed very much worse
performance than genetic and neural network since physical properties of yarn depends on
many various factors and the relations between these factors are highly nonlinear and
complex. Performance of genetic model (98.88%) was better than artificial neural network
(94.00%) in his research (Dayik, 2009).
The effects of splicing parameters, fiber and yarn properties on the tenacity and elongation
of spliced yarns were investigated by Unal et al., 2010 using artificial neural network (ANN)
and response surface model (RSM). In the ANN analysis, a multilayer feed-forward network
with one hidden layer trained by back propagation algorithm was used. In the first phase,
the back propagation algorithm was applied for 100 epochs. The optimum learning rate of
0.01 and momentum coefficient of 0.3 used in back propagation was determined in terms of
several trials. In the second phase of training, 500 epochs were performed for conjugate
gradient descent algorithm. As activation functions, a hyperbolic function was used in the
hidden layer and linear functions were used in the input and output layers. Of the 89 yarn
samples, 76 samples were chosen as the training set at random, while 22 samples (25%) were
chosen for the testing set.
They produced yarns from eight different cotton types, having three different counts and
three different twist coefficients. Six parameters including fiber length, fiber diameter, yarn
count, yarn twist, opening air pressure and splicing air pressure in the input layer were
selected and a neural network with seven hidden neurons for yarn tenacity analysis and
another neural network with six parameters including fiber length, short fiber content, yarn
count, yarn twist, opening air pressure and splicing air pressure in the input layer and six
hidden neurons for breaking elongation were determined as well. The results of the ANN
analysis were similar to the results of RSM except for the effect of splicing air pressure and
ANN showed more powerful results in comparison RSM model since it is more capable of
explaining non-linear relations (Unal et al., 2010).
ANN appears to be a reliable and useful tool in characterizing the effect of some critical
manufacturing parameters on the seam strength of webbing, if a sufficient number of
replicated experimental data are available to train the ANN. Onal et al., 2009 studied the
effect of fabric width, folding length of joint, seam design and seam type on seam strength of
notched webbings for the parachute assemblies using both Taguchi's design of experiment
(TDOE) and an artificial neural network (ANN) and then compared them with strength
physically obtained from mechanical tests on notched webbing specimens. They used a four
layer, feed forward, back propagation ANN model with a five hidden layer neurons and
one output neuron to output seam strength. Input variables were fabric width, folding
length of joint, seam design and seam type. 60 training patterns and 10 testing patterns were
used to train and test the network. It was established from these comparisons, in which the
root mean square error was used as an accuracy measure, that the predictions by ANN were
better in accuracy than those predicted by TDOE (Onal et al., 2009).
Hadizadeh et al., 2009 presented an ANN model for predicting initial load-extension
behavior of plain weave and plain weave derivative fabrics. They developed a single hidden
layer feed forward ANN based on a back propagation algorithm with four input neurons
(using a combination of parameters of Leaf's equation instead of individual parameters) and
one output neuron to predict initial modulus in both warp and weft directions. In their
research, the input and measured values were normalized so that they would have zero
mean and unity standard deviation and they used Levenberg-Marquardt learning
algorithm. Five different cases of ANN with different number of neurons in hidden layer