báo cáo hóa học:" Site-specific analysis of gene expression in early osteoarthritis using the Pond-Nuki model in dogs" pot
Bạn đang xem bản rút gọn của tài liệu. Xem và tải ngay bản đầy đủ của tài liệu tại đây (440.09 KB, 12 trang )
BioMed Central
Page 1 of 12
(page number not for citation purposes)
Journal of Orthopaedic Surgery and
Research
Open Access
Research article
Site-specific analysis of gene expression in early osteoarthritis using
the Pond-Nuki model in dogs
Aaron M Stoker*
1
, James L Cook
1
, Keiichi Kuroki
2
and Derek B Fox
1
Address:
1
The Comparative Orthopaedic Laboratory, University of Missouri Columbia, 379 E Campus Dr, Columbia, MO, USA and
2
Kansas State
University Veterinary Diagnostic Laboratory, Kansas State University, 1800 Denison Avenue, Manhattan, KS, USA
Email: Aaron M Stoker* - ; James L Cook - ; Keiichi Kuroki - ;
Derek B Fox -
* Corresponding author
Abstract
Background: Osteoarthritis (OA) is a progressive and debilitating disease that often develops
from a focal lesion and may take years to clinically manifest to a complete loss of joint structure
and function. Currently, there is not a cure for OA, but early diagnosis and initiation of treatment
may dramatically improve the prognosis and quality of life for affected individuals. This study was
designed to determine the feasibility of analyzing changes in gene expression of articular cartilage
using the Pond-Nuki model two weeks after ACL-transection in dogs, and to characterize the
changes observed at this time point.
Methods: The ACL of four dogs was completely transected arthroscopically, and the contralateral
limb was used as the non-operated control. After two weeks the dogs were euthanatized and
tissues harvested from the tibial plateau and femoral condyles of both limbs. Two dogs were used
for histologic analysis and Mankin scoring. From the other two dogs the surface of the femoral
condyle and tibial plateau were divided into four regions each, and tissues were harvested from
each region for biochemical (GAG and HP) and gene expression analysis. Significant changes in gene
expression were determined using REST-XL, and Mann-Whitney rank sum test was used to analyze
biochemical data. Significance was set at (p < 0.05).
Results: Significant differences were not observed between ACL-X and control limbs for Mankin
scores or GAG and HP tissue content. Further, damage to the tissue was not observed grossly by
India ink staining. However, significant changes in gene expression were observed between ACL-X
and control tissues from each region analyzed, and indicate that a unique regional gene expression
profile for impending ACL-X induced joint pathology may be identified in future studies.
Conclusion: The data obtained from this study lend credence to the research approach and model
for the characterization of OA, and the identification and validation of future diagnostic modalities.
Further, the changes observed in this study may reflect the earliest changes in AC reported during
the development of OA, and may signify pathologic changes within a stage of disease that is
potentially reversible.
Published: 10 October 2006
Journal of Orthopaedic Surgery and Research 2006, 1:8 doi:10.1186/1749-799X-1-8
Received: 16 March 2006
Accepted: 10 October 2006
This article is available from: />© 2006 Stoker et al; licensee BioMed Central Ltd.
This is an Open Access article distributed under the terms of the Creative Commons Attribution License ( />),
which permits unrestricted use, distribution, and reproduction in any medium, provided the original work is properly cited.
Journal of Orthopaedic Surgery and Research 2006, 1:8 />Page 2 of 12
(page number not for citation purposes)
Background
Osteoarthritis (OA) is a progressive and debilitating dis-
ease that may take years to clinically manifest in affected
individuals [1,2]. OA often progresses from a focal loss of
articular cartilage integrity to a complete loss of joint
structure and function. Currently, there is not a cure for
OA, and available treatments only slow the progression of
disease. Early diagnosis with initiation of treatment may
dramatically improve the prognosis and quality of life for
affected individuals [3-5]. Radiographic evaluation and
advanced imaging modalities such as computed tomogra-
phy and standard magnetic resonance imaging can be
helpful in determining extent and severity of the disease
process[6-9]. However, no imaging techniques currently
provide definitive data for early diagnosis, accurate mon-
itoring of response or progression, or prognostication in
OA. Other techniques for early, more sensitive diagnoses
are being developed, including serum and synovial fluid
biomarkers, biomechanical testing of articular cartilage
tissue, and optical coherence tomography[10-12]. How-
ever, none provides data for definitive diagnosis of OA
prior to irreversible pathology. Further, the earliest stages
of OA are poorly characterized and methods for determin-
ing a definitive diagnosis of OA in potentially reversible
stages of disease are not currently available to the authors'
knowledge.
It is clear that during the development of OA, cartilage tis-
sue metabolism shifts from extracellular matrix (ECM)
homeostasis to degradation. Further, once articular carti-
lage (AC) is irreversibly damaged, as in OA, regenerative
healing does not occur and function is impaired[13,14].
The ECM of normal articular cartilage can remodel in
response to applied load, and matrix molecules are
degraded and replaced during the process of physiologic
ECM turnover. Therefore, it appears that AC does have
some capacity to repair damage to the ECM. What is not
known is at what point the degree of damage to the ECM
is beyond the capabilities of tissue repair mechanisms.
Further, and perhaps more importantly, methods for diag-
nosing the point at which recovery is no longer possible
are not known.
Two potential factors that may influence the "point of no
return" in the progression of OA are chondrocyte viability
and phenotype. During the development of OA, there is
often a focal increase in cell death[15-18]. Since it is theo-
rized that each chondrocyte is responsible for the mainte-
nance of the ECM surrounding it, and that matrix
molecules produced in one region of the tissue have a very
limited ability to traverse the tissue, the focal loss of viable
cells could be partially responsible for the tissues inability
to repair minor damage [19]. In addition, surviving
chondrocytes undergo a phenotypic shift that includes
expression of inappropriate matrix molecules[20-22],
decreased sensitivity to insulin like growth factor-1 (IGF-
1)[23], increased expression of vascular endothelial
growth factor (VEGF) and VEGF receptor[24,25],
decreased expression of chondromodulin-I (ChM-I)[24],
altered interleukin (IL)-4 signaling[25], and altered
integrin-dependent mechanotransduction pathways[26].
However, the exact timing and complete nature of pheno-
typic changes in osteoarthritic chondrocytes and the asso-
ciated alterations in gene expression are not known at this
time.
In order to understand the earliest stages in the pathogen-
esis of OA, studies need to be designed that examine
changes that occur in AC prior to irreversible damage. Ani-
mal models have been developed which allow longitudi-
nal study of OA with a known time of initiation[27-33].
For the present study, the Pond-Nuki model of OA[34]
was chosen. Two weeks after surgery the animals were
euthanatized and AC from defined regions of the femoral
condyles and tibial plateaus of both the operated and
non-operated control stifles was analyzed for histologic,
biochemical, and molecular measures of cell and matrix
changes.
This study was designed to determine the feasibility of
analyzing changes in gene expression of articular cartilage
two weeks after ACL-transection. The specific aims of this
study were to determine if changes in relevant gene
expression could be observed two weeks after ACL
transection in dogs which correlate to future pathology as
indicated by historical data in this model; determine if
articular cartilage from different regions of the joint sur-
face have unique changes in relative gene expression levels
in response to ACL transection; and characterize the
changes in gene expression at this time point. It was
hypothesized that significant increases in gene expression
for degradative enzymes (MMPs and ADAMTS) as well as
inflammatory indicators (INOS and COX-2) would be
observed in those regions of the articular cartilage which
historically undergo gross and histologic changes after
ACL-X, while the expression for antidegradative (TIMPs)
and matrix molecules (Col 1, Col 2, Aggrecan) would be
unchanged or decreased in these same regions. A potential
pattern of regional differential gene expression was
observed in this study indicative of increased inflamma-
tory, degradative, and repair/remodeling response with
the articular cartilage tissue. These data will be used in
future studies aimed at better characterizing the changes
that occur in the joint during the development of OA and
for studies aimed at developing and evaluating diagnostic,
preventative, and therapeutic strategies for OA.
Journal of Orthopaedic Surgery and Research 2006, 1:8 />Page 3 of 12
(page number not for citation purposes)
Methods
Pond-Nuki model
All procedures were approved by the University of Mis-
souri Animal Care and Use Committee. Adult (2–4 years
of age), hound-mix (mean weight = 27.6 Kg, range: 24.3–
33.1 kg)) research dogs (n = 4) were premedicated, anes-
thetized, and prepared for aseptic surgery of one ran-
domly assigned stifle. Routine craniolateral and
craniomedial arthroscope and instrument portals were
established and the anterior cruciate ligament was com-
pletely transected arthroscopically. Complete transection
of the ACL was confirmed by visual observation and pal-
pation of anterior tibial translocation. Analgesics (mor-
phine or aspirin) were administered to the dogs at the
time of extubation, and then as necessary to control signs
of pain (aspirin was discontinued 48 hours post-op). The
dogs were recovered and returned to their individual ken-
nels. The dogs were allowed to use the affected limb in a
10 × 10 foot kennel. In addition, the dogs were walked on
a leash twice daily for 10 minutes at a pace that ensured
use of all four limbs.
Two weeks after surgery, the dogs were euthanatized by
intravenous overdose of a barbiturate. After euthanasia,
both stifles of each dog were carefully disarticulated and
examined. The menisci were examined and any gross
meniscal pathology was recorded. The tibial plateau and
femoral condyles were photographed. All articular sur-
faces were painted with India ink, washed after 60 seconds
with tap water, and photographed. If staining was
observed, then unexposed radiographic film was placed
over each condyle and plateau, and cut to match the sur-
face area of the condyle. The areas of India ink staining
were outlined using a permanent marker. Tracings of the
India ink-stained tibial and femoral condyles were evalu-
ated without knowledge of dog number or treatment
group. The tracings were scanned using a computer soft-
ware program and percentage of the total area of the tibial
and the femoral condyles that stained calculated and
recorded as % area of cartilage damage (%ACD). The
%ACD was determined for the tibial and femoral con-
dyles, separately and together, for each dog. Tissue was
harvested from the affected and unoperated contralateral
limb as described below.
Tissue harvest
Full-thickness articular cartilage samples were collected
from the cranial medial femoral condyle (CrMFC), caudal
medial femoral condyle (CaMFC), cranial lateral femoral
condyle (CrLFC), caudal lateral femoral condyle (CaLFC),
cranial medial tibial plateau (CrMTP), caudal medial tib-
ial plateau (CaMTP), cranial lateral tibial plateau (CrLTP),
and caudal lateral tibial plateau (CaLTP) from affected
and contralateral control limb of two dogs (Figure 1). One
sample per region per animal was evaluated for relative
gene expression level and matrix biochemical composi-
tion. Cartilage samples collected for gene expression anal-
ysis were snap-frozen in liquid nitrogen and stored at -
80°C. Cartilage samples collected for biochemical assays
were weighed to determine wet weight and stored at -
20°C. The affected and contralateral tibial plateau and
femoral condyles from the other two dogs were harvested,
and serial sagittal sections were made from medial to lat-
eral to include articular cartilage and subchondral bone.
The sections were fixed in 10% buffered formalin and
decalcified by emersion in Surgipath Decalsifier II at room
temperature for 24 hours. The fixed tissues were paraffin
embedded, and 5-micron sections were cut and stained
with hematoxylin and eosin (H&E) and toluidine blue for
subjective histologic assessment.
Papain digestion of tissues
Articular cartilage samples were digested overnight at
65°C using 500 μl of papain digestion buffer (20 mM
sodium phosphate buffer, 1 mM EDTA, 300 μg/ml (14 U/
mg) of papain, and 2 mM DTT), and then stored at -20°C
until analyzed further.
Glycosaminoglycan (GAG) assay
Total sulfated GAG content was determined using the
dimethylmethylene blue (DMMB) assay[35]. The GAG
content of each sample was determined by adding 245 μl
of DMMB to 5 μl of each papain digested sample, and
absorbance was determined at 530 nm. Known concentra-
tions of chondroitin sulfate (2.5 μg to .3125 μg)(Sigma,
St. Louis, MO) were used to create a standard curve.
Results were standardized to the wet weight of each tissue
and reported as μg/mg tissue wet weight.
Hydroxyproline (HP) assay
Total collagen content was determined using a colorimet-
ric assay to measure the HP content[36]. The assay was
modified to a 96-well format. A 50 μl sample from the
papain digested tissues was mixed with an equal volume
of 4N sodium hydroxide in a 1.2 ml deep-well 96-well
polypropylene plate. The plate was covered with silicon
sealing mat, a polypropylene cover was placed on top of
the mat, and the plates were stacked. The plates were
sealed by compression with a C-Clamp, and autoclaved at
120°C for 20 min to hydrolyze the sample. Chloramine T
reagent (450 μl) was mixed with each sample, and incu-
bated for 25 min at 25°C. Ehrlich aldehyde reagent (450
μl) was mixed with each sample and incubated for 20 min
at 65°C to develop the chromophore. Known concentra-
tions of HP (Sigma, St. Louis, MO) were used to construct
a standard curve (20 μg to 2 μg). A portion (100 μl) of
each sample was transferred to a new 0.2 ml 96-well plate,
and absorbance read at 550 nm. Values obtained were
standardized to the wet weight of the cartilage explant and
reported as mg/mg tissue wet weight.
Journal of Orthopaedic Surgery and Research 2006, 1:8 />Page 4 of 12
(page number not for citation purposes)
RNA extraction
Total RNA was extracted using the Trispin method[37].
Explants were disrupted in liquid nitrogen utilizing a tis-
sue crusher, homogenized in 1 ml of TRIzol (Invitrogen,
Carlsbad, CA) using a mini-beadbeater (Biospec Products,
Bartlesville, OK) and 2 mm zirconia beads (Biospec Prod-
ucts, Bartlesville, OK). The homogenate was transferred to
a new tube, and insoluble material was pelleted by centrif-
ugation. The supernatant was transferred to a new tube
and Chloroform (200 μl) was added to each sample. The
organic and aqueous phases were separated by high speed
centrifugation. The upper aqueous phase was transferred
to a new tube and ethanol (ETOH) was added to the aque-
ous phase to a final concentration of 35%, mixed by vor-
texing, and passed through an RNeasy mini-column
(Qiagen Valencia, CA) to bind the RNA. The column was
washed with wash buffer; contaminating DNA was
digested on the column with DNase 1 (Qiagen Valencia,
CA); and the column was washed three more times. RNA
was eluted off the column using 30 μl of RNase free water.
The yield of extracted total RNA was determined by meas-
uring absorbance at 260 nm, and purity was assessed
using the ratio of absorbance readings at 260 nm to 280
nm. The average RNA yield was approximately 1 μg of
total RNA per sample.
Real Time RT-PCR
Reverse transcription
Reverse transcription was performed using Stratascript™
reverse transcriptase (Stratagene, La Jolla, CA), according
to the manufacturer's protocol. Total RNA (500 ng) from
each sample was mixed with 10 pM of random hexamers
and RNase-free water to a final volume of 16 μl. The mix-
ture was then incubated at 68°C for 5 minutes and trans-
ferred to ice for 3 minutes. After incubation on ice 4 μl of
the reaction mixture, containing 2 μl of the 10X
Stratascript™ buffer, 1 μl of 10 mM dNTPs, and 1 μl of the
Stratascript™ enzyme, was added to each sample. The sam-
ples were then incubated in a PE GeneAmp 9700 for 90
min at 45°C and then held at 4°C. The RT reaction was
diluted to 200 μl with RNase free water and stored at -
20°C until analyzed by real-time PCR.
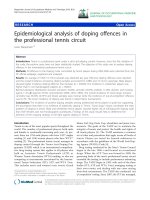
Regions of the Femoral Condyle and Tibial Plateau utilized for tissue harvestFigure 1
Regions of the Femoral Condyle and Tibial Plateau utilized for tissue harvest. Tissue samples were taken from each
region for biochemical and gene expression analysis.
Cranial Medial
Femoral Condyle
Caudal Medial
Femoral Cond
y
le
Cranial Lateral
Femoral Condyle
Caudal Lateral
Femoral Cond
y
le
Caudal Lateral Tibial
Plateau
Cranial Lateral Tibial
Plateau
Caudal Medial Tibial
Plateau
Cranial Medial Tibial
Plateau
Journal of Orthopaedic Surgery and Research 2006, 1:8 />Page 5 of 12
(page number not for citation purposes)
Real-Time PCR
Real-Time PCR was performed using the QuantiTect™
SYBR
®
Green PCR kit (Qiagen Valencia, CA) and the
Rotor-Gene 3000™ real-time PCR thermalcycler (Corbett
Research, Sydney, Australia). The reaction mixture con-
sisted of 4 μl of diluted cDNA, 0.3 μM of forward and
reverse primers (1 μl each), 10 μl of the 2X QuantiTect™
SYBR
®
green master mix, 0.1 μl of HK-UNG (Epicentre,
Madison, WI), and 4 μl of RNase-free water for each sam-
ple for a total volume of 20 μl. The PCR profile consisted
of 5 min at 35°C; 15 min at 94°C; 50 cycles of 5 seconds
(sec) at 94°C (melting), 10 sec at 57°C (annealing), and
15 sec at 72°C (extension); and a melt curve analysis from
69 to 95°C. Fluorescence was detected during the exten-
sion step of each cycle and during the melt curve analysis
at 470 nm/510 nm (excitation/emission) for SYBR
®
green.
Melt curve analysis was performed to ensure specific
amplification. Take off point (C
t
) and amplification effi-
ciency were determined using the comparative quantifica-
tion analysis provided with the Rotor-Gene software. Melt
curve analysis were performed using the melt curve analy-
sis function provided with the Rotor-Gene software.
Canine specific primers (Table 1) were developed for glyc-
eraldehyde-3-phosphate dehydrogenase (GAPDH), colla-
gen (COL) 1, COL 2, aggrecan, tissue inhibitor of matrix
metalloproteinases (TIMP)-1, TIMP-2, matrix metallopro-
teinase (MMP)-1, MMP-3, MMP-13, Aggrecanase-1
(ADAMTS4), Aggrecanase-2 (ADAMTS5), inducible nitric
oxide synthase (INOS), and cyclooxygenase-2 (COX-2)
using canine sequences available in Genbank. If canine
specific sequence was not available, then degenerate prim-
ers were developed using sequence data available for mul-
tiple species. The degenerate primers were then used to
amplify the canine sequence by standard PCR. The ampli-
fied section was sequenced, compared to the Genbank
database by BLAST to determine specificity, and canine
specific Real-Time PCR primers were developed from the
obtained sequence.
Histologic analysis
Histologic sections from all sites of both ACL-X and con-
trol stifles were stained with hematoxylin and eosin
(H&E) and toluidine blue. Sections were evaluated subjec-
tively by one investigator blinded to sample group or
number. Subjective assessment included histologic evi-
dence of cell viability, cell density, and cell morphology;
articular cartilage surface architecture; and proteoglycan
staining characteristics.
Statistical analysis
Relative levels of gene expression were determined using
Q-Gene[38] and the housekeeping gene GAPDH as an
internal standard. To assess for differences in gene expres-
sion, the non-parametric relative expression statistical
tool (REST-XL)[39,40] was used. Differences in gene
expression were considered significant when p < 0.05 and
the difference in expression between ACL-X and contralat-
eral limbs was >2X for both
animals. The statistical soft-
ware SigmaStat 2.03 (Jandel Scientific, San Rafael, CA)
was used to compare data from biochemical assays. Data
from each sample group were combined and a Mann-
Whitney Rank Sum test was performed to determine sig-
nificant differences between ACL-X and Control tissues
for biochemical analyses. Significance was set a p < 0.05.
Results
Gross and histologic analysis
No AC damage was present on the femoral condyles or
tibial plateaus in any of the ACL-X or control stifles based
on India ink staining (data not shown). No histologic evi-
dence consistent with degenerative or osteoarthritic
change was noted in any section based on subjective eval-
uation (data not shown).
Biochemical analysis
No significant differences in levels of total gly-
cosaminoglycans (p = 0.21, power = 0.16) or hydroxypro-
line (p = 0.21, power = 0.16) were observed between ACL-
X and control stifles in any region studied (Figures 2 and
3). However the powers of the analyses were lower than
0.8, and therefore should be interpreted with caution.
Gene expression analysis
Significant differences (p < 0.05) in gene expression
between ACL-X and control stifles were observed in every
region analyzed (Table 2 and 3, Figure 4), and each region
exhibited a unique gene expression pattern. The CrMFC,
CaMFC, CaMTP, CaLTP, and CrLTP regions exhibited the
greatest number of differentially expressed genes when
comparing ACL-X to control tissues. The CrMTP exhibited
the least number of genes exhibiting differential expres-
sion, followed by the CrLFC and CaLFC.
The only gene analyzed found to have a significant (p <
0.05) decrease in expression in ACL-X AC was TIMP-2 and
this was only noted in the CaLTP and CaMTP regions.
MMP-13 gene expression was significantly (p < 0.05)
higher for ACL-X cartilage in all regions except the CaLFC,
and had the highest fold increase in relative gene expres-
sion. Regional increases in TIMP-1, COX-2 and INOS were
detected in ACL-X cartilage, as well as the degradative
enzymes ADAMTS5 and MMP-3. Aggrecan expression was
increased in the CaLFC and the CrMFC, while Collagen 2
expression was increased in the CaLTP, CaMTP, and
CrLTP of ACL-X stifles. Col 1 gene expression was upregu-
lated in regions of both the femoral condyles and the tib-
ial plateaus in ACL-X stifles. Gene expression for MMP-1
and ADAMTS 4 were highly variable and not significantly
different between ACL-X and control tissues (data not
shown).
Journal of Orthopaedic Surgery and Research 2006, 1:8 />Page 6 of 12
(page number not for citation purposes)
Discussion
The results presented in this work indicate that relevant
changes in chondrocyte gene expression can be detected
in dogs two weeks after complete transection of the ACL.
To the authors' knowledge, this is the earliest time point
reported for site-specific gene expression analysis in dogs
using this model. Previous chondrocyte gene expression
analysis using the ACL-X transection model within a sim-
ilar time frame was performed in rabbits[41,42]. The
Pond-Nuki model in dogs appears to provide a more
appropriate model for OA in humans with respect to tis-
sue involvement, nature of pathology, and diagnostic
findings, as well as an extensive historical data base for
comparison[34,43-46]. Therefore, we chose to use this
model in dogs for molecular analysis of specific regions of
articular cartilage during the early stages of OA, prior to
gross or histologic evidence of pathology in an attempt to
produce the most comprehensive, translational, and clin-
ically relevant data possible.
In the present study, AC from both the tibial plateau (TP)
and femoral condyles (FC) showed no evidence of oste-
oarthritis based on gross, histologic, and biochemical
assessments. The lamina splendens was not disrupted in
any location based on lack of India ink staining, indicat-
ing that AC surface integrity was maintained for two
weeks in the dogs in this study. Histologically, all AC sub-
jectively appeared to have normal cell morphology, den-
sity, and distribution and ECM architecture and
composition. Further, there were not significant differ-
ences in proteoglycan or collagen levels between ACL-X
and control stifles, as determined by total GAG and HP
content. When considered together, these data indicate
that AC in the ACL-X stifles was still "normal" by pheno-
typic measures 2 weeks after ACL-X transection. The lack
of gross, histologic, or biochemical changes in AC sup-
ports previous work that indicates that observable
changes in AC do not occur prior to 4 weeks after ACL-X
in dogs[47,48].
The regional changes in gene expression observed in this
study suggest that focal biochemical, histological, and
gross changes in specific areas of AC consistently seen in
OA begin with alterations in gene expression. The medial
FC had a higher number of genes with significant changes
in relative expression levels compared to the lateral FC
after ACL-X. These data indicate that in this model the
medial FC is more affected by the insults to the joint
induced by transection of the ACL, which is in agreement
with previous studies in dogs[49] and other species[42].
Table 1: Primer sets used for Real-Time PCR analysis
Gene Orientation Primer Sequence Amplicon Size Melt Temp
GAPDH FOR GTGACTTCAACAGTGACACC 152 84.7
RC CCTTGGAGGCCATGTAGACC
Aggrecan FOR ATCGAAGGGGACTTCCGCTG 106 84.5
RC ATCACCACACAGTCCTCTCCG
COL 2 FOR GGCCTGTCTGCTTCTTGTAA 197 83.3
RC ATCAGGTCAGGTCAGCCATT
COL 1 FOR TGCACGAGTCACACTGGAGC 124 85.5
RC ATGCCGAATTCCTGGTCTGG
TIMP 1 FOR GCAGAAGTCAACCAGACCGA 311 86.2
RC GCAAGTATCCGCAGACGCTC
TIMP 2 FOR AACGGCAAGATGCACATCAC 142 85.5
RC ATATAGCACGGGATCATGGG
INOS FOR GCTATGCTGGCTACCAGATG 139 88.3
RC ATCAGCCTGCAGCACCAGAG
COX-2 FOR ACACTCTACCACTGGCATCC 196 83.5
RC GCTACTTGTTGTACTGCAGC
MMP-1 FOR CCTAGAACCGTGAAGAGCAT 150 80
RC CAGGAAAGTCAGCTGCTATC
MMP 3 FOR ATGGCATCCAGTCCCTGTAT 161 86.5
RC AAAGAACAGGAACTCTCCCC
MMP 13 FOR TCTGGTCTTCTGGCTCATGC 141 82.7
RC GGTCAAGACCTAAGGAGTGG
ADAMTS4 FOR CATCACTGAGTTCCTGGACA 106 84.5
RC CGATCAGCGTCATAGTCCTT
ADAMTS5 FOR TGACTTCTTGCATGGCATGG 120 81.5
RC CTGGCATGGCTGGTGACTGA
Canine primer sets used for real-time PCR analysis. The annealing temperature used for all analysis was 57°C. The melt temperature for the
amplicon was obtained from the Rotorgene software and is indicative of a specific PCR reaction.
Journal of Orthopaedic Surgery and Research 2006, 1:8 />Page 7 of 12
(page number not for citation purposes)
Differential gene expression data from the TP indicate that
tibial cartilage is more diffusely affected than femoral
articular cartilage after ACL transection. The CrLTP, the
CaLTP, and the CaMTP were most affected by transection
of the ACL with respect to changes in gene expression in
this study. These data are also in agreement with previous
studies using the Pond-Nuki model which reported lesion
formation in both lateral and medial aspects of tibial car-
tilage[42,49]. Continued research is required to deter-
mine if the regional differential gene expression profile
observed in this study occur consistently, and if the poten-
tial regional gene expression profile observed at this time
point can accurately predict phenotypic changes that con-
sistently occur at later time points during the progression
of OA. Further, two weeks after arthroscopic ACL-X sur-
gery inflammatory processes associated with healing
would be expected. The increased expression of COX-2
seen in many regions of AC may indicate that inflamma-
tion from surgery is affecting the tissues, and therefore
likely affecting the gene expression changes observed in
this study. The roles of surgery induced inflammation and
post operative healing on regional changes in chondro-
cyte gene expression, must be further investigated. On
going studies in our laboratory include sham operated
dogs as well as posterior cruciate ligament transected dogs
to distinguish the affects of these variables on the nature,
severity, and progression of joint pathology.
The overall pattern of gene expression observed in the
ACL-X AC indicated a potential shift in cellular metabo-
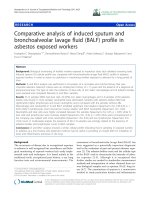
Hydroxyproline content of cartilage by regionFigure 2
Hydroxyproline content of cartilage by region. The HP content of each cartilage region from the ACL-X joint was com-
pared to the corresponding region in the contralateral control joint. Significant differences were not observed in the HP con-
tent of the tissues between ACL-X and control joints for any of the regions tested. Error bars indicate standard error of the
mean. Values are μg of HP/mg of tissue wet weight.
0
0.05
0.1
0.15
0.2
0.25
0.3
0.35
0.4
CrLFC CaLFC CrMFC CaMFC CaLTP CrLTP CaMTP CrMTP
HP (ug/mg)
ACL-X
Contrlateral
Journal of Orthopaedic Surgery and Research 2006, 1:8 />Page 8 of 12
(page number not for citation purposes)
lism consistent with early osteoarthritis. Increases in
COX-2 and INOS in regions most affected by joint insta-
bility were consistent with signaling events that typically
occur in OA joints[50,51]. The concurrent and often co-
localized increases in gene expression of COL 2, aggrecan,
MMP 13, and ADAMTS 5 seen in this study closely match
the elevated synthetic and degradative changes reported to
occur at the protein level in early OA[41,52-54].
Interestingly, three genes, MMP 13, COX-2, and COL 1,
were upregulated in all regions of ACL-X cartilage that had
relatively high numbers of differentially expressed genes.
Further, the present study provides data regarding the
potential hierarchy of expression of these three genes. The
CrLFC showed upregulation of both MMP 13 and COX-2,
while the CaMTP showed upregulation of MMP 13. This
could indicate that during the early development of OA,
MMP 13 gene expression is affected first, followed by
COX-2, and then COL 1. Based on this consistent upregu-
lation of these 3 important genes in cartilage metabolism,
it seems plausible that together these genes may be useful
markers for diagnosis and monitoring of disease progres-
sion in OA. If this possibility can be validated, assessment
of these markers could prove to be a valuable tool as a
diagnostic test for early OA.
Sulfated glycosaminoglycan content of cartilage by regionFigure 3
Sulfated glycosaminoglycan content of cartilage by region. The GAG content of each cartilage region from the ACL-X
joint was compared to the corresponding region in the contralateral control joint. Significant differences were not observed in
the GAG content of the tissues between ACL-X and control joints for any of the regions tested. Error bars indicate standard
error of the mean. Values are μg of GAG/mg of tissue wet weight.
0
5000
10000
15000
20000
25000
CrLFC CaLFC CrMFC CaMFC CaLTP CrLTP CaMTP CrMTP
GAG (ug/mg)
ACL-X
Contrlateral
Journal of Orthopaedic Surgery and Research 2006, 1:8 />Page 9 of 12
(page number not for citation purposes)
Conclusion
Though the number of animals analyzed in this study was
considered by the authors to be too small (n = 2 for all
assessments) to make definitive conclusions with respect
to pathophysisology of early OA or clinical relevance of
these data, the findings from this study lend credence to
the research approach and use of this model for the char-
acterization of OA, and the identification and validation
of future diagnostic modalities. Further, the changes
observed in this study may reflect the earliest changes in
AC reported during the development of OA, and may
reflect pathologic changes within a stage of disease that is
potentially reversible. By investigating specific regions
that have the highest number of differentially expressed
genes, it is possible that potential diagnostic markers will
be identified that can be utilized to diagnose OA early
enough to prevent the progression of the disease, or at
least optimally minimize the clinical signs and symptoms
of OA. Further, potential targets for treatment could be
identified. Ongoing research in our laboratory using this
Table 2: Differentially expressed genes in the ACL-X knee by region in the femoral chondyle
p value ACL-X Control CrMFC CrLFC ACL-X Control p value
<0.05 11.1 ± 1.71 0.57 ± 0.27 COL 1 MMP 13 0.096 ± 0.061 0.006 ± 0.002 <0.05
<0.05 859 ± 229 298 ± 212 Aggrecan COX-2 0.017 ± 0.012 0.001 ± 0.001 <0.05
<0.05 0.075 ± 0.032 0 ± 0 MMP 13
<0.05 0.106 ± 0.092 0.001 ± 0.001 COX-2
<0.05 50.8 ± 18.8 16.8 ± 11.9 TIMP-1
<0.05 10.4 ± 6.8 0.744 ± 0.224 MMP 3
0.0555 0.853 ± 0.714 0.01 ± 0.006 ADAMTS 5
p value ACL-X Control CaMFC CaLFC ACL-X Control p value
<0.05 709 ± 659 4.32 ± 0.35 COL 1 Aggrecan 370 ± 262 98 ± 23 <0.05
<0.05 1.224 ± 1.189 0.006 ± 0.001 MMP 13
<0.05 0.009 ± 0.005 0.001 ± 0.001 COX-2
<0.05 0.055 ± 0.028 0.016 ± 0.013 ADAMTS 5
Differentially expressed genes in the ACL-X knee by region in the femoral chondyle compared to the contralateral normal control. All genes listed
were up regulated in the ACL-transected side. Values listed are the mean relative level of expression for each gene (± standard error) compared to
the house keeping gene GAPDH. The increase in ADAMTS 5 gene expression in the CrMFC approached significance and was included in the table.
Significant differences were determined using REST-XL, and relative expression levels were determined using Q-Gene.
Table 3: Differentially expressed genes in the ACL-X knee by region in the tibial plateau
p value ACL-X Control CrMTP CrLTP ACL-X Control p value
<0.05 0.093 ± 0.02 0.018 ± 0.018 MMP 13 COL 1 5.46 ± 3.96 0.48 ± 0.08 <0.05
COL 2 1022 ± 651 254 ± 84 <0.05
MMP 13 0.147 ± 0.012 0 ± 0 <0.05
INOS 0.362 ± 0.065 0.04 ± 0.04 <0.05
COX-2 0.007 ± 0.005 0 ± 0 <0.05
TIMP-1 35.3 ± 4.6 8.4 ± 5.4 <0.05
MMP 3 2.428 ± 1.272 0.587 ± 0.18 <0.05
ADAMTS 5 0.132 ± 0.05 0.024 ± 0.024 <0.05
p value ACL-X Control CaMTP CaLTP ACL-X Control p value
<0.05 378.6 ± 321.42 9.05 ± 7.08 COL 1 COL 1 78.85 ± 43.79 1.98 ± 1.72 <0.05
<0.05 2787 ± 1919 594 ± 151 COL 2 COL 2 1926 ± 939 708 ± 49 <0.05
<0.05 0.074 ± 0.059 0.007 ± 0.007 MMP 13 MMP 13 0.05 ± 0.002 0.011 ± 0.011 <0.05
<0.05 0.051 ± 0.044 0.003 ± 0.001 COX-2 COX-2 0.019 ± 0.006 0.002 ± 0.002 <0.05
<0.05 0.189 ± 0.019 0.088 ± 0.002 INOS
<0.05 0.023 ± 0.011 0.002 ± 0.002 ADAMTS 5
<0.05 1.4 ± 0.07 3.71 ± 0.08 TIMP-2 TIMP-2 0.99 ± 0.02 2.7 ± 0.8 <0.05
Differentially expressed genes in the ACL-transected knee by region in the tibial plateau compared to the contralateral normal control. All genes
listed were up regulated in the ACL-transected stifle except TIMP-2, which was down regulated in the ACL-transected stifle. Values listed are the
mean relative level of expression (± standard error) for each gene compared to the house keeping gene GAPDH. Significant differences were
determined using REST-XL, and relative expression levels were determined using Q-Gene.
Journal of Orthopaedic Surgery and Research 2006, 1:8 />Page 10 of 12
(page number not for citation purposes)
experimental approach is focused on identifying and
developing diagnostic methods and markers, as well as
strategies for prevention and treatment of OA in the earli-
est stages of disease.
Competing interests
The author(s) declare that they have no competing inter-
ests.
Authors' contributions
AS: study design, sample harvesting, sample processing,
acquisition of data, analysis and interpretation of data,
writing of manuscript. KK: animal care, sample harvest-
ing, acquisition of data, editing of manuscript. DF: animal
care, surgical procedures, sample harvesting, editing of
manuscript. JC: animal care, surgical procedures, sample
harvesting, analysis and interpretation of data, writing of
manuscript.
References
1. Andersson-Molina H, Karlsson H, Rockborn P: Arthroscopic par-
tial and total menisectoy: A long-term follow-up study with
matched controls. Arthroscopy 2002, 18:440-445.
2. Bonneux I, Vanderkerckhove B: Arthroscopic partial lateral
meniscectomy: Long-Term results in athletes. Acta Orthop
Belg 2002, 68:356-61.
3. Hunt SA, Jazrawi LM, Sherman OH: Arthroscopic management
of osteoarthritis of the knee. J Am Acad Orthop Surg 2002,
10(5):356-63.
4. Abhaykumar S, Tyagi A, Towns GM: Thoracic vertebral osteo-
phyte-causing myelopathy: early diagnosis and treatment.
Spine 2002, 27(14):E334-6.
5. Asano H, Muneta T, Ikeda H, Yagishita K, Kurihara Y, Sekiya I:
Arthroscopic evaluation of the articular cartilage after ante-
rior cruciate ligament reconstruction: a short-term prospec-
tive study of 105 patients. Arthroscopy 2004, 20(5):474-81.
Differentially expressed genes by regionFigure 4
Differentially expressed genes by region. Graphical representation of genes differentially expressed by region in the tibial
plateau (A) and femoral condyle (B). Increasing shade of red indicates an increased number of genes differentially expressed in
that region. * ADAMTS 5 gene expression approached significance (p = .055)
Cranial Medial Tibial Plateau
MMP-13
Caudal Medial Tibial Plateau
Col 1 MMP-13 Cox-2 TIMP-2
Col 2 ADAMTS 5 INOS
Caudal Lateral Tibial Plateau
Col 1 MMP-13 Cox-2 TIMP-2
Col 2
Cranial Lateral Tibial Plateau
Col 1 MMP-13 Cox-2 TIMP-1
Col 2 MMP-3 INOS
ADAMTS 5
Cranial Medial Femoral Cond
y
le
Col 1 MMP-13 Cox-2 TIMP-1
Agg MMP-3
*ADAMTS 5
Caudal Medial Femoral Cond
y
le
Col 1 MMP-13 Cox-2
ADAMTS 5
Caudal Lateral Femoral Cond
y
le
Agg
Cranial Lateral Femoral Cond
y
le
MMP-13 Cox-2
A
B
Journal of Orthopaedic Surgery and Research 2006, 1:8 />Page 11 of 12
(page number not for citation purposes)
6. Chu CR, Lin D, Geisler JL, Chu CT, Fu FH, Pan Y: Arthroscopic
microscopy of articular cartilage using optical coherence
tomography. Am J Sports Med 2004, 32(3):699-709.
7. Peterfy CG, Guermazi A, Zaim S, Tirman PF, Miaux Y, White D,
Kothari M, Lu Y, Fye K, Zhao S, Genant HK: Whole-Organ Mag-
netic Resonance Imaging Score (WORMS) of the knee in
osteoarthritis. Osteoarthritis Cartilage 2004, 12(3):177-90.
8. Raynauld JP, Martel-Pelletier J, Berthiaume MG, Labonte F, Beaudoin
G, de Guise JA, Bloch DA, Choquette D, Haraoui B, Altman RD,
Hochberg MC, Meyer JM, Cline GA, Pelletier JP: Quantitative mag-
netic resonance imaging evaluation of knee osteoarthritis
progression over two years and correlation with clinical
symptoms and radiologic changes. Arthritis Rheum 2004,
50(2):476-87.
9. Peterfy C, Kothari M: Imaging Osteoarthritis: Magnetic Reso-
nance Imaging Versus X-ray. Curr Rheumatol Rep 2006,
8(1):16-21.
10. Fox DB, Cook JL: Synovial fluid markers of osteoarthritis in
dogs. J Am Vet Med Assoc 2001, 219:756-761.
11. Toyras J, Lyyra-Laitinen T, Niinimaki M, Lindgren R, Nieminen MT,
Kiviranta I, Jurvelin JS: Estimation of the Young's modulus of
articular cartilage using an arthroscopic indentation instru-
ment and ultrasonic measurement of tissue thickness. J Bio-
mech 2001, 34(2):251-6.
12. Chu CR, Lin D, Geisler JL, Chu CT, Fu FH, Pan Y: Arthroscopic
microscopy of articular cartilage using optical coherence
tomography. Am J Sports Med 2004, 32(3):699-709.
13. Buckwater JA, Mow VC: Cartilage repair in osteoarthritis. In
Osteoarthritis diagnosis and medical/surgical management 2nd edition.
Edited by: Moskowitz RW, Howell DS, Goldberg VM, Mankin HJ. Phil-
adelphia: W.B. Saunders Company; 1992:71-107.
14. Buckwalter JA, Cruess R: Healing of musculoskeletal tissues. In
Fractures in Adults 3rd edition. Edited by: Rockwood CA, Green DP,
Bucholz RW. Philadelphia: J.B. Lippincott; 1991:181-222.
15. Blanco FJ, Guitian R, Vasquez-Marteul E, de Toro FJ, Galdo F: Oste-
oarthritic chondrocytes die by apoptosis: a possible pathway
for osteoarthritis pathology. Arthritis Rheum 1998, 41:
284-9.
16. Hashimoto S, Ochs RL, Komiya S, Lotz M: Linkage of chondrocyte
apoptosis and cartilage degradation in human osteoarthritis.
Arthritis Rheum 1998, 41:1632-8.
17. Kim Ha, LEE YJ, Seong S-C, Choe KW, Song YW: Apoptotic
chondrocyte death in human osteoarthritis. J Rheumatol 2000,
27:455-62.
18. Tew SR, Kwan AP, Hann A, Thomson BM, Archer CW: The reac-
tions of articular cartilage to experimental wounding: role of
apoptosis. Arthritis Rheum 2000, 43(1):215-25.
19. Buckwalter J, Rosenberg L, Coutts R, Hunziker E, Hari Reddi A, Mow
V: Articular Cartilage: Injury and Repair. In AAOSS Injury and
Repair of the Musculoskeletal Soft Tissues Edited by: Woo S, Buckwalter
J. Park Ridge: AAOS; 1988:465-482.
20. Girkontaite I, Frischholz S, Lammi P, Wagner K, Swoboda B, Aigner
T, Von der Mark K: Immunolocalization of type X collagen in
normal fetal and adult osteoarthritic cartilage with mono-
clonal antibodies. Matrix Biol 1996, 15:231-238.
21. Sandell LJ, Aigner T: Articular cartilage and changes in arthritis.
An introduction: cell biology of osteoarthritis. Arthritis Res
2001, 3(2):107-13.
22. Aigner T, Reichenberger E, Bertling W, Kirsch T, Stoss H, von der
Mark K: Type X collagen expression in osteoarthritic and
rheumatoid articular cartilage. Virchows Arch B Cell Pathol 1993,
63:205-211.
23. Dore S, Pelletier JP, DiBattista JA, Tardif G, Brazeau P, Martel-Pelle-
tier J: Human osteoarthritic chondrocytes possess an
increased number of insulin-like growth factor 1 binding sites
but are unresponsive to its stimulation. Possible role of IGF-
1-binding proteins. Arthritis Rheum 1994, 37(2):253-63.
24. Hayami T, Funaki H, Yaoeda K, Mitui K, Yamagiwa H, Tokunaga K,
Hatano H, Kondo J, Hiraki Y, Yamamoto T, Duong le T, Endo N:
Expression of the cartilage derived anti-angiogenic factor
chondromodulin-I decreases in the early stage of experimen-
tal osteoarthritis. J Rheumatol 2003, 30(10):2207-17.
25. Enomoto H, Inoki I, Komiya K, Shiomi T, Ikeda E, Obata K, Mat-
sumoto H, Toyama Y, Okada Y: Vascular endothelial growth fac-
tor isoforms and their receptors are expressed in human
osteoarthritic cartilage. Am J Pathol 2003, 162:171-181.
26. Salter DM, Millward-Sadler SJ, Nuki G, Wright MO: Differential
responses of chondrocytes from normal and osteoarthritic
human articular cartilage to mechanical stimulation. Biorhe-
ology 2002, 39(1–2):97-108.
27. Lapvetelainen T, Hyttinen MM, Saamanen AM, Langsjo T, Sahlman J,
Felszeghy S, Vuorio E, Helminen HJ: Lifelong voluntary joint load-
ing increases osteoarthritis in mice housing a deletion muta-
tion in type II procollagen gene, and slightly also in non-
transgenic mice. Ann Rheum Dis 2002, 61(9):810-7.
28. Ghosh P, Read R, Numata Y, Smith S, Armstrong S, Wilson D: The
effects of intraarticular administration of hyaluronan in a
model of early osteoarthritis in sheep. II. Cartilage composi-
tion and proteoglycan metabolism. Semin Arthritis Rheum 1993,
22(6 Suppl 1):31-42.
29. Liu W, Burton-Wurster N, Glant TT, Tashman S, Sumner DR,
Kamath RV, Lust G, Kimura JH, Cs-Szabo G: Spontaneous and
experimental osteoarthritis in dog: similarities and differ-
ences in proteoglycan levels. J Orthop Res 2003, 21(4):730-7.
30. Lefkoe TP, Trafton PG, Ehrlich MG, Walsh WR, Dennehy DT, Bar-
rach HJ, Akelman E: An experimental model of femoral condy-
lar defect leading to osteoarthrosis. J Orthop Trauma 1993,
7(5):458-67.
31. Hunziker EB, Rosenberg LC: Repair of partial-thickness defects
in articular cartilage: cell recruitment from the synovial
membrane. J Bone Joint Surg Am 1996, 78(5):721-33.
32. Yoshioka M, Kubo T, Coutts RD, Hirasawa Y: Differences in the
repair process of longitudinal and transverse injuries of car-
tilage in the rat knee. OA Cart 1998, 6(1):66-75.
33. Chambers MG, Cox L, Chong L, Suri N, Cover P, Bayliss MT, Mason
RM: Matrix metalloproteinases and aggrecanases cleave
aggrecan in different zones of normal cartilage but colocal-
ize in the development of osteoarthritic lesions in STR/ort
mice.
Arthritis Rheum 2001, 44(6):1455-65.
34. Pond MJ, Nuki G: Experimentally-induced osteoarthritis in the
dog. Ann Rheum Dis 1973, 32:387-388.
35. Farndale RW, Buttle DJ, Barret AJ: Improved quantitation and
discrimination of sulphated glycosaminoglycans by use of
dimethylmethylene blue. Biochem Biophys Acta 1986,
883:173-177.
36. Reddy GK, Enwemeka CS: A simplified method for the analysis
of hydroxyproline in biological tissues. Clinical Biochem 1996,
29:225-229.
37. Reno C, Marchuk L, Sciore P, Frank CB, Hart DA: Rapid isolation
of total RNA from small samples of hypocellular, dense con-
nective tissues. Biotechniques 1997, 22(6):1082-6.
38. Muller PY, Janovjak H, Miserez AR, Dobbie Z: Processing of gene
expression data generated by quantitative real-time RT-
PCR. Biotechniques 2002, 32(6):1372-4. 1376,1378-9.
39. Pfaffl MW, Horgan GW, Dempfle L: Relative expression software
tool (REST) for group-wise comparison and statistical analy-
sis of relative expression results in real-time PCR. Nucleic
Acids Res 2002, 30(9):e36.
40. Pfaffl MW: A new mathematical model for relative quantifica-
tion in real-time RT-PCR. Nucleic Acids Res 2001, 29(9):e45.
41. Bluteau G, Gouttenoire J, Conrozier T, Mathieu P, Vignon E, Richard
M, Herbage D, Mallein-Gerin F: Differential gene expression
analysis in a rabbit model of osteoarthritis induced by ante-
rior cruciate ligament (ACL) section. Biorheology 2002, 39(1–
2):247-58.
42. Le Graverand MP, Eggerer J, Vignon E, Otterness IG, Barclay L, Hart
DA: Assessment of specific mRNA levels in cartilage regions
in a lapine model of osteoarthritis. J Orthop Res 2002,
20(3):535-44.
43. Pelletier JP, Martel-Pelletier J, Ghandur-Mnaymneh L, Howell DS,
Woessner JF Jr: Role of synovial membrane inflammation in
cartilage matrix breakdown in the Pond-Nuki dog model of
osteoarthritis. Arthritis Rheum 1985, 28:554-561.
44. Caron JP, Fernandes JC, Martel-Pelletier J, Tardif G, Mineau F, Geng
C, Pelletier JP: Chondroprotective effect of intraarticular
injections of interleukin-1 receptor antagonist in experimen-
tal osteoarthritis. Suppression of collagenase-1 expression.
Arthritis Rheum 1996, 39:1535-1544.
45. Matyas JR, Huang D, Chung M, Adams ME: Regional quantification
of cartilage type II collagen and aggrecan messenger RNA in
joints with early experimental osteoarthritis. Arthritis Rheum
2002, 46:1536-1543.
Publish with BioMed Central and every
scientist can read your work free of charge
"BioMed Central will be the most significant development for
disseminating the results of biomedical researc h in our lifetime."
Sir Paul Nurse, Cancer Research UK
Your research papers will be:
available free of charge to the entire biomedical community
peer reviewed and published immediately upon acceptance
cited in PubMed and archived on PubMed Central
yours — you keep the copyright
Submit your manuscript here:
/>BioMedcentral
Journal of Orthopaedic Surgery and Research 2006, 1:8 />Page 12 of 12
(page number not for citation purposes)
46. Lorenz H, Wenz W, Ivancic M, Steck E, Richter W: Early and stable
upregulation of collagen type II, collagen type I and YKL40
expression levels in cartilage during early experimental oste-
oarthritis occurs independent of joint location and histologi-
cal grading. Arthritis Res Ther 2005, 7(1):R156-65.
47. Fernandes JC, Martel-Pelletier J, Lascau-Coman V, Moldovan F,
Jovanovic D, Raynauld JP, Pelletier JP: Collagenase-1 and colla-
genase-3 synthesis in normal and early experimental oste-
oarthritic canine cartilage: an immunohistochemical study. J
Rheumatol 1998, 25(8):1585-94.
48. Marijnissen AC, van Roermund PM, TeKoppele JM, Bijlsma JW, Lafe-
ber FP: The canine 'groove' model, compared with the ACLT
model of steoarthritis. OA Cart 2002, 10(2):145-55.
49. Brandt KD, Myers SL, Burr D, Albrecht M: Osteoarthritic changes
in canine articular cartilage, subchondral bone, and syn-
ovium fifty-four months after transection of the anterior cru-
ciate ligament. Arthritis Rheum 1991, 34(12):1560-70.
50. Mankin H: Current concepts review: the response of articular
cartilage to mechanical injury. J Bone Joint Surg [Am] 1983,
64:460-6.
51. Abramson SB, Attur M, Amin AR, Clancy R: Nitric oxide and
inflammatory mediators in the perpetuation of osteoarthri-
tis. Curr Rheumatol Rep 2001, 3(6):535-41.
52. Pelletier JP, Martel-Pelletier J, Altman RD, Ghandur-Mnaymneh L,
Howell DS, Woessner JF Jr: Collagenolytic activity and collagen
matrix breakdown of the articular cartilage in the Pond-
Nuki dog model of osteoarthritis. Arthritis Rheum 1983,
26:866-874.
53. Adams ME: Cartilage hypertrophy following canine anterior
cruciate ligament transection differs among different areas
of the joint. J Rheumatol 1989, 16(6):818-24.
54. Billinghurst RC, Dahlberg L, Ionescu M, Reiner A, Bourne A,
Rorabeck C, Mitchell P, Hambor J, Diekmann O, Tschesche H, Chen
J, Van Wart H, Poole AR: Enhanced cleavage of type II collagen
by collagenase in osteoarthritic articular cartilage. J Clin Invest
1997,
99:1534-1545.