From Turbine to Wind Farms Technical Requirements and Spin-Off Products Part 7 pot
Bạn đang xem bản rút gọn của tài liệu. Xem và tải ngay bản đầy đủ của tài liệu tại đây (536.89 KB, 15 trang )
Control Scheme of Hybrid Wind-Diesel Power Generation System
79
parameters and system nonlinearities etc., result in system uncertainties. The SMES
controllers in these works have been designed without considering system uncertainties.
The robust stability of resulted SMES controllers against uncertainties cannot be guaranteed.
They may fail to operate and stabilize the power system.
To enhance the robustness, many research works have been successfully applied robust
control theories to design of PSS and damping controllers of flexible AC transmission
systems (FACTS) devices. In (Djukanovic et.al. 1999) and (Yu et.al. 2001), the structured
singular value has been applied to design robust PSS and static var compensator (SVC),
respectively. In (Zhu et.al. 2003) and (Rahim & Kandlawala, 2004), the
H
∞
control approach
has been used to design robust PSS and FACTS devices. The presented robust controllers
above provide satisfactory effects on damping of power system oscillations. Nevertheless,
selection of weighting functions becomes an inevitable problem that is difficult to solve.
Furthermore, an order of designed controller depends on that of the system. This leads to
the complex structure controllers. In (wang et.al. 2002) and (Tan & wang, 2004), the robust
non-linear control based on a direct feedback linearization technique has been applied to
design an excitation system, a thyristor controlled series capacitor (TCSC) and a SMES.
However, the drawback of this design method is a tuning of Q and R matrices for solving
Riccati equation by trial and error. Besides, the resulted controllers are established by a state
feedback scheme which is not easy to implement in practical systems.
This chapter presents a controller design of programmed pitch controller (PPC) and Energy
storage (ES) to control frequency oscillation in a hybrid wind-diesel power generation. To
take system uncertainties into account in the control design, the inverse additive
perturbation is applied to represent all unstructured uncertainties in the system modeling.
Moreover, the performance conditions in the damping ratio and the real part of the
dominant mode is applied to formulate the optimization problem. In this work, the
structure of the proposed controllers are the conventional first-order controller (lead/lag
compensator). To achieve the controller parameters, the genetic algorithm (GA) is used to
solve the optimization problem. Various simulation studies are carried out to confirm the
performance of the proposed controller.
2. Proposed control design method
2.1 System uncertainties
System nonlinear characteristics, variations of system configuration due to unpredictable
disturbances, loading conditions etc., cause various uncertainties in the power system. A
controller which is designed without considering system uncertainties in the system
modeling, the robustness of the controller against system uncertainties can not be
guaranteed. As a result, the controller may fail to operate and lose stabilizing effect under
various operating conditions. To enhance the robustness of power system damping
controller against system uncertainties, the inverse additive perturbation (Gu et.al. 2005) is
applied to represent all possible unstructured system uncertainties. The concept of
enhancement of robust stability margin is used to formulate the optimization problem of
controller parameters.
The feedback control system with inverse additive perturbation is shown in Fig.1. G is the
nominal plant. K is the designed controller. For unstructured system uncertainties such as
various generating and loading conditions, variation of system parameters and
From Turbine to Wind Farms - Technical Requirements and Spin-Off Products
80
Fig. 1. Feedback system with inverse additive perturbation.
nonlinearities etc., they are represented by
A
Δ
which is the additive uncertainty model.
Based on the small gain theorem, for a stable additive uncertainty
A
Δ
, the system is stable if
/(1 ) 1
A
GGK
∞
Δ
−< (1)
then,
1/ /(1 )
A
GGK
∞
∞
Δ< − (2)
The right hand side of equation (2) implies the size of system uncertainties or the robust
stability margin against system uncertainties. By minimizing
(
)
1GGK
∞
− , the robust
stability margin of the closed-loop system is a maximum or near maximum.
2.2 Implementation
2.2.1 Objective function
To optimize the stabilizer parameters, an inverse additive perturbation based-objective
function is considered. The objective function is formulated to minimize the infinite norm of
(
)
1GGK
∞
− . Therefore, the robust stability margin of the closed-loop system will increase
to achieve near optimum and the robust stability of the power system will be improved. As
a result, the objective function can be defined as
Minimize
(
)
1GGK
∞
− (3)
It is clear that the objective function will identify the minimum value of
(
)
1GGK
∞
− for
nominal operating conditions considered in the design process.
2.2.2 Optimization problem
In this study, the problem constraints are the controller parameters bounds. In addition to
enhance the robust stability, another objective is to increase the damping ratio and place the
closed-loop eigenvalues of hybrid wind-diesel power system in a D-shape region (Abdel-
Magid et.al. 1999). the conditions will place the system closed-loop eigenvalues in the D-
shape region characterized by
s
p
ec
ζ
ζ
≥
and
s
p
ec
σ
σ
≤
as shown in Fig. 2.
Therefore, the design problem can be formulated as the following optimization problem.
Minimize
(
)
1GGK
∞
− (4)
Control Scheme of Hybrid Wind-Diesel Power Generation System
81
Fig. 2. D-shape region in the s-plane where
s
p
ec
σ
σ
≤
and
s
p
ec
ζ
ζ
≥
Subject to ,
s
p
ec s
p
ec
ζζ
σσ
≥≤ (5)
min max
KKK≤≤
min max
TTT
≤
≤
where
ζ
and
s
p
ec
ζ
are the actual and desired damping ratio of the dominant mode,
respectively;
σ
and
s
p
ec
σ
are the actual and desired real part, respectively;
max
K and
min
K
are the maximum and minimum controller gains, respectively;
max
T and
min
T are the
maximum and minimum time constants, respectively. This optimization problem is solved
by GA (GAOT, 2005) to search the controller parameters.
2.3 Genetic algorithm
2.3.1 Overview
GA is a type of meta-heuristic search and optimization algorithms inspired by Darwin’s
principle of natural selection. GA is used to try and solving search problems or optimize
existing solutions to a certain problem by using methods based on biological evolution. It
has many applications in certain types of problems that yield better results than the
common used methods.
According to Goldberg (Goldberg,1989), GA is different from other optimization and search
procedures in four ways:
1.
GA searches a population of points in parallel, not a single point.
2.
GA does not require derivative information or other auxiliary knowledge; only the
objective function and corresponding fitness levels influence the directions of search.
3.
GA uses probabilistic transition rules, not deterministic ones.
4.
GA works on an encoding of the parameter set rather than the parameter set itself
(except in where real-valued individuals are used).
From Turbine to Wind Farms - Technical Requirements and Spin-Off Products
82
It is important to note that the GA provides a number of potential solutions to a given
problem and the choice of final solution is left to the user.
2.3.2 GA algorithm
A. Representation of Individual.
Individual representation scheme determines how the problem is structured in the GA and
also determines the genetic operators that are used. Each individual is made up of a
sequence of genes. Various types of representations of an individual are binary digits,
floating point numbers, integers, real values, matrices, etc. Generally, natural
representations are more efficient and produce better solutions. Encoding is used to
transform the real problem to binary coding problem which the GA can be applied.
B. GA Operators.
The basic search mechanism of the GA is provided by the genetic operators. There are two
basic types of operators: crossover and mutation. These operators are used to produce new
solutions based on existing solutions in the population. Crossover takes two individuals to
be parents and produces two new individuals while mutation alters one individual to
produce a single new solution (S. Panda,2009).
In crossover operator, individuals are paired for mating and by mixing their strings
new individuals are created. This process is depicted in Fig. 3.
Fig. 3. Crossover operator
In natural evolution, mutation is a random process where one point of individual is replaced
by another to produce a new individual structure. The effect of mutation on a binary string
is illustrated in Fig. 4 for a 10-bit chromosome and a mutation point of 5 in the binary string.
Here, binary mutation flips the value of the bit at the loci selected to be the mutation point
(Andrew C et.al).
Fig. 4. Mutation operator
C. Selection for Reproduction
To produce successive generations, selection of individuals plays a very significant role in a
GA. The selection function determines which of the individuals will survive and move on to
the next generation. A probabilistic selection is performed based upon the individual’s
fitness such that the superior individuals have more chance of being selected (S. Panda et.al
,2009). There are several schemes for the selection process: roulette wheel selection and its
extensions, scaling techniques, tournament, normal geometric, elitist models and ranking
Control Scheme of Hybrid Wind-Diesel Power Generation System
83
methods. Roulette wheel selection method has simple method. The basic concept of this
method is “ High fitness, high chance to be selected”.
2.3.3 Parameters optimization by GA
In this section, GA is applied to search the controller parameters with off line tuning. Each
step of the proposed method is explained as follows.
Step 1. Generate the objective function for GA optimization.
In this study, the performance and robust stability conditions in inverse additive
perturbation design approach is adopted to design a robust controller as mention in
equation (4) and (5).
Step 2. Initialize the search parameters for GA. Define genetic parameters such as
population size, crossover, mutation rate, and maximum generation.
Step 3. Randomly generate the initial solution.
Step 4. Evaluate objective function of each individual in equation (4) and (5).
Step 5. Select the best individual in the current generation. Check the maximum generation.
Step 6. Increase the generation.
Step 7. While the current generation is less than the maximum generation, create new
population using genetic operators and go to step 4. If the current generation is the
maximum generation, then stop.
3. Robust frequency control in a hybrid wind-diesel power system
3.1 System modeling
The basic system configuration of an isolated hybrid wind-diesel power generation system
as shown in Fig. 5 (Das et.al. 1999) is used in this study. The base capacity of the system is
350 kVA. The diesel is used to supply power to system when wind power could not
adequately provide power to customer. Moreover, The PPC is installed in the wind side
while the governor is equipped with the diesel side. In addition to the random wind energy
supply, it is assumed that loads with sudden change have been placed in this isolated
system. These result in a serious problem of large frequency deviation in the system. As a
result, a serious problem of large frequency deviation may occur in the isolated power
system. Such power variations and frequency deviations severely affect the system stability.
Furthermore, the life time of machine apparatuses on the load side affected by such large
frequency deviations will be reduced.
3.2 Pitch control design in a hybrid wind-diesel power system
3.2.1 Linearized model of hybrid wind-diesel power system with PPC
For mathematical modelling, the transfer function block diagram of a hybrid wind-diesel
power generation used in this study is shown in Fig. 6 (Das et.al. 1999). The PPC is a 1
st
order lead-lag controller with single input feedback of frequency deviation of wind side.
The state equation of linearized model in Fig. 6 can be expressed as
PPC
XAXBu
•
Δ=Δ+Δ
(6)
PPC
YCXDu
Δ
=Δ+Δ (7)
()
PPC W
uKsf
Δ
=Δ (8)
From Turbine to Wind Farms - Technical Requirements and Spin-Off Products
84
Fig. 5. Basic configuration of a hybrid wind-diesel power generation system.
Fig. 6. Functional block diagram for wind–diesel system with proposed PPC.
Control Scheme of Hybrid Wind-Diesel Power Generation System
85
Where the state vector
112
[]
WDD D m
Xf f P PHHP
Δ
=Δ Δ Δ Δ Δ Δ Δ , the output vector
[]
W
YfΔ=Δ ,
PPC
UΔ is the control output of the PPC. The proposed control is applied to
design a proposed PPC K(s). The system in equation (6) is referred to as the nominal plant G.
3.2.2 Optimization problem formulation
The optimization problem can be formulated as follows,
Minimize
(
)
1GGK
∞
− (9)
Subject to ,
s
p
ec s
p
ec
ζζ
σσ
≥≤ (10)
min max
KKK
≤
≤
min max
TTT
≤
≤
where
ζ
and
s
p
ec
ζ
are the actual and desired damping ratio of the dominant mode,
respectively;
σ
and
s
p
ec
σ
are the actual and desired real part, respectively;
max
K and
min
K
are the maximum and minimum controller gains, respectively;
max
T and
min
T are the
maximum and minimum time constants, respectively. This optimization problem is solved
by GA to search optimal or near optimal set of the controller parameters.
3.2.3 Designed results
In this section, simulation studies in a hybrid wind-diesel power generation are carried out.
System parameters are given in (Das et.al. 1999). In the optimization, the ranges of search
parameters and GA parameters are set as follows:
[1 100]
C
K
∈
,
1
T and
2
T [0.0001 1]∈ ,
crossover probability is 0.9, mutation probability is 0.05, population size is 200 and
maximum generation is 100. As a result, “the proposed PPC” is given automatically.
In simulation studies, the performance and robustness of the proposed PPC is compared
with those of the PPC designed by the variable structure control (VSC) obtained from (Das
et.al. 1999). Simulation results under four case studies are carried out as shown in table 1.
Cases Disturbances
1 Step input of wind power or load change
2 Random wind power input
3 Random load power input
4 Simultaneous random wind power and load change.
Table 1. Operating conditions
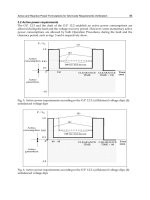
Case 1: Step input of wind power or load change
First, a 0.01 pukW step increase in the wind power input and the load power are applied to the
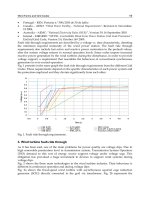
system at t = 5.0 s, respectively. Fig. 7 and Fig. 8 show the frequency deviation of the diesel
generation side which represents the system frequency deviation. The peak frequency
deviation is reduced significantly by both of the VSC PPC and the proposed PPC. However,
the proposed PPC is able to damp the peak frequency deviation quickly in comparison to VSC
PPC cases.
From Turbine to Wind Farms - Technical Requirements and Spin-Off Products
86
0 5 10 15 20 25 30
-1
-0.5
0
0.5
1
1.5
2
x 10
-4
Time (sec)
System frequency deviation (pu Hz)
VSC PPC
Proposed PPC
Fig. 7. System frequency deviation against a step change of wind power.
0 5 10 15 20 25 30
-3
-2
-1
0
1
x 10
-4
Time (sec)
System frequency deviation (pu Hz)
VSC PPC
Proposed PPC
Fig. 8. System frequency deviation against a step load change.
Case 2: Random wind power input.
In this case, the system is subjected to the random wind power input as shown in Fig.9. The
response of system frequency deviation is shown in Fig.10. By the proposed PPC, the
frequency deviation is significantly reduced in comparison to that of the VSC PPC.
Control Scheme of Hybrid Wind-Diesel Power Generation System
87
0 20 40 60 80 100
0
0.01
0.02
0.03
0.04
0.05
0.06
0.07
0.08
Time (sec)
Random wind power deviation (pu kW)
Fig. 9. Random wind power input.
0 20 40 60 80 100
-1.5
-1
-0.5
0
0.5
1
1.5
x 10
-3
Time (sec)
System frequency deviation (pu Hz)
VSC PPC
Proposed PPC
Fig. 10. System frequency deviation in case 2
Case 3: Random load change.
Next. the random load change as shown in Fig.11 is applied to the system. Fig. 12 depicts
the response of system frequency deviation under the load change disturbance. The control
effect of the proposed PPC is better than that of the VSC PPC.
From Turbine to Wind Farms - Technical Requirements and Spin-Off Products
88
0 20 40 60 80 100
0
0.005
0.01
0.015
0.02
0.025
Time (sec)
Random load power deviation (pu kW)
Fig. 11. Random load change
0 20 40 60 80 100
-8
-6
-4
-2
0
2
4
6
8
x 10
-4
Time (sec)
System frequency deviation (pu Hz)
VSC PPC
Proposed PPC
Fig. 12. System frequency deviation in case 3.
Case 4: Simultaneous random wind power and load change.
In this case, the random wind power input in Fig. 9 and the load change in Fig.11 are
applied to the hybrid wind-diesel power system simultaneously. The response of system
frequency deviation is shown in Fig. 13. The frequency control effect of the proposed PPC is
superior to that of the VSC PPC.
Control Scheme of Hybrid Wind-Diesel Power Generation System
89
0 20 40 60 80 100
-1.5
-1
-0.5
0
0.5
1
1.5
x 10
-3
Time (sec)
System frequency deviation (pu Hz)
VSC PPC
Proposed PPC
Fig. 13. System frequency deviation in case 4.
3.3 Frequency control in a hybrid wind-diesel power system using SMES
In this study, the system configuration in Fig. 5 is used to design frequency controller using
SMES. In worst case, it is assumed that the ability of the pitch controller in the wind side
and the governor in the diesel side to provide frequency control are is not adequate due to
theirs slow response. Accordingly, the SMES is installed in the system to fast compensate for
surplus or insufficient power demands, and minimize frequency deviation. Here, the
proposed method is applied to design the robust frequency controller of SMES.
3.3.1 Linearized model of hybrid wind-diesel power system with PPC and SMES
The linearized model of the hybrid wind-diesel power system with Programmed Pitch
Controller (PPC) and SMES is shown in Fig.14 (Tripathy, 1997). This model consists of the
following subsystems: wind dynamic model, diesel dynamic model, SMES unit, blade pitch
control of wind turbine and generator dynamic model. The details of all subsystems are
explained in (Tripathy, 1997). As shown in Fig. 15, the SMES block diagram consists of two
transfer functions, i.e. the SMES model and the frequency controller. Based on (Mitani et.al.
1988), the SMES can be modeled by the first-order transfer function with time constant
0.03
sm
T = s. In this work, the frequency controller is practically represented by a lead/lag
compensator with first order. In the controller, there are three control parameters i.e.,
sm
K ,
1sm
T and
2sm
T .
The linearized state equation of system in Fig. 14 can be expressed as
SM
XAXBu
•
Δ=Δ+Δ (11)
SM
YCXDu
Δ
=Δ+Δ (12)
SM SM IN
uKu
Δ
=Δ (13)
From Turbine to Wind Farms - Technical Requirements and Spin-Off Products
90
Fig. 14. Block diagram of a hybrid wind-diesel power generation with SMES.
Fig. 15. Block diagram of SMES with the frequency controller.
Where the state vector
[
]
T
MDFDW
PHHHPPffX ΔΔΔΔΔΔΔΔ=Δ
2101
, the output
vector
[]
D
fY Δ=Δ
,
D
f
Δ
is the system frequency deviation,
SMSES
P
Δ
is the control output
signal of SMES controller;
IN
u
Δ
=[
Y
Δ
] is the feedback input signal of SMES controller.
Note that the system in equation (11) is a single-input single-output (SISO) system. The
proposed method is applied to design SMES controller, and the system of equation (11) is
referred to as the nominal plant G
3.3.2 Optimization problem formulation
The optimization problem can be formulated as follows,
Minimize
(
)
1GGK
∞
− (14)
Subject to ,
s
p
ec s
p
ec
ζ
ζσσ
≥≤ (15)
Control Scheme of Hybrid Wind-Diesel Power Generation System
91
min max
KKK
≤
≤
min max
TTT≤≤
where
ζ
and
s
p
ec
ζ
are the actual and desired damping ratio of the dominant mode,
respectively;
σ
and
s
p
ec
σ
are the actual and desired real part, respectively;
max
K and
min
K
are the maximum and minimum controller gains, respectively;
max
T and
min
T are the
maximum and minimum time constants, respectively. This optimization problem is solved
by GA to search optimal or near optimal set of the controller parameters.
3.3.3 Designed results
In the optimization, the ranges of search parameters and GA parameters are set as follows:
s
pec
ζ
is desired damping ratio is set as 0.4,
s
pec
σ
is desired real part of the dominant mode is
set as -0.2, and
min
K are
max
K minimum and maximum gains of SMES are set as 1 and 60,
min
T and
max
T are minimum and maximum time constants of SMES are set as 0.01 and 5.
The optimization problem is solved by genetic algorithm. As a result, the proposed
controller which is referred as “RSMES” is given.
Table 2 shows the eigenvalue and damping ratio for normal operating condition. Clearly,
the desired damping ratio and the desired real part are achieved by RSMES. Moreover, the
damping ratio of RSMES is improved as designed in comparison with No SMES case.
Cases Eigenvalues (damping ratio)
NO SMES
-39.0043
-24.4027
-3.5072
-1.2547
-0.1851 ± j 0.671, ξ = 0.266
-0.5591 ± j 0.541, ξ = 0.719
RSMES
-39.5266
-24.4006
-2.1681
-1.3325
-17.782 ± j 5.339, ξ =0.958
-0.3050 ± j 0.539, ξ =0.492
-0.2012 ± j 0.268, ξ =0.600
Table 2. Eigenvalues and Damping ratio
To evaluate performance of the proposed SMES, simulation studies are carried out under
four operating conditions as shown in Table 1. In simulation studies, the limiter 0.01
−
pukW
0.01
SMES
P≤Δ ≤
pukW on a system base 350 kVA is added to the output of SMES
with each controller to determine capacity of SMES. The performance and robustness of the
proposed controllers are compared with the conventional SMES controllers (CSMES)
obtained from (Tripathy,1997). Simulation results under 4 case studies are carried out as
follows.
From Turbine to Wind Farms - Technical Requirements and Spin-Off Products
92
Case 1: Step input of wind power or load change
In case 1, a 0.01 pukW step increase in the wind power input are applied to the system at t =
0.0 s. Fig. 16 shows the frequency deviation of the diesel generation side which represents
the system frequency deviation. Without SMES, the peak frequency deviation is very large.
The frequency deviation takes about 25 s to reach steady-state. This indicates that the pitch
controller in the wind side and the governor in the diesel side do not work well. On the
other hand, the peak frequency deviation is reduced significantly and returns to zero within
shorter period in case of CSMES and the RSMES. Nevertheless, the overshoot and setting
time of frequency oscillations in cases of RSMES is lower than that of CSMES.
0 5 10 15 20 25 30
-3
-2
-1
0
1
2
3
x 10
-4
Time (sec)
System frequency deviation (pu Hz)
Without SMES
CSMES
RSMES
Fig. 16. System frequency deviation against a step change of wind power.
Next, a 0.01 pukW step increase in the load power is applied to the system at t = 0.0 s. As
depicted in Fig. 17, both CSMES and RSMES are able to damp the frequency deviation
quickly in comparison to without SMES case. These results show that both CSMES and
RSMES have almost the same frequency control effects.
Case 2: Random wind power input.
In this case, the system is subjected to the random wind power input as shown in Fig.18. The
system frequency deviations under normal system parameters are shown in Fig.19. Normal
system parameter is the design point of both CSMES and RSMES. By the RSMES, the
frequency deviation is significantly reduced in comparison to that of CSMES.
Next, the robustness of frequency controller is evaluated by an integral square error (ISE)
under variations of system parameters. For 100 seconds of simulation study under the same
random wind power in Fig.18, the ISE of the system frequency deviation is defined as
ISE of
100
2
0
DD
ff
dtΔ= Δ
∫
(16)
Control Scheme of Hybrid Wind-Diesel Power Generation System
93
0 5 10 15 20 25 30
-3.5
-3
-2.5
-2
-1.5
-1
-0.5
0
0.5
1
1.5
x 10
-4
Time (sec)
System frequency deviation (pu Hz)
Without SMES
CSMES
RSMES
Fig. 17. System frequency deviation against a step load change.
0 20 40 60 80 100
0
0.2
0.4
0.6
0.8
1
1.2
x 10
-3
Time (sec)
Random wind power deviation (pu kW)
Fig. 18. Random wind power input.