Deploying RFID Challenges Solutions and Open Issues Part 7 potx
Bạn đang xem bản rút gọn của tài liệu. Xem và tải ngay bản đầy đủ của tài liệu tại đây (429.33 KB, 30 trang )
9
The U.S. National Animal Identification System
(NAIS) & the U.S. Beef-Cattle Sector:
A Post-Mortem Analysis of NAIS
Rhonda Skaggs
New Mexico State University
United States of America
1. Introduction
The appearance of bovine spongiform encephalopathy (BSE) in the United States in late 2003
resulted in severe economic impacts to the U.S. livestock sector. U.S. exports of beef and live
cattle were immediately embargoed by importing countries as a result of BSE, and markets
have not fully recovered eight years later. The trade status of the U.S. beef and cattle sectors
was severely harmed when trading partners used BSE as justification for increased
protectionism. The trade response to one BSE-infected cow and the desire to protect the U.S.
livestock industry’s economic interests enhanced concerns about intentional and accidental
disease outbreaks. The first BSE-infected cow identified in the United States and ongoing
fears that a virulent disease (foot and mouth disease, in particular) could cost billions and
destroy the U.S. livestock sector led many people to conclude that a nationwide individual
animal identification system was necessary. As a result, the National Animal Identification
System (NAIS) was set forth in early 2004 by a working group including both industry and
government officials. The NAIS built on the National Animal Identification Plan initiated in
2002. The goal of the NAIS was nationwide 48-hour traceback of all livestock and poultry in
the event of a disease emergency.
The Animal Health Protection Act (AHPA) enacted with the 2002 Farm Bill set the legal
stage for the federal government to be involved in the national animal identification effort.
The 2002 AHPA includes language that indicates the federal government’s intention to
expand regulation of livestock due to interstate commerce and related movements of pest or
disease threats (O’Brien, 2006). The AHPA was interpreted as giving the U.S. Secretary of
Agriculture the ability to prohibit all movement of livestock unless producers participated
in the NAIS. The NAIS entailed three components: Premises registration, animal
identification, and animal tracking. Premises registration was the assignation of a unique
premises number to all facilities where animals are managed or held. Animal identification
assigned a unique number to individual animals or lots in the case of animals that stay with
the same group their entire lives. Animal tracking involved the collection of data for animal
movements and the recording of those data in a central recordkeeping system which could
be quickly and comprehensively accessed in the event of an animal health emergency.
A 2005 USDA document indicated that the NAIS would begin as a voluntary program, but
would become mandatory in 2009 (United States Department of Agriculture – Animal and
Deploying RFID – Challenges, Solutions, and Open Issues
168
Plant Health Inspection Service [USDA-APHIS], 2005). The USDA stated in a 2006 document
that while the agency had the authority to make the system mandatory, it had chosen
to make every component of NAIS voluntary at the federal level (USDA-APHIS, 2006a).
In a 2008 report, the USDA designated cattle as the highest priority species with respect
to NAIS implementation and presented revised timelines and benchmarks for NAIS
progress by species (USDA-APHIS, 2008a). Implementation benchmarks for cattle were
scaled down from previous NAIS documents, and the cattle implementation timeline was
also extended. NAIS benchmarks were scaled back for other species, although not as much
as for cattle.
In June 2006 the USDA published a document intended to provide guidance for “non-
commercial” livestock producers and their position within the NAIS. This guide attempted
to alleviate small-scale livestock producers’ concerns about the system, stating that NAIS
participation was voluntary and that the NAIS would “largely focus on commercial
operations and animals” (USDA-APHIS, 2006b). Critics of NAIS quickly pointed out that
many statements in the report were inconsistent with other NAIS documents regarding the
government’s plan to extend NAIS coverage to all livestock and livestock movements within
the United States.
The federal government issued numerous grants and cost-shares to states and tribes as
inducements for premises registration and spent more than $120 million in the process;
however, at the end of 2009, only 36% of premises were registered nationwide (USDA-
APHIS, 2010). Some states achieved higher levels of premises registration by tying it to
other state-level licenses or programs. In September 2008, the USDA issued a memorandum
which stated that premises registration would be mandatory for emergency disease
management or for state or federal activities involving diseases regulated through the Code
of Federal Regulations. Although this memorandum was cancelled in December 2008, the
USDA maintained that the federal government has broad authority to assign premises
identification numbers as part of their normal animal health program activities. Recent
livestock disease outbreaks in some states thus have resulted in mandatory NAIS
participation for affected producers.
In June 2009, federal funding for NAIS in its current form was dropped from the fiscal 2010
spending bill by the House Agriculture Appropriations Subcommittee, with House leaders
indicating that no future funds would be available for the program unless USDA developed
and implemented a mandatory NAIS. The USDA conducted numerous NAIS “listening
sessions” throughout the country in 2009 and received many more comments on NAIS at
the Regulations.gov website.
Since the inception of NAIS, the federal government has asserted that the future economic
viability of the U.S. livestock industry rests on improved disease management through
nationwide animal identification and traceability. However, over the last several years,
many U.S. livestock producers raised concerns about the security and confidentiality of
premises and animal data provided to the national system, increased liability on the part of
producers as a result of traceback to the farm level, the costs of NAIS participation, and the
overall feasibility of the system. Opponents of NAIS claimed it was unconstitutional, a
violation of their property rights, inconsistent with religious beliefs, an invasion of their
privacy, and a loss of freedom. They did not believe USDA’s assurances that NAIS
information would not be subject to Freedom of Information Act requests or that use of the
information would be restricted to animal health emergencies. The 2009 “listening sessions”
The U.S. National Animal Identification System (NAIS) &
the U.S. Beef-Cattle Sector: A Post-Mortem Analysis of NAIS
169
were dominated by NAIS opponents, with a small minority of session participants speaking
out in favor of the system. The comments posted at Regulations.gov were nearly unanimous
against NAIS.
In February 2010, the USDA announced that it was abandoning the NAIS (USDA-APHIS,
2010). The agency indicated that it was going to “revise prior animal identification policy
and offer a new approach to achieving animal disease traceability” (USDA-APHIS, 2010).
The new approach will apparently only apply to animals moving interstate, although the
operational details of the approach have yet to be developed. The agency’s February 2010
Factsheet also stated that the new approach intends to “help overcome some of the mistrust
caused by NAIS.”
For almost a decade, proponents maintained that NAIS would protect producers’ animals,
investments and neighbors, and that “as producers become increasingly aware of the
benefits of the NAIS and the level of voluntary participation grows, there will only be less
need to make the program mandatory” (USDA-APHIS, 2006a). The USDA stated that NAIS
would help protect U.S. livestock and poultry from disease spread, maintain consumer
confidence in the food supply, and retain access to domestic and foreign markets (USDA-
APHIS, 2007). In 2010, the federal government was forced to admit that arguments in favor
of NAIS had fallen flat with a large segment of U.S. livestock producers.
The cattle industry was designated by the USDA as having the highest priority for full NAIS
implementation; however, the cow-calf portion of the beef cattle sector was very resistant to
NAIS (evidenced by continuously extended timelines and increasingly modest benchmarks
for implementation). The economic, structural, and socio-cultural reasons for cow-calf
producer resistance are the subject of the rest of this paper. If future livestock disease
traceability efforts in the United States are to be successful (and disease catastrophes are to
be avoided), it is absolutely essential that the context of cow-calf producer resistance to
NAIS be fully understood. The objective of this paper is to describe the context and
implications for the post-NAIS traceability framework.
2. Overview of U.S. agriculture and the beef-cattle sector
The history of U.S. agriculture is dominated by a relentless march toward increased
concentration. Ever fewer numbers of farms are producing an ever larger percentage of total
agricultural output. Of the 2.2 million farms enumerated in the 2007 Census of Agriculture,
10% generate almost 85% of the value of all agricultural sales (United States Department of
Agriculture – National Agricultural Statistics Service [USDA-NASS], 2009). The remaining
90% of farms are responsible for 15% of output value. U.S. agriculture wasn’t always this
concentrated and much of the history of U.S. settlement and economic development is one
of smallholders supporting their household through agricultural production, while
generating a small marketable surplus. Technological changes occurring throughout the 19
th
and 20
th
centuries worked to increase productivity and drive down per unit production
costs; new lands and resources were brought into production, and real prices for
agricultural commodities plunged. As the relative purchasing power of raw agricultural
commodities decreased, so did farm household incomes. Extreme structural upheaval
occurred, many farms failed and millions of farm families exited agriculture. Their land was
subsequently absorbed by survivor farms which grew larger. The remaining farms were
successful as long as they managed to stay on the technology treadmill or otherwise survive
decreasing real prices for their products. Consequently, many farm households now achieve
Deploying RFID – Challenges, Solutions, and Open Issues
170
acceptable income levels as a result of non-farm income sources. One-third of all U.S. farms
have consistently negative net farm incomes and nearly 83% of total national farm
household income in 2004 originated from off-farm sources (Hoppe et al., 2007). At first
glance, it would seem that negative net farm incomes should prompt continued
outmigration of people and resources from agriculture. But, it isn’t happening.
U.S. farm-level commodity production is very diverse although 98% of U.S. farms are family
farms, organized as proprietorships, partnerships, or family corporations that do not have
hired managers (Hoppe et al., 2007). U.S. family farms range from small limited resource
operations, to the extremely large industrialized farms that account for the majority of farm-
level production. The USDA estimated that in 2004 57% of U.S. farms were retirement or
residential/lifestyle farms, and that these farms’ off-farm income as a share of total
household income was 98% (Hoppe et al., 2007). According to the USDA, rural-residential
farms account for only 7% of the value of production and include 35% of farm assets
(including land). Small farms of all types, defined as having annual sales of less than
$250,000, are 90% of farms, generate 25% of production value, and hold 68% of farm assets.
Small farms, and especially retirement and residential/lifestyle farms, tend to specialize in
the production of beef cattle, primarily cow-calf enterprises (Hoppe et al., 2007). There are
several economic reasons for this specialization, including lower labor and management
intensity (desirable to operators who are retired or who hold full-time non-farm jobs),
relatively low cash costs of beef cattle production, and favorable tax treatment.
Productivity gains in U.S. agriculture over the last century have been astounding. However,
the beef cow-calf industry is a notable exception to the productivity increases which
characterize agriculture overall. This is due to the biological limitations of bovine
reproduction. The rate of reproduction in cattle continues to be stable and low, with one
cow rarely producing more than one calf. Natural twin production continues to be an
unusual occurrence in beef cattle herds, and often results in extra production costs and/or
sterile female offspring. By comparison, the U.S. hog industry has been characterized by
steady increases in piglets/litter and litters/sow/year. Genetic advances and the adoption
of industrialized confinement production by the hog industry in the post-World War II era
led to dramatic increases in productivity, decreases in real hog prices, and industry
concentration. The lack of equivalent productivity gains in beef cattle production are
reflected in the much less drastic decrease in the real purchasing power of the calf
commodity over the last half century, and an unconcentrated cow-calf sector.
The nature of the bovine digestive system also has contributed to relatively low productivity
gains and limited adoption of capital and management intensive technologies in U.S. cow-
calf production. Land-extensive calf production processes continue to be used in much of
the cow-calf sector because the beef animal functions as a scavenger, using and transforming
low value forages produced on marginal lands into a higher-valued product. Land-
extensive production processes are generally not compatible with management intensive
technologies, adoption of which is driven by the need and opportunity to increase returns
per unit of capital and management input.
Most of the advances in technology and increases in efficiency in the beef industry have
occurred beyond the farm gate at the feeding and packing levels. The feedlot and meat
packing sectors have dramatically increased in size and concentration to achieve economies
of scale. The beef feeding sector is increasingly dominated by a small number of extremely
large operations, while the four largest beef packers controlled 84% of the market in 2007
(Hendrickson and Heffernan, 2007).
The U.S. National Animal Identification System (NAIS) &
the U.S. Beef-Cattle Sector: A Post-Mortem Analysis of NAIS
171
The beef cow-calf sector is the foundation of the beef cattle industry. Cow-calf production is
not concentrated, dispersed nationwide, and occurs in every state, with an estimated 33
million national beef cow inventory living on almost 765,000 farms and ranches (USDA-
NASS, 2009). Cow-calf operations produce the calves (or the animal frames - including
skeleton, internal organs, and hide) upon which the cattle feeding sector accumulates meat
using higher energy feed resources (usually under confinement conditions).
The USDA’s National Animal Health Monitoring System (NAHMS) divides cow-calf
producers into three groups: Those who have cow-calf herds primarily for income
objectives (14% of producers), those whose beef cow-calf operation is a supplemental source
of family income (72%), and those who keep cattle for some reason other than for providing
family income (e.g., pleasure) (14%) (USDA-APHIS, 2008b). Differences in management
practices for calving, animal health, feeding, marketing, and record keeping for different
types of cow-calf operations are statistically significant and strikingly obvious in the
NAHMS survey results (USDA-APHIS, 1998). Management of non-primary income herds is
consistently less intensive, and productivity indicators for the herds are less favorable.
The technologies used in cow-calf production have not changed greatly over the last
century, although some advances in cow-calf productivity have been made through
selective breeding, use of veterinary pharmaceuticals, and improved forage management.
Cow-calf production in the United States continues to be characterized by low entry costs,
low cash production costs, low technology requirements, and low management intensity.
Cow-calf operations also have lower exit probabilities than other farm enterprises because of
their compatibility with off-farm work (Hoppe & Korb, 2006).
The technological stability of the U.S. cow-calf industry is evidenced by the small change in
the average size of a U.S. beef cow herd over the last ~30 years (it went from 40 in 1974 to
43 in 2007) (USDA-NASS, 2009). By comparison, the average size of a U.S. milk cow herd
went from 26 in 1974 to 133 in 2007. Nationally, almost 80% of U.S. beef cow-calf operations
have fewer than 50 cows with these farms accounting for 29% of the country’s beef
cow herd.
Most research exploring U.S. cow-calf producers’ motivations has been conducted in the
West by investigators interested in rangeland management and public land policy issues.
For example, the desire to have a rural lifestyle was found to inflate the value of farms and
ranches in the West (Gosnell & Travis, 2005) while a relatively small percentage of
ranchland value can be explained by livestock income in the Southwest (Torell et al., 2005).
Gentner & Tanaka (2002) found that half of western public land ranchers earn less than 22%
of their total income from ranching, that a ranch business “profit motivation” is a relatively
low-ranked objective for all types of ranchers, and that public land ranchers are strongly
motivated to be in ranching for tradition, family, and lifestyle reasons (i.e., consumptive
objectives). Similarly, Cash (2002) noted that most U.S. beef cattle producers are not actually
in the business of farming.
The multiple roles of livestock in traditional societies have long been recognized by
anthropologists, human ecologists, and other social scientists. In traditional societies,
livestock are mobile stores of wealth and status. And even though the United States has a
very advanced economy, cattle continue to be viewed as “banks-on-the-hoof” by cow-calf
producers (Eastman et al., 2000), who say that when they “need the money” is a key factor
in determining when they market their cattle (Lacy et al., 2003). For many cow-calf
producers, cattle and the land used to produce them are investments, savings, and financial
safe-havens. Cattle provide emergency funds, and are also a stable supply of high quality
Deploying RFID – Challenges, Solutions, and Open Issues
172
meat for family consumption. Similar to their counterparts in traditional societies, cattle are
also a source of identity and a cultural touchstone for many U.S. cow-calf producers. Pope
(1987) concluded that “romance, recreation, the achievement of a desired social status, or
simply the maintenance of a family tradition” are the primary motives for many western
U.S. cattle producers. Identity objectives are financially feasible, compatible with other
lifestyle and household objectives, and are encouraged by the nation’s tax system. Lifestyle
goals, particularly the desire to live in the country, were the most highly ranked strategic
ranch goals among small-acreage livestock producers interviewed by Rowan (1994).
Technological advances, structural adjustment in response to technology, economies of size,
and the wringing out of cultural identity objectives have not occurred at the cow-calf
producer level as they occurred throughout much of U.S. agriculture in the 20
th
century. As
a result, household-level cow-calf production has maintained more of its traditional
economic, social, and cultural character than any other geographically dispersed
agricultural commodity sector in the United States today.
3. The NAIS pushback
The trend of fewer numbers of ever-larger beef feeding and packing operations throughout
the United States has led many cow-calf producers to be concerned about the structure of
the overall beef industry, the negative effects of downstream concentration, and their belief
that they are at the losing end of the structural change. Many believe that prices received by
cow-calf producers are depressed as a result of non-competitive market behavior by feeders
and packers. Domestic cow-calf producers feel threatened by the market impacts of
imported feeder cattle from Mexico and imported fed cattle from Canada. Live cattle
imports are viewed favorably by a majority of feeders and packers, who generally welcome
the flow of the animals into the U.S. market. Many in the cow-calf sector vigorously
promoted country of origin labeling (COOL) for U.S. beef. COOL was opposed by feeders
and packers as a result of their integration with the rest of the North American as well as the
global cattle-beef markets.
The schism between the cow-calf sector and the feeding and packing sectors led to the
creation of a new industry lobbying group, the Ranchers-Cattlemen Action Legal Fund,
United Stockgrowers of America (R-CALF USA). R-CALF consistently appeals to cow-calf
industry fears about trade liberalization and global market integration, property rights
erosion, loss of freedoms, and invasions of privacy. R-CALF was opposed to the NAIS. The
National Cattlemen’s Beef Association (NCBA) represents cow-calf producers, as well as
feeders and packers. In the view of R-CALF, the NCBA and the United States Department of
Agriculture do not represent the interests of “independent cattlemen.” The NCBA
publishes Beef Magazine, was very supportive of the NAIS, and was a key player in the effort
to establish a centralized, NCBA-affiliated, privately held database for animal tracking
information. In 2005 Beef Magazine reported that 76% of survey respondents said a national
system of individual animal ID and traceback was needed for health monitoring purposes,
and 63% indicated such a system should be mandatory. According to the magazine, 83% of
cattle producers who responded to their survey individually identify their cattle and 12%
use electronic ID tags. These results are very different from USDA NAHMS 2007-08 survey
results, which found that 53% of U.S. cow-calf producers use no form of individual calf
identification and less than 1% of producers use electronic ID technology (USDA-APHIS,
2009a). In 2006, the Cattle Industry Work Group (established by the USDA to develop NAIS
The U.S. National Animal Identification System (NAIS) &
the U.S. Beef-Cattle Sector: A Post-Mortem Analysis of NAIS
173
guidelines and standards for the cattle industry) declared electronic ID technology
(specifically, radio frequency identification (RFID)) as the technology to be used to
individually identify cattle under NAIS (USDA-APHIS, 2006c).
Although originally conceived as a means to deal with animal health emergencies (zoonotic
and otherwise), NAIS proponents and technology vendors consistently emphasized the
valuable management benefits to producers from individual animal identification and
performance record keeping (particularly in their RFID and electronic forms). NAIS
proponents and technology vendors have assumed that management intensification and the
tools to accomplish it are desired by producers. However, cow-calf production is an
intrinsically low-management intensity activity. It is a land-extensive activity and one where
it is often not desirable, necessary, or feasible for producers to increase management
intensity or capital investments. NAIS proponents touted individual animal identification’s
role in maintaining international market access and cattle and meat trade flows. This
justification has not been well received by cow-calf producers who believe international
trade is a threat to their industry. In their opinion, shutting off beef exports would be a small
price to pay for shutting off the live cattle imports with which they directly compete.
For the cow-calf sector, NAIS became an attempt to impose a technology mandate and
modernization on an industry where cow reproductive limitations, producer household and
personal objectives, and cattle’s efficient use of low-value forage have limited and will
continue to limit technology adoption and modernization. Much of cow-calf producer
opposition to NAIS was founded on fears that they would pay for the NAIS while the
feeding and packing sectors would benefit from animal tracking and performance
information derived from the electronic data.
Cow-calf producers’ fears about the costs of NAIS were confirmed in a 2009 USDA benefit-
cost analysis of the system (USDA-APHIS, 2009b, 2009c). The analysis concluded that beef
cow-calf operations would incur 79% of the total annual beef cattle industry cost of a fully
implemented NAIS. Given existing economies of size, the cost of an individual cow-calf
animal ID system with full traceability ranged from a low of $2.48 per head for the largest
operations to a high of $7.17 per head for the smallest operations. These data supported
NAIS opponents’ long-running contention that NAIS would benefit large agribusiness at the
expense of the smallest farming and ranching operations in the country.
4. Conclusion
A few years ago, the author of this paper was forcefully told by a USDA official that anyone
who wanted to “produce or market cattle in the United States” would have to comply with
NAIS. This official clearly did not recognize what a critical wedge issue NAIS would
become within the U.S. beef-cattle industry. He and the broad complex of government
animal health personnel, large agribusiness interests (particularly feeders and packers), and
established industry associations failed to appreciate the deep distrust many cattle
producers have of them. The proponents of NAIS also seem to have been unaware or
dismissive of the deeply ingrained socio-cultural aspects of cow–calf production and
traditional small-scale lifestyle agriculture in the United States. Although this paper focuses
on the cow-calf sector, many traditional small-scale producers of other species objected to
the NAIS using arguments similar to those of cow-calf producers.
Serious miscalculations by government officials about livestock producers and owners fed
and strengthened grassroots-level resistance to increased animal health regulations. NAIS
Deploying RFID – Challenges, Solutions, and Open Issues
174
proponents in government and the private sector sent too many conflicting messages to
NAIS skeptics. Official NAIS reports and documents that appeared on and disappeared
from the USDA’s website following criticism added to confusion, suspicion, and hostility
regarding NAIS. As a consequence, new disease management risks have been created and
the ability of the nation to effectively deal with real animal health emergencies has been
compromised. The level of suspicion created by NAIS among traditional livestock producers
led to an environment where, should a disease such as FMD arise in the United States, many
producers will not respond as they should in a true emergency. Rather, they will suspect
that a false emergency is being used to expand government control of their activities. Efforts
to implement livestock movement control, quarantine, condemnation, and depopulation
will be hampered and defied by some producers. Under these circumstances, disease
outbreaks could be catastrophic for the entire nation.
The USDA appears to have recognized the suspicions and potential for civil disobedience
within the livestock sector which resulted from the NAIS experience, as evidenced by
official statement that the new animal disease traceability framework has trust issues to
overcome (USDA-APHIS, 2010). However, memories of NAIS will negatively affect
whatever form a federally-promoted traceability framework takes in the future. Cow-calf
producers’ distrust of federal regulation and their suspicions about relationships between
large agribusiness NAIS supporters and the federal government are unlikely to moderate
under any new federal traceability program. NAIS became part of the paranoia smaller (and
many larger) producers feel about industry structure and market power relationships within
the U.S. beef-cattle sector. The USDA’s recent statements that the new traceability
framework will apply only to animals moving interstate will not mollify many cow-calf
producers, as the vast majority of beef calves produced in the United States cross state lines
at some point in their lives (even if they are first sold “locally”). Specifically, the February
2010 statement from USDA-APHIS that small producers who sell animals “to local markets”
will not be a part of the new disease traceability framework has yet to be operationally
defined.
Unfortunately, much federal and state credibility has been lost in the rush to mandate a
culturally insensitive, high technology, management-beneficial, and trade-oriented animal
identification program. NAIS represented an enormous leap in government involvement in
the beef cow-calf sector. From the beginning of NAIS, government was under the
impression that it was dealing with an “industry”; however, much of U.S. livestock
production is deeply grounded in culture and lifestyle. Expanded regulation of culture and
lifestyle choices was an uphill battle for NAIS, and will continue to be so in the future.
USDA’s unsuccessful efforts to promote NAIS as a management tool and as a means for
supporting trade carried little weight with the large percentage of non-management
intensive, non-trade oriented cow-calf producers. These producers’ concerns about
competition from U.S. imports of feeder and fed cattle aren’t going away simply because
federal animal disease traceability efforts are being renamed.
Successful animal disease management in the future will require significant rebuilding of
trust between state and federal animal health officials and grassroots-level producers. This
will require that animal health officials credibly demonstrate their independence from large-
scale agribusiness and from identification technology vendors.
Previous disease management and eradication programs (e.g., scrapie, brucellosis) haven’t
required producer investments in electronic eartags and other equipment. Furthermore, a
comprehensive, nationwide, 48-hour traceback objective probably is infeasible under any
The U.S. National Animal Identification System (NAIS) &
the U.S. Beef-Cattle Sector: A Post-Mortem Analysis of NAIS
175
existing and future technology and management assumptions, regardless of what
technology vendors say.
The USDA-APHIS announcement that future federal animal disease traceability efforts will
apply to animals moving interstate means that any new program is likely to have much in
common with NAIS. A future federally-influenced traceability program will thus encounter
resistance and disease management will be compromised because of the NAIS experience.
The loss of federal credibility and increased mistrust of government which resulted from
NAIS has made the United States beef industry vulnerable to trade barriers and
protectionism. The U.S. beef industry needs international trade, and post-NAIS, also needs
programs that assure the quality and safety of U.S. beef products to overseas buyers. The
demise of NAIS and potential cow-calf producer resistance to future government-mandated
traceability systems have created a vacuum that industry-driven quality assurance or
process verification programs can fill. In the wake of NAIS, an industry-driven system that
covers willing buyers and sellers and financially rewards specific attributes or processes will
be more successful than government regulation at holding and growing international
markets for U.S produced beef.
Even though NAIS was not implemented, animal disease hazards haven’t disappeared. In
their recent factsheet, the USDA indicated that post-NAIS animal disease management and
traceability efforts will be led by the states and tribal nations (USDA-APHIS, 2010). NAIS-
related damage control needs to be high on the agenda for state and tribal agencies
responsible for animal disease management. Whatever reservoirs of trust grassroots
livestock producers have for state- or tribal-level animal health agencies desperately need to
be refilled before new or well-known pathogens emerge to threaten livestock or human
health throughout the United States.
5. Acknowledgement
This research was supported by the New Mexico Agricultural Experiment Station, New
Mexico State University, Las Cruces, New Mexico, USA.
6. References
Beef Magazine. (2005). What You Told Us. Vol.41, No.11(July 1). 11.03.2011, Available from
Cash, J.A. (2002). Where’s the Beef? Small Farms Produce Majority of Cattle. Agricultural
Outlook. USDA Economic Research Service, pp. 21–24. 11.03.2011, Available from
Eastman, C., Raish, C. & McSweeney, A. (2000). Small Livestock Operations in Northern
New Mexico. In: Livestock Management in the American Southwest: Ecology, Society,
and Economics, R. Jemison & Raish, C., (Eds.), 523-554, ISBN 0-444-50313-7, Elsevier
Science, Amsterdam, Netherlands
Gentner, B.G. & Tanaka, J.A. (2002). Classifying Federal Public Land Grazing Permittees.
Journal of Range Management, Vol.55, pp. 2-11, ISSN 0022-409X
Deploying RFID – Challenges, Solutions, and Open Issues
176
Gosnell, H. & Travis, W.R. (2005). Ranchland Ownership Dynamics in the Rocky
Mountain West. Rangeland Ecology and Management, Vol.58, No.2, pp. 191-198,
ISSN 1550-7424
Hendrickson, M. & Heffernan, W. (2007). Concentration of Agricultural Markets April 2007.
11.3.2011, Available from
Hoppe, R.A. & Korb, P. (2006). Understanding U.S. Farm Exits. United States Department of
Agriculture Economic Research Service Report #21. 11.3.2011, Available from
Hoppe, R.A., Korb, P., O’Donoghue, E.J., & Banker, D.E. (2007). Structure and Finances of
U.S. Farms: Family Farm Report, 2007 Edition. United States Department of
Agriculture, Economic Research Service, Economic Information Bulletin #24.
11.3.2011, Available from
Lacy, R.C., Little, R.D., Forrest, C.S., & Gregory, T.L. (2003). Attitudes of Small Beef
Producers toward Selected Production and Marketing Practices. Mississippi
Agricultural and Forestry Experiment Station Bulletin 1126. Mississippi State
University. 11.3.2011, Available from
O’Brien, D. (2006). Animal Identification and the Next Farm Bill. University of Arkansas
School of Law, National Agricultural Law Center. 11.3.2011, Available from
/>newfarmbill.pdf
Pope, C.A. (1987). More Than Economics Influences the Allocation of Rangeland Resources.
Choices 4
th
Quarter, pp. 24-25
Rowan, R.C. (1994). Are Small-Acreage Livestock Producers Real Ranchers? Rangelands,
Vol.16, No.4, pp. 161-166, ISSN 0190-0528
Torell, L.A., Rimbey, N.R., Ramirez, O.A., & McCollum, D.W. (2005). Income Earning
Potential versus Consumptive Amenities in Determining Ranchland Values. Journal
of Agricultural and Resource Economics, Vol.30, No.3, pp. 537-560, ISSN 0162-1912
United States Department of Agriculture, Animal and Plant Health Inspection Service,
Veterinary Services. (1998). Importance of Income in Cow-Calf Management and
Productivity. 11.3.2011, Available from
United States Department of Agriculture Animal Plant Health Inspection Service. (2005).
National Animal Identification System Draft Strategic Plan 2005-2009. 11.3.2011,
Available from
/>tegic_plan_42505.pdf
United States Department of Agriculture Animal and Plant Health Inspection Service.
National Animal Identification System. (2006a). A User Guide and Additional
Information Resources. Draft Version. 11.3.2011, Available from
The U.S. National Animal Identification System (NAIS) &
the U.S. Beef-Cattle Sector: A Post-Mortem Analysis of NAIS
177
United States Department of Agriculture Animal and Plant Health Inspection Service.
(2006b). The National Animal Identification System: A Guide for Small-Scale or
Non-Commercial Producers. 11.3.2011, Available from
/>NonCommercial_6_2_06.pdf
United States Department of Agriculture Animal and Plant Health Inspection Services,
(2006c). National Animal Identification System Cattle Industry Work Group Report
“Executive Summary.” 11.3.2011, Available from
/>_summary_9_5_06.pdf
United States Department of Agriculture Animal and Plant Health Inspection Service.
(2007). National Animal Identification System- A User Guide and Additional Information
Resources. 11.3.2011, Available from
/>07.pdf
United States Department of Agriculture Animal and Plant Health Inspection Service.
(2008a). A Business Plan to Advance Animal Disease Traceability Through the
Harmonization of State, Federal, and Industry Programs and Convergence with the
National Animal Identification System, Version 1.0. 11.3.2011, Available from
/>pt2008.pdf
United States Department of Agriculture Animal and Plant Health Inspection Service,
Veterinary Services. (2008b). Beef 2007-08 Part I: Reference of Beef Cow-Calf
Management Practices in the United States, 2007-2008. 11.3.2011, Available from
/>f0708/Beef0708_dr_PartI_rev.pdf
United States Department of Agriculture Animal and Plant Health Inspection Service,
Veterinary Services. (2009a). Beef 2007-08 Part III: Changes in the U.S. Beef Cow-Calf
Industry, 1993-2008. 11.3.2011, Available from
/>f0708/Beef0708_dr_PartIII.pdf
United States Department of Agriculture Animal and Plant Health Inspection Service.
(2009b). Benefit-Cost Analysis of the National Animal Identification System,
January 2009, 11.3.2011, Available from
United States Department of Agriculture Animal and Plant Health Inspection Service.
(2009c). Overview Report of the Benefit-Cost Analysis of the National Animal
Identification System, April 2009 (slightly revised), 11.3.2011, Available from
United States Department of Agriculture Animal and Plant Health Inspection Service
Veterinary Services. (February 2010). Questions and Answers: New Animal Disease
Traceability Framework. Factsheet. 11.3.2011, Available from
Deploying RFID – Challenges, Solutions, and Open Issues
178
/>on/faq_traceability.pdf
United States Department of Agriculture National Agricultural Statistics Service. (2009).
2007 Census of Agriculture. 11.3.2011, Available from
10
Mine Planning Using RFID
Vladimir Konyukh
Novosibirsk State Technical University
Russia
1. Introduction
A mine is considered to be a plant that produces useful mineral with a given percentage of
ore and given quantity, whereas the cost of mining is expected to be minimum. The places
of extraction (faces) move in space and time in accordance with the extraction of a rock
mass. Mine planning is used to plot variables such as, from which places and how much
rock mass to extract, where a miner is working, and what the utilization of any machine is,
what the cost of mining is. Geological conditions for mining were determined by nature.
They are unpredictable. The environment in a mine is especially harsh: dirty, dusty, and
damp. Conditions of mining change randomly all the time.
Many technologies are used in the mining. However, any technology needs a real time data.
The data are necessary for a decision-maker to get information about extraction out of each
part of a deposit, utilization of each machine, working time of each miner, etc. The
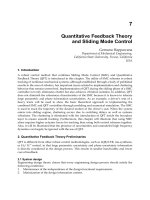
information will be used to keep cost to a minimum. For example, a diagram of an
underground ore mining is shown on the Fig.1.
Fig. 1. An example of underground ore mining: 1-drilling machine; 2- loading-haulage-
dumping machine; 3- concreting machine; 4- charging machine
Deploying RFID – Challenges, Solutions, and Open Issues
180
The roadways are developed by drilling (1) and charging (4) machines to get access to
deposits of ore. After blasting, a concreting machine (3) prepares a roadway. Other drilling
and charging machines prepare an extraction chamber. After blasting the rock mass is
transported by mobile loading- haulage-dumping machines with a bucket (2) on the
distance 30-100 meters to a dumping place.
Many questions for management are not clear enough, such as:
• how much rock mass was delivered from each face;
• what the state of each face is ;
• what condition mine machines are ;
• how long each machine is working;
• who is the driver of each machine;
• what is the utilization of each machine in the mine ;
• where is each miner at present;
• what is the distribution of mine machines in the mine.
To answer such questions, reliable sources of information are necessary.
2. Problems of mine planning
2.1 Surface mining
The shovels, which extract a rock mass, are distributed in a space. Extracted rock mass is
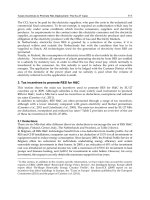
transported by trucks to refinery, storage or waste. For example, the layout of an open pit
mine is shown in Fig.2.
Fig. 2. Mining at an open pit mine
Both shovels and trucks are historically various and have a high cost. That is why the
full utilization of shovels and trucks in the system “ N shovels - M trucks” is actual for
surface mining first. It is actually for management to get current information about trucks
and shovels to improve the work of the open pit mine. There were many efforts to
determine placement of the trucks and shovels by using a Global Positioning System
(GPS), to measure the load of a truck by vibration of body, and to identify a truck by bar-
coding. Unfortunately, these ways are difficult and have many limitations for mine
planning.
A dispatcher of an open pit mine would like to get the following information:
Refiner
y
Stora
g
e
Waste
Mine Planning Using RFID
181
• ID of i-th ( i=1,M) truck;
• ID of j-th ( j=1, M) driver of the truck;
• ID of k-th ( k=1,N) shovel;
• ID of k-th ( k=1, M) of the shovel’s driver;
• ID of the dumping place;
• current load of i-th truck;
• starting point of i-th truck;
• finish point of i-th truck;
• time of i-th truck’s arrival from a known starting point;
• time of i-th truck’s departure to a known finishing point;
• quantity of fuel in a i-th truck;
• what a condition of k-th shovel ( waiting, loading of rock mass into a back, breakage) is;
• what a condition of i-th truck ( movement with rock mass, movement without rock
mass, refueling, breakage, loading, dumping, waiting) is;
• what number of trips has the i-th truck taken;
• what number of k-th shovel’s buckets were carried by i-th truck.
If the truck situated in loading zone, the shovel loads the truck by several scooping. The
number of scooping depends on many factors.
A total time of working cycle T
s
for the each machine consists of two parts:
T
s
= T
w
+ T
d
,
where T
w
=working time of k-th shovel;
T
d
= idle time of k-th shovel.
Using this information, management could get the following indices to improve the activity
of the open pit mine:
-the utilization of the i-th truck
1
1
()
Li
lw
l
i
Li
wdl
l
T
K
TT
=
+
=
=
,
where L
i
=number of trips for i-th truck;
T
w
=working time of l-th trip for the i-th truck;
T
s
= total time (including idle time) of l-th trip for the i-th truck;
-accumulated working time of i-th truck
A
i
=
1
Li
l
l
T
=
;
-the utilization of the k-th shovel
Deploying RFID – Challenges, Solutions, and Open Issues
182
1
1
()
GV
gv
gvl
k
G
wsg
g
T
K
TT
==
=
=
+
,
where g= (1,G)-number of the shovel’s working cycles;
v= (1, V) = average number of shovel’s buckets to load the i-th truck;
T
gv
=working time for v-th loading cycle;
-accumulated working time of the k-th shovel
1
GV
kgv
gvl
BT
==
=
;
-need for fuel for the i-th truck
1
L
i
l
lQq
=
=
,
where
lq = consumption for fuel for the l-th trip;
-need for energy for the k-th shovel
1
G
k
g
g
Eq
=
=
,
where
g
q = consumption for energy of the k-th shovel;
-distribution of energy between machines;
-cost of mining;
-quantity of rock mass that was extracted from various places in a deposit;
-placement of each person at mine;
-working time of each person at mine.
Thus, an on-board medium source must keep the following information about a truck (table 1).
Information Regularity Use for mine planning
ID of a truck Shift All trucks on the open pit mine
ID of a truck’s driver Shift Assigning of a driver to a truck
State of a truck Every
hour
Utilization of a truck
Quantity of fuel inside a
truck’s tank
Every
hour
Need for fuel for a truck
Working time of a truck Current Accumulated working time for maintenance
Load of a truck’s body Every trip Accumulated quantity of extracted rock mass
Place of dumping Every trip Distribution of rock mass between a refinery,
storage, and wastes
Number of a trip Every trip Comparison of a trucks’ utilization
Table 1. Information about a truck
Mine Planning Using RFID
183
Other mobile objects, such as a drilling machine, must store and transfer various
information for a dispatcher (at least the ID of a machine, its placement, its condition, and
duration of its work). Current information about the placement of each working person is
necessary for efficient management of the open pit mine.
2.2 Underground coal mining
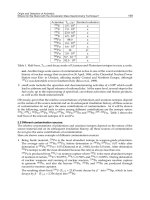
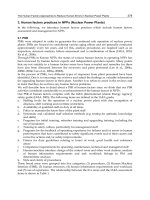
The most widespread technology of coal mining is shown on the Figure 3.
Fig. 3. Technology of coal mining at a fully - mechanized face
A shearer (1 ) extracts of a strip of coal, moving on a metal conveyor (2). At the same time,
support units (3) are drawn up a face. The metal conveyor delivers extracted coal to a
conveyor network (4). An underground train (5) is loaded under a bin (6).After loading an
underground train transports the coal to a shaft (7). Then the coal is lifted by a skip (8) to the
surface.
Many underground roadways for ventilation and transportation are inside an underground
mine. Some of them are abandoned, some roadways are in development. All roadways form
an underground network.
At present, some information about current work is transferred by a team-leader by
telephone. Objective information in real time will improve mine planning (table 2).
Planning at the mine will be more effective because new information can be acquired on the
basis of the initial data:
-utilization of j-th mobile machine at i-th face
1
1
()
G
wg
g
j
G
wsg
g
T
K
TT
=
=
=
+
,
Deploying RFID – Challenges, Solutions, and Open Issues
184
Information Regularity Use for mine planning
ID of the i-th ( i=1; n) face
All the
time
State of the mine
State of the i-th ( i=1; n) face (work, stoppage) Every hour Re-distribution of faces
Quantity of coal, that was extracted out of the
i-th face
Every shift
Comparison of faces,
output of the mine
State of k-th machine ( work, stoppage or
breakage)
Every hour
Utilization of j-th mobile
machine, timely repair
State work, stoppage, breakage of k-th
stationary machine
Every hour
Utilization of k-th
stationary machine,
timely repair
Grade of the bin’s filling
All the
time
Utilization of the bin
Placement of the underground train: on the
way to the dumping place, on the way to the
loading place, in front of the dumping place,
in front of the loading place
All the
time
Control of transportation
Condition of the underground train: under a
loading, under a dumping, movement,
waiting, breakage
All the
time
Control of transportation
ID of each miner during the working shift for
the i-th face
Twice in
the shift
Calculation of working
time, identification in
cases of accidents
ID of each miner in the various places of the
mine
Twice in
the shift
Calculation of working
time, identification in
cases of accidents
Placement of miners in the mine Every hour
Calculation of working
time, identification in
cases of accidents
Table 2. The initial data about underground coal mining
where g= (1,G)-number of the machine’s working cycles;
T
w
=working time in g-th working cycle;
T
s
= total time (including idle times) of the g-th working cycle;
-utilization of k-th stationary machine at i-th face
1
1
()
G
wg
g
k
G
wsg
g
T
K
TT
=
=
=
+
,
where g= (1, G)-number of the working cycles;
T
w =
working time for the g-th working cycle;
T
s
=total time (including idle times) of the g-th working cycle;
Mine Planning Using RFID
185
-accumulated working time of the j-th mobile machine
A
j
=
1
G
wg
g
T
=
;
-accumulated working time of the k-th stationary machine
A
k
=
1
G
wg
g
T
=
;
-need for energy for the i-th face
11
J
K
ikj
kj
Qqq
==
=+
,
where K= number of stationary machines in the i-th face;
J=number of mobile machines in the i-th face;
-distribution for energy between faces;
-time-table of trains’ movement,
-load of a train,
-number of trains for each placement of mining
-cost of mining;
-quantity of rock mass, that was extracted out of various places of a deposit;
-working time of each person at the mine.
Managers of the mine will be able to organize mining at a minimum cost.
2.3 Underground ore mining
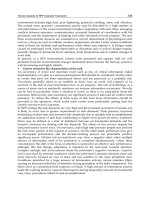
The widespread technology of ore mining by extraction chambers is shown in the Figure 4.
Fig. 4. Underground mining at an ore mine: 1- a roadway for ventilation and drilling
machine; 2- a loading-haulage-dumping machine (LHD); 3- a roadway for transportation by
LHD; 4- a dumping place; 5- an underground train; 6- a skip for lifting of rock mass; 7- shaft.
Deploying RFID – Challenges, Solutions, and Open Issues
186
First, many vertical boreholes (40-60 meters long) are drilled from a drilling roadway (1)
( Fig. 4 ). Then the boreholes are charged by explosive partially. After the blasting the ore
mass drops to the bottom of a chamber. After that, a diesel Loading-Haulage-Dumping
machine (LHD) (2) scoops the rock mass and transports it via roadway (3) for a distance 50-
100 m to a dumping place (4). Finally, an underground train (5) transports the ore mass to
the shaft (7). The rock mass is lifted by skip (6) to surface for refinery. A percentage of useful
mineral for a chamber is variable. As a rule, one is known before.
The problem is- how to distribute extraction between the chambers to ensure the given
percentage for ore mass on output of the mine. All of mobile machines are attached to the
chamber. A behavior of a chamber without extraction is unpredictable.
The following data can be extracted during current work of the mine (table 3).
After preparation of the initial data, a manager of the mine can determine:
-utilization of i-th LHD-machine for the j-th extraction chamber
1
1
()
G
wg
g
i
G
wsg
g
T
K
TT
=
=
=
+
,
where g= (1,G)-number of the machine’s working cycles;
T
w
=working time in g-th working cycle;
T
s
= total time (including idle times) of the g-th working cycle;
-utilization of k-th train
1
1
()
N
wn
n
k
N
ws
g
n
T
K
TT
=
=
=
+
,
where n= (1,N)-number of trips for k-th train;
T
v
=working time for the n-th trip;
T
f
=time of the n-th trip;
-accumulated working time of the i-th LHD-machine
A
i
=
1
G
wg
g
T
=
-accumulated working time of the k-th train
A
k
=
1
N
wn
n
T
=
;
-need for fuel for the
i-th LHD-machine
1
G
i
g
g
Q
q
=
=
,
where
q
g
=fuel consumption for g-th trip of i-th LHD-machine;
Mine Planning Using RFID
187
Information Regularity Use for mine planning
ID of the i-th ( i=1; n) mobile machine Start of the
shift
Consideration of
machines,
ID of the driver on i-th ( i=1; n) mobile machine Start of the
shift
Consideration of drivers,
permission for driving
Placement of the i-th ( i=1; n) mobile machine All the time Control of mining
State of j-th mobile machine: work, stoppage or
breakage
All the time Utilization of the
machine
State ( work, stoppage, breakage) of k-th
stationary machine
All the time Utilization of the
machine
Quantity of rock mass that was extracted out of
a
j-th chamber for the trip of the i-th ( i=1; n)
mobile machine
Each trip Output of the
i-th ( i=1;
n
) mobile machine
Quantity of rock mass, that was delivered to a
dumping place after a trip of LHD
Each trip Calculation of rock mass
Total quantity of rock mass that was extracted
out of a
j-th extraction chamber
Finish of the
shift
Output of the mine
Grade of the bin’s filling All the time Utilization of the bin
State of the underground train : loading,
movement to the shift , movement to the bin ,
dumping, breakage
All the time Utilization of the train
ID of a miners in the various places of the mine Start and
finish of the
shift
Calculation of working
time, identification in
case of accident
Placement of miners in the mine Every hour Calculation of working
time, identification in
case of accident
ID of a miners in the j-th face Start and
finish of the
shift
Calculation of working
time, identification in
case of accident
Quantity of explosive that was expended for the
j-th extraction chamber
After blasting Need for materials
Percentage of dangerous gases inside the j-th
extraction chamber
All the time Danger warning
Placement of the underground train: on the way
to the dumping place, on the way to the loading
place, in front of the dumping place, in front of
the loading place
All the time Control of transporting
ID of the train on the mine Start of the
shift
Utilization of the train
State of the underground train: under a loading,
under a dumping, movement, waiting, breakage
All the time Control of transporting
Volume of fuel for i-th ( i=1; n) mobile machine All the time Need for fuel for the i-th
(
i=1; n) mobile machine
Table 3. The initial data about underground ore mining
Deploying RFID – Challenges, Solutions, and Open Issues
188
-distribution for fuel for LHD-machine between places of extraction;
-time-table of train movement,
-load of a train,
-dynamics of rock mass extraction out of the j-th extraction chamber;
-number of trains needed for each place of mining;
-cost;
-quantity of rock mass extracted from various places in a mine;
-working time of each person at mine.
As a result, the more effective work, e.g. a redistribution of LHD-routes can be organized
according to the concentration of desirable minerals in various places of the deposit.
2.4 Delivery of supplies to distributed underground faces
The distributed faces need the various supplies from the surface to continue mining. At
present, a number of supplies loads, such as support units, are delivered from surface
storage to a face with the aid of a shaft dropping, transporting by underground rail train,
and transporting by winches (Fig.5).
Fig. 5. Existing delivery of loads to distributed faces: 1- underground storage; 2-rail train; 3-
winches
1
2
3
3
3
3
3
Surface storage
Mine Planning Using RFID
189
The disadvantage of such delivery is the long delay in delivery of supplies to a face. Besides,
subjective mistakes for distribution of supplies between faces take place. Underground faces
move all the time. A limited space and movement of a face do not permit to have an own
storage for a face. Equipping of supplies by medium sources makes it possible, to ensure a
face by necessary supplies in “Just-In-Time”- mode (Krieg, 2005).
3. Mobile objects in mining
Moving mine faces require mobile objects. Let’s describe some peculiarities of such objects
from the point-of-view of mine planning.
It is necessary to know where each miner is in real-time. Consequently, each miner must
have an ID. Many ID-readers must be distributed on the pathways miners and connected
to the surface via an information network. Mine machines and dangerous places must
determine the ID of a miner. Every miner must wear a helmet (hard hat) ( Fig. 6 ).
Fig. 6. A miner as a mobile object for mine planning
A helmet is the most suitable place for a medium source that must be cheap, light, and
stable to harsh environment. Its capacity may be small. A mine has up to 1000 miners. In
underground mining, every miner has a lamp with a battery pack in addition to a helmet.
A truck moves on the fixed road during surface mining (Fig.7). To make a decision about a
distribution of trucks, a dispatcher would like to know ID of a machine, ID of a driver, a fuel
need, time of loading, movement, and dumping, start and finish points of movement,
current load, and placement on a pit mine, and state of a truck. A medium source will work
in harsh conditions, with natural temperature, under metal environment. An open pit mine
has until 50 trucks.
(a) (b)
Fig. 7. A truck for surface mining: a- without rock mass; b- with rock mass
Deploying RFID – Challenges, Solutions, and Open Issues
190
There are many mobile machines for underground mining, such as a Loading-Haulage-
Dumping Machine (Fig. 8).
Fig. 8. Loading-Haulage-Dumping Machine as an example of mine machine for
underground ore mining
An underground mine has up to 50 such machines. As a rule, a Loading-Haulage-Dumping
machine has a diesel drive and rotating bucket.
A surface dispatcher would like to know ID of the machine, ID of the driver, current fullness
of the bucket, the fuel need of each truck, current placement and state of each machine, time
for each trip. An on-board medium source should work in metal environment and harsh
conditions.
4. Identification of mobile objects
Like identification of mobile objects in industry, such decision is the obvious application of
miners’ identification (Wilma’s, 2009). A miner has an own transponder, that is placed on a
miner’s helmet or on a battery pack (Fig. 9).
Fig. 9. Identification of a miner
A transponder can be used for identification of other mobile objects. ID of an object is
written into a transponder. Stationary RFID-readers with RFID- antennas are connected
with the information network and placed in various points of a working zone. If a mobile
object moves near an RFID-antenna, the data about his ID and placement have been
introduced into the information network (Fig. 10).
RFID-reader
Information network
Transponder
on a helmet
Mine Planning Using RFID
191
Fig. 10. Information accompaniment of a mobile object
It makes it possible to determine the time of arrival to working place; time of work’s finish,
placement of a miner at present; give permission for control of a machine.
Additional information can be derived on the basis of the data:
•
how long did each miner work?
•
where is a miner after his shift?
•
how long was each machine used?
•
by which miner was driven each machine?
•
was access to the machine permitted for the miner?
•
who is left in an emergency zone at present?
This information makes it possible to discover the placement of any miner, calculate his
working time, and identify a miner in case of accident. The decision could be applicable also
for other mobile objects in mining (Spadavecchia, 2007).
An RFID-reader can read a
vehicle’s ID and switch a color-light signal in front of a crossroads. Many RFID-readers on
the way of a vehicle can form its route.
5. Requirements to medium sources for mine planning
Many peculiarities of mining make special demands on medium sources.
A transponder for surface mining will be able to work in a natural temperature ranging
from -50 ° C up to +50° C. A transponder for underground mining will be able to work in a
temperature ranging from 0° C up to + 50° C.
Mostly an underground roadway is up to 4 meters wide. That is why the distance between a
mobile object and an antenna is up to 3. 5 meters. The same distance is required for surface
mining.
Mine environment is especially damp, dusty, and dirty. An on-board medium source will be
able to work in metal environment with electromagnetic violence.
Mostly mobile machines work individually. That is why anti-collision prevention is
necessary for miners mainly. However, sometimes it is necessary to determine, how many
machines are situated together, e.g. inside a repair shop.
A transponder to identify a mobile object must keep information about the ID of the object
only. It is enough to have a capacity app. 1 Kb.
Mobile object
On-board
transponder
RFID-
antenna
RFID-reader
Information network