Báo cáo hóa học: " Epidemiology of foot-and-mouth disease in Landhi Dairy Colony, Pakistan, the world largest Buffalo colony" pptx
Bạn đang xem bản rút gọn của tài liệu. Xem và tải ngay bản đầy đủ của tài liệu tại đây (2.05 MB, 16 trang )
BioMed Central
Page 1 of 16
(page number not for citation purposes)
Virology Journal
Open Access
Research
Epidemiology of foot-and-mouth disease in Landhi Dairy Colony,
Pakistan, the world largest Buffalo colony
Joern Klein
1,2
, Manzoor Hussain
3
, Munir Ahmad
3
, Muhammad Afzal
4
and
Soren Alexandersen*
1
Address:
1
National Veterinary Institute, Technical University of Denmark, Lindholm, DK-4771 Kalvehave, Denmark,
2
Norwegian University of
Science and Technology, Faculty of Medicine, Department of Cancer Research and Molecular Medicine, N-7489 Trondheim, Norway,
3
Food and
Agriculture Organization of the United Nations – Pakistan, NARC, Park Road, PK-45500, Pakistan and
4
Ministry of Food, Agriculture & Livestock
Pakistan, Livestock wing, PK-44000, Pakistan
Email: Joern Klein - ; Manzoor Hussain - ; Munir Ahmad - ;
Muhammad Afzal - ; Soren Alexandersen* -
* Corresponding author
Abstract
Background: Foot-and-mouth disease (FMD) is endemic in Pakistan and causes huge economic
losses. This work focus on the Landhi Dairy Colony (LDC), located in the suburbs of Karachi. LDC
is the largest Buffalo colony in the world, with more than 300,000 animals (around 95% buffaloes
and 5% cattle, as well as an unknown number of sheep and goats).
Each month from April 2006 to April 2007 we collected mouth-swabs from apparently healthy
buffaloes and cattle, applying a convenient sampling based on a two-stage random sampling scheme,
in conjunction with participatory information from each selected farm. Furthermore, we also
collected epithelium samples from animals with clinical disease, as well as mouth-swabs samples
from those farms. In addition, we analysed a total of 180 serum samples randomly collecting 30
samples each month at the local slaughterhouse, from October 2006 to March 2007.
Samples have been screened for FMDV by real-time RT-PCR and the partial or full 1D coding
region of selected isolates has been sequenced. Serum samples have been analysed by applying
serotype-specific antibody ELISA and non-structural proteins (NSP) antibody ELISA.
Results: FMDV infection prevalence at aggregate level shows an endemic occurrence of FMDV in
the colony, with peaks in August 2006, December 2006 and February 2007 to March 2007. A
significant association of prevalence peaks to the rainy seasons, which includes the coldest time of
the year and the muslimic Eid-festival, has been demonstrated.
Participatory information indicated that 88% of all questioned farmers vaccinate their animals.
Analysis of the serum samples showed high levels of antibodies for serotypes O, A, Asia 1 and C.
The median endpoint-titre for all tested serotypes, except serotype C, in VNT titration is at a
serum dilution of equal or above 1/100.
All 180 serum samples collected have been tested for antibodies against the non-structural proteins
and all but four have been found positive.
Published: 29 April 2008
Virology Journal 2008, 5:53 doi:10.1186/1743-422X-5-53
Received: 11 February 2008
Accepted: 29 April 2008
This article is available from: />© 2008 Klein et al; licensee BioMed Central Ltd.
This is an Open Access article distributed under the terms of the Creative Commons Attribution License ( />),
which permits unrestricted use, distribution, and reproduction in any medium, provided the original work is properly cited.
Virology Journal 2008, 5:53 />Page 2 of 16
(page number not for citation purposes)
Out of the 106 swab-samples from apparently healthy and affected animals positive in real-time RT-
PCR, we sequenced the partial or full 1D coding region from 58 samples. In addition we sequenced
the full 1D coding region of 17 epithelium samples from animals with clinical signs of FMD. From
all sequenced samples, swabs and epithelium, 19 belong to the regional PanAsia II lineage of
serotype O and 56 to the A/Iran/2005 lineage of serotype A.
Conclusion: For an effective and realisable FMD control program in LDC, we suggest to introduce
a twice annually mass vaccination of all buffaloes and cattle in the colony. These mass vaccinations
should optimally take place shortly before the beginning of the two rainy periods, e.g. in June and
September. Those vaccinations should, in our opinion, be in addition to the already individually
performed vaccinations of single animals, as the latter usually targets only newly introduced animals.
This suggested combination of mass vaccination of all large ruminants with the already performed
individually vaccination should provide a continuous high level of herd immunity in the entire
colony.
Vaccines used for this purpose should contain the matching vaccine strains, i.e. as our results
indicate antigens for A/Iran/2005 and the regional type of serotype O (PanAsia II), but also antigens
of the, in this world region endemic, Asia 1 lineage should be included.
In the long term it will be important to control the vaccine use, so that subclinical FMD will be
avoided.
Background
Foot-and-mouth disease (FMD) is a highly contagious
and economically important disease caused by foot-and-
mouth disease virus (FMDV). Animals that can be affected
include cattle, buffaloes, sheep, goats, pigs and wild rumi-
nants [1]. FMDV is a positive sense, single-stranded RNA
virus (genus Aphthovirus, family Picornaviridae) occurring
in seven serotypes, O, A, C, Asia 1, SAT 1, SAT 2 and SAT
3, each with a wide spectrum of antigenic and epidemio-
logical distinct subtypes. The wide diversity is considered
a consequence of the high mutation rate, quasi-species
dynamics and recombination [2,3].
FMD is endemic in Pakistan [4] and causes huge eco-
nomic losses to commercial cattle and buffalo owners.
According to the Food and Agriculture Organization of
the United Nations (FAO) there are no proper arrange-
ments for providing vaccine to the farmers and the open
market is flooded with uncontrolled vaccine of doubtful
efficiency [5].
FMD is considered endemic with the serotypes O, A and
Asia 1 in both Pakistan [6] and the neighbouring coun-
tries of India, Afghanistan, Iran and China [7-9] and those
serotypes are a continued problem in Pakistan.
According to the OIE HandiSTATUS [10] Pakistan consid-
ers itself as having a seasonal, low-level, sporadic occur-
rence of FMD (Pakistan reported around 10–30 outbreaks
per year until year 2000 after which no information is
available). Animals are only vaccinated upon request and
the yearly number of vaccine doses used varies between
12,000 to 95,000 doses for cattle and 7,000 to 60,000 for
buffaloes in the years from 1997–2002 (no data available
after 2002) [10]. This amount of vaccine is likely in addi-
tion to an unknown amount of open market, uncon-
trolled vaccines, but is nevertheless not much considering
that Pakistan has a population of 51,1 million cattle, 56,9
million buffaloes, 50,3 million sheep and 123,9 million
goats [4].
The majority of commercial dairy farmers are vaccinating
their animals against FMD, either with imported trivalent
vaccine, e.g. Aftovax (Merial, France), or with a locally
produced monovalent vaccine (serotype O) [6].
Major challenges to control FMD in Pakistan relate, in
part, to the lack of sufficient resources for diagnosis and
continuous FMD genotype surveillance, but also the diffi-
culties of controlling the vaccine market, as well as the
lack of basic biosecurity awareness and control of animal
movements. The latter is also hampered by the annual
religious festival Eid ul-Azza, where thousands of buffa-
loes, cattle and small ruminants are transported across the
country.
The present work focuses on the Landhi Dairy Colony
(LDC), located in the suburbs of Karachi in the Sindh
province of South-Pakistan. LDC is the largest dairy col-
ony in Pakistan and the largest Buffalo colony in the
world. It was established in 1959 within an area of 752
acres (incl. 250 acres for roads, shops and other facilities)
for 15,000 animals, but there are now more than 300,000
dairy animals (> 95% buffaloes) on approximately 2000
farms and an unknown number of sheep and goats, which
are freely running around in the whole colony. This over-
Virology Journal 2008, 5:53 />Page 3 of 16
(page number not for citation purposes)
load, and unclear land ownership leads to hygiene and
environmental problems. The majority of the milking ani-
mals in LDC are kept only for one lactation phase and
consequently approximately 10–12% of the population is
replaced every month.
After the lactation period the majority of the animals are
sold to breeders or for slaughter and only a few are kept by
the dairy farmers for re-breeding. Most of the animals are
brought to and from the animal rich districts of Punjab
and Sindh provinces.
Previous studies employing participatory epidemiology
indicated a relatively high annually FMD prevalence
between 41% and 50% in the southern Sindh region
around Karachi [6].
To develop an effective vaccination strategy it is crucial to
understand the dynamic of the disease and thereby indi-
cating the best time points of administering the vaccine.
Thus, individually vaccination is already performed on
the large ruminant population, but with vaccines of varia-
ble quality and efficiency, it is likely that the majority of
potential FMDV infections are subclinical and therefore
not recognised. From April 2006 to April 2007 we col-
lected monthly a number of mouth-swabs from appar-
ently healthy buffaloes and cattle, applying a convenient
sampling scheme based on a two-stage random sampling
setup, in conjunction with participatory information from
each selected farm. The total number of collected samples
was 960 mouth-swabs from 124 farms.
Furthermore, we collected epithelium samples from clini-
cally affected animals as well as mouth-swab samples
from farms with a recent FMD outbreak, and 180 serum
samples collected from slaughtered animals in the period
from October 2006 to March 2007. The collection of
probang and blood samples from living cattle or buffaloes
was considered not possible due to socio-religious rea-
sons.
Samples have been screened for FMDV by real-time RT-
PCR [11,12] and the partial 1D coding region of selected,
FMDV positive isolates, has been sequenced. In addition,
the full 1D coding region of a locally produced monova-
lent vaccine (serotype O) has been sequenced to examine
the relatedness of vaccine strain to the circulating serotype
O lineages. Serum samples have been analysed by apply-
ing serotype O, A and Asia 1 specific antibody ELISA [13]
and non-structural proteins (NSP) ELISA [14].
This work will help to develop an appropriate vaccination
strategy for Pakistan's largest dairy colony, including the
choice of the best matching vaccines, as well as helping to
improve our understanding of the epidemiology of FMD.
Results
Infection prevalence
We randomly selected farms in LDC and took swab sam-
ples from randomly selected animals for a subsequently
screening for FMDV genome by real-time RT-PCR. We
aimed to get information from farms where no animals
with clinical signs of FMD were present, judged by per-
sonal examination or by examination done by the local
veterinarians and information from the respective farmer.
If there has been at least one animal showing either acute
FMD or healing FMD lesions, we excluded those farms
from the FMDV infection prevalence analysis at aggregate
level and calculated the within-farm prevalence separately
for detecting potential FMDV prevalence differences.
Table 1 shows the prevalence of each FMDV infection-
positive farm, without any signs of clinical FMD, per
month in relation to the farm population. Confidence
intervals were calculated for a normal distributed popula-
tion without finite population correction factor. This
means that some confidence intervals related to a very
small sample size or extreme point estimates are doubtful
(shown in grey in Table 1). However, we believe that the
shown point estimates, i.e. prevalence values, are reliable
and that the shown confidence intervals give useful, addi-
tional information. The mean prevalence for those farms
with PCR-positive animals that were randomly selected
and without animals showing clinical signs of FMD, is
19.2% (SE 3.99%). Table 2 shows the prevalence for each
infection positive found farm per month on which during
the sampling, animals with healing FMD lesions were
detected. The mean prevalence here is 53.9% (SE
15.08%). Applying t-test statistics demonstrate that the
mean prevalence in the latter group was significant higher
than in the farms where no animals with healing lesions
were detected. The t-statistic for H
1
(mean prevalence on
farms with animals with healing FMD lesions > preva-
lence on farms without animals with healing FMD
lesions) at the 0.05 critical alpha level, t(22) = 3.17, p=
0.0022. For farms with ongoing FMD, i.e. at least one ani-
mal show signs of acute FMD, a mean prevalence of 87%
could be detected (Table 3). As swab samples for the latter
were only collected in April 2006 from two farms with
acute FMD, the sample size was considered to be too low
to allow a meaningful statistical analysis. However, the
FMDV prevalence in these two farms appeared higher
than in the farms containing animals with healing lesions.
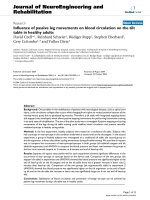
Figure 1 displays the FMDV infection prevalence at aggre-
gate level from April 2006 to April 2007, based on the
number of inapparently infected animals found in a two-
stage sampling scheme. The farm-level (herd-level) preva-
lence reflects the number of farms with positive animals,
calculated as the proportion of Σ farms with infected ani-
mals per month to Σ farms sampled per month, and the
Virology Journal 2008, 5:53 />Page 4 of 16
(page number not for citation purposes)
Table 1: Prevalence for each FMDV infection positive found farm per month in relation to the farm population
Month [total number of farms sampled] Farm ID. total farm Population sampled infected Prevalence l. CI u. CI
April 2006 [18] 3 1500 13 1 8% 0% 22%
7-9667%36%97%
8 250 9 1 11% 0% 32%
11 360 9 1 11% 0% 32%
15 200 9 1 11% 0% 32%
May 2006 [7] 3 193 6 6 100% 100% 100%
August 2006 [9] 1 197 3 3 100% 100% 100%
2 131 3 1 33% 0% 87%
3 46 3 3 100% 100% 100%
4 140 3 2 67% 13% 100%
5 143 3 2 67% 13% 100%
6 370 3 1 33% 0% 87%
7 58 3 1 33% 0% 87%
8 55 3 1 33% 0% 87%
9 63 3 3 100% 100% 100%
September 2006 [19] 5 145 6 4 67% 29% 104%
61451218%0%24%
7 110 9 2 22% 0% 49%
10 190 9 1 11% 0% 32%
12 70 9 1 11% 0% 32%
October 2006 [5] 3 150 5 1 20% 0% 55%
November 2006 [5] 5 260 6 1 17% 0% 46%
December 2006 [5] 2 - 5 1 20% 0% 55%
3 700 6 6 100% 100% 100%
4 90 6 4 67% 29% 100%
5 196 5 3 60% 17% 100%
January 2007 [17] 2 120 10 2 20% 0% 45%
7 107 9 1 11% 0% 32%
8 143 20 8 40% 19% 61%
9 272 10 1 10% 0% 29%
11 111 9 1 11% 0% 32%
13 214 10 1 10% 0% 29%
17 505 9 1 11% 0% 32%
February 2007 [5] 1 266 6 1 17% 0% 46%
2 162 6 5 83% 54% 100%
3 124 6 4 67% 29% 100%
4 372 6 2 33% 0% 71%
5 266 6 5 83% 54% 100%
March 2007 [5] 1 150 6 5 83% 54% 100%
2 175 6 3 50% 10% 90%
3 65 6 2 33% 0% 71%
4 80 6 2 33% 0% 71%
5 122 6 3 50% 10% 90%
April 2007 [17] 1 205 9 1 11% 0% 32%
12 145 9 2 22% 0% 49%
15 122 9 1 11% 0% 32%
Confidence intervals were calculated for a normal distributed population without finite population correction factor. This means that some
confidence intervals related to very small sample size or extreme point estimates are doubtful (shown in grey).
Virology Journal 2008, 5:53 />Page 5 of 16
(page number not for citation purposes)
animal-level prevalence reflect the number of FMDV pos-
itive found animals within the sampled population, cal-
culated as the proportion of Σ animals infected per month
to Σ animals sampled per month (see also additional file
1). Both prevalence values are shown with the exact bino-
mial confidence interval, a method using the cumulative
probabilities of the binomial distribution and therewith
expressing the situation in the whole LDC. Both measures
show an endemic, frequent occurrence of FMD in the col-
ony, with peaks in August 2006, December 2006 and Feb-
ruary 2007 to March 2007. In conformity with the
prevalence, the precipitation peaks in August, December,
February and March. Applying the Pearson-correlation
statistics for animal-level prevalence to precipitation dem-
onstrates a significant association, with a correlation coef-
ficient ρ = 0.57 and the t-statistic for H1 (ρ > 0) at the 0.05
critical alpha level, t(11) = 2.27, p= 0.021.
Moreover, the moving average analysis (Figure 1), which
removes random variations within the point estimates,
show an appreciable increase from December 2006 to
March 2007, expressing the cumulative effect of the sec-
ond rain season, the Eid ul-Azza festival and possibly the
slightly cooler temperature during this period. The tem-
perature in Karachi between April 2006 and April 2007
ranged between 20°C and 30,5°C.
Participatory information
During sampling the owners of the farms have been inter-
viewed with regard to their FMD vaccine practice. Table 4
shows that 88% of all questioned farmers vaccinated their
animals. Of those, 79% were using the trivalent Aftovax-
vaccine (Merial, France) and 9% the local monovalent
(serotype O) vaccine. Four percent of the farmers were
vaccinating their animals on regular basis twice a year,
whereas the majority of the farmers vaccinated only the
new entrants to the farm. All interviewed farmers, which
vaccinated their animals, administered the vaccine only
once and not as recommend with an additional booster
vaccination two to six weeks after the initial vaccination.
Sero-surveillance
From October 2006 to March 2007 we collected monthly
serum samples from 30 randomly selected Asian Buffa-
loes in LDC at the local slaughter house, immediately after
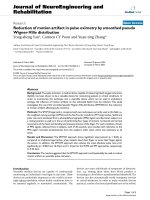
the death of the animals. Figure 2 shows the results of the
antibody ELISA for those 180 samples per month and
serotype. The data for serotype O shows a high amount of
antibodies (low ODP) for the whole period of time, with
a small variance of measured values. The same is true for
serotype A.
In our analysis antibodies against serotypes Asia 1 and C,
show generally a higher variance per month than those
against the other serotypes, but the Median for each
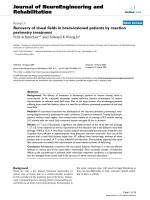
month is clearly positive (Figure 2). All 180 samples have
been the tested for antibodies against the non-structural
proteins of FMDV and all but four have been found posi-
tive (Figure 3 and additional file 2).
Figure 3 shows the distribution of all 180 collected serum
samples per serotype at a serum dilution of 1/5. A high
antibody response (ODP < 10) can be seen for serotypes
A and O and against the non-structural proteins (NSP).
The median for the antibody response against Asia 1 has
an ODP value of 12 and against serotype C of 18 respec-
tively.
We randomly selected ten serum samples to determine
the highest serum dilution that gives a positive signal in
ELISA for each serotype (Figure 4). The Median for all
tested serotypes, except for serotype C, is positive with a
serum dilution of 1/320. Some tested sera are still positive
at a dilution 1/640 and above. The highest serum dilution
that gives a positive signal for serotype C is 1/40
(Median). The calculated ODP means for the serotypes O,
A and Asia1 are at a 1/5 serum-dilution 9 (σ = 4), 6 (σ =
1), 8 (σ = 6), and those result in an endpoint-titre of 1/
320, with a standard deviation of one twofold dilution
step. For serotype C the calculated ODP mean at a 1/5
serum-dilution is 20 (σ = 2), resulting in an endpoint-titre
of 1/40, with a standard deviation of one dilution step.
Furthermore we determined for those ten selected serum
samples the endpoint-titre in virus neutralisation for each
serotype (Figure 5). Generally; the virus neutralisation
titres are consistent with the results of the ELISA titration.
The Median for all tested serotypes, except for serotype C,
has an endpoint-titre of equal or above 1/100. VNT anal-
ysis for serotype O isolates displays a relative small vari-
ance with a Median of approximately 1/100. Serotype A
isolates display the highest variance, but with a Median of
Table 2: Prevalence for each infection positive found farm per month on which during the sampling, animals with healing FMD lesions
were detected
Month Farm ID. total farm Population sampled infected Prevalence l. CI u. CI
April 2006 21 180 9 8 89% 68% 100%
March 2006 22 120 10 2 20% 0% 45%
September 2006 5a 145 6 4 67% 29% 100%
January 2007 17 - 20 8 40% 19% 61%
Virology Journal 2008, 5:53 />Page 6 of 16
(page number not for citation purposes)
1/260. For Asia 1 isolates the Median is 1/280, displaying
a medium variance compared to the others, and for C 1/
50, with a very small variance.
Phylogenetic analysis
Out of the 106 FMDV positive swab-samples from ani-
mals with and without clinical signs it was possible to
sequence the partial or full 1D coding region, which
encodes for the immuno-dominant VP1 surface protein,
from 58 samples. In addition we sequenced the full 1D
genome region of 17 epithelium samples collected during
2006, mainly from LDC, but also some from outside LDC
and from farms around Islamabad. From all sequenced
samples, 19 belong to serotype O, hereof ten epithelium
samples, and 56 to serotype A, hereof seven epithelium
samples.
Figure 6 shows the unrooted phylogenetic tree of the Paki-
stani serotype O isolates in relation to similar serotype O
sequences, published in Genbank. The serotype O isolates
Table 3: Prevalence for farms with ongoing FMD
Month Farm ID. total farm Population sampled infected Prevalence l. CI u. CI
April 2006 3A 269 9 8 89% 68% 100%
April 2006 7A 121 20 17 85% 69% 100%
FMDV infection prevalence at aggregate levelFigure 1
FMDV infection prevalence at aggregate level. The farm-level (herd-level) prevalence reflects the number of farms with
FMDV infection positive found animals and the animal-level prevalence reflect the number of FMDV infection positive found
animals within the sampled population. Both prevalence values are shown with the exact binomial confidence interval. Further-
more, the moving average (SMA) for both measures is displayed and the date of Eid ul-Azza is indicated. In the lower panel
temperature and precipitation measured in Karachi in the period of April 2006 to April 2007 is displayed.
0
10
20
30
40
50
60
70
80
90
100
April 2006 May 2006 June 2006 July 2006 August 2006 September
2006
October 2006 November
2006
December
2006
January 2007 February 2007 March 2007 April 2007
farm-level
prevalence
animal-level
prevalence
2 per. Mov. Avg.
(farm-level
prevalence)
2 per. Mov. Avg.
(animal-level
prevalence)
Eid ul-Azza
31/12/2006
0
5
10
15
20
25
30
35
April 2006 May 2006 June 2006 July 2006 August 2006 September
2006
October 2006 November
2006
December
2006
January 2007 February 2007 March 2007 April 2007
0
20
40
60
80
100
120
140
160
temperature
precipitation
%
°C
mm
Virology Journal 2008, 5:53 />Page 7 of 16
(page number not for citation purposes)
from the Pakistan cluster are monophyletic, i.e. share a
common ancestor. The most related isolates originate
from Bhutan/Nepal, collected between 2003 and 2004.
The latter belong to a new PanAsia lineage described by
the OIE/FAO World Reference Laboratory for Foot-and-
Mouth Disease in 2007 and designated PanAsia II [15].
Figure 7 shows a subtree of serotype O, containing only
sequences from Pakistan, Bhutan, Nepal and one from
Malaysia. This phylogram shows the close relationship
between the isolates from Bhutan/Nepal and Pakistan.
Noticing the small branch lengths, it is remarkably that
the sequence derived from the local-monovalent O vac-
cine is placed in very close relation to samples derived
from infected animals. Figure 8 displays the deduced
Table 4: Vaccine use on all questioned farms
No. Farms vaccinating local mono-valent (O) vaccine Aftovax
©
other vaccine unknown not vaccinating
127 112 11 101 1 4 10
Percent → 88 9 79 1 3 8
The second line represents percent either in relation to the number of total questioned farms (vaccinating = 88%) or to the number of vaccinating
farms.
Descriptive statistics of the antibody ELISA for samples per month and serotypeFigure 2
Descriptive statistics of the antibody ELISA for samples per month and serotype. Box-and-whisker diagram of the
measured optical density percent (ODP) per month and serotype. Showing the smallest observation, lower quartile (Q1),
median, upper quartile (Q3), and largest observation. In addition outliers according their interquartile range (IQR) and means
are displayed. Each circle represents the measured ODP of a sample. The red line represents the threshold for each serotype,
i.e. samples are considered negative if the ODP is for O >= 50, for A >= 45, for Asia 1 >= 35 and for C >= 35.
0
20
40
60
80
100
october 2006 november 2006 december 2006 january 2007 february 2007 m arch 2007
ODP
0
20
40
60
80
100
october 2006 november 2006 december 2006 january 2007 february 2007 march 2007
0
20
40
60
80
100
120
october 2006 novem ber 2006 decem ber 2006 januar y 2007 february 2007 march 2007
Outlier Box plot
Mean
Connected Means
Outliers > 1.5 and < 3 IQR
Outliers > 3 IQR
A
c
Asia 1
O
October 2006 November 2006 December 2006 January 2007 February 2007 March 2007
October 2006 November 2006 December 2006 January 2007 February 2007 March 2007
October 2006 November 2006 December 2006 January 2007 February 2007 March 2007
negative
positive
negative
positive
negative
positive
negative
positive
ODP
ODP
ODP
ODP
0
20
40
60
80
100
120
140
October 2006 November 2006 December 2006 January 2007 February 2007 March 2007
Virology Journal 2008, 5:53 />Page 8 of 16
(page number not for citation purposes)
amino acid sequence of the partial VP1 sequence of the
serotype O isolates and related sequences from Malaysia,
Bhutan and Nepal. There is a very high amino acid conser-
vation between those isolates, even as they are collected
during a time range from 2003 to 2006. However, the
Pakistan isolates are clearly distinct to the isolates from
Malaysia, Bhutan and Nepal at residues 143 and 200. Res-
idue 143, located four amino acids before the RGD motif
in the GH-loop, in the Pakistan isolates contain a histi-
dine, whereas the others, similar to the majority of other
published serotype O sequences, have a proline at this
position; thus proline has a cyclic ring and its presence
creates a fixed kink in a protein chain, its presence lead to
a change in the secondary structure. Furthermore, residue
200 in the isolates from Pakistan contains asparagine
instead of serine, as the majority of other published sero-
type O sequences.
Figure 9 shows the phylogram of the serotype A isolates.
All Pakistani isolates belong to the recent discovered A/
Iran/2005 lineage. The branch lengths here are, typically
for serotype A, larger than those of serotype O.
Virulence and host species
It has been shown previously that of those animals in this
study infected with the FMDV A/Iran/2005 lineage, the
majority of clinically affected animals are cattle [16].
Regarding the FMDV type O infected animals; six of ten
epithelium samples from clinically affected animals are
from buffaloes and only one of seven subclinically
infected animals originate from cattle. This displays the
LDC population of more then 95% Asian Buffaloes and
indicates an equal distribution of serotype O caused clin-
ical FMD between bovine and buffalo species. In contrast
to the A/Iran/2005 lineage, where the occurrence of clini-
cal FMD seems to be host species dependent, is there no
indication of host species dependence in the serotype O
caused outbreaks.
Discussion
Landhi Dairy Colony contains a relatively high propor-
tion of vaccinated cattle and buffaloes (Table 4). How-
ever, the vaccination is mainly performed once and
mainly on newly introduced animals. Within such a pop-
ulation a high FMDV challenge, with the vaccine covered
sero/sub-type, against animals with a high immunity or a
low challenge in animals with low vaccine titres, may
Descriptive statistics of the ELISA results for all samples at a serum dilution of 1/5Figure 3
Descriptive statistics of the ELISA results for all samples at a serum dilution of 1/5. Box-and-whisker diagram of the
measured optical density percent (ODP). Showing the smallest observation, lower quartile (Q1), median, upper quartile (Q3),
and largest observation. In addition outliers according their interquartile range (IQR) are displayed. Each circle represents the
measured ODP of one sample.
0
20
40
60
80
100
120
140
160
180
200
OAAsia 1CNSP
ODP
Outlier Boxplot
Outliers > 1.5 and < 3 IQR
Outliers > 3 IQR
Virology Journal 2008, 5:53 />Page 9 of 16
(page number not for citation purposes)
both produce subclinical disease [12,17]. During our
study we have seen only a sporadic occurrence of animals
with clinical signs of FMD, mainly in April 2006 and
mainly in cattle. The latter may be explained by our find-
ings that the majority of FMDV infections were caused by
the A/Iran/2005 lineage, which seems to cause mainly
subclinical disease in buffaloes [16] and thereby possibly
outplay the serotype O FMDV, but also through the rela-
tively better efficiency of the applied vaccines towards
serotype O. Nevertheless, we have detected an endemic
FMDV infection occurrence (Figure 1), i.e. an endemic
occurrence of mainly subclinical FMD, peaking in August
2006 and December 2006 to March 2007. The maxima in
August and December are in clear correlation to the meas-
ured precipitation and consequently with the increased
humidity during the rainy periods. The relationship
between humidity and virus transmission/stability has
been described in several publications [18-21]. The preva-
lence peaks in February and March 2007 can be explained
by the cumulative effect of humidity, cooler temperature
and the introduction of new animals, potentially FMD
infected, from all over the country during the Eid ul-Azza
festival. Assuming that the incubation period of FMD in
Asian Buffaloes is similar to that in cattle, i.e. 2 to 14 days
[1,22] the spread of FMDV to the whole colony in Febru-
ary and March is likely, in particular considering the
intensive movement of animals and the lack of biosecu-
rity awareness.
Descriptive statistics of the antibody ELISA for 10 randomly selected samples per serum-dilution and serotypeFigure 4
Descriptive statistics of the antibody ELISA for 10 randomly selected samples per serum-dilution and sero-
type. Box-and-whisker diagram of the measured optical density percent (ODP) per dilution and serotype. Showing the small-
est observation, lower quartile (Q1), median, upper quartile (Q3), and largest observation. In addition outliers according their
interquartile range (IQR) and means are displayed. The top and bottom diamond vertices are the respective upper and lower
95% confidence limits (CI) about the group mean. Each circle represents the measured ODP of a sample. The red line repre-
sents the threshold for each serotype, i.e samples are considered negative if the ODP is for O >= 50, for A >= 45, for Asia 1
>= 35 and for C >= 35.
0
10
20
30
40
50
60
70
80
90
1/5 1/10 1/20 1/40 1/80 1/160 1/320 1/640
dilution
ODP
95% CI Notched Outlier Boxplot
95% CI Mean Diamond
Connected Means
Outliers > 1.5 and < 3 IQR
Outliers > 3 IQR
A
Asia 1
O
C
0
10
20
30
40
50
60
70
1/5 1/10 1/20 1/40 1/80 1/160 1/320 1/640
dilution
ODP
0
10
20
30
40
50
60
1/5 1/10 1/20 1/40 1/80 1/160 1/320 1/640
dilution
ODP
negative
negative
negative
negative
positive
positive
positive
positive
A
10
20
30
40
50
60
70
80
90
100
1/5 1/10 1/20 1/40 1/80 1/160 1/320 1/640
dilution
ODP
Virology Journal 2008, 5:53 />Page 10 of 16
(page number not for citation purposes)
Given that the detection window for FMDV in mouth
swabs by real-time RT-PCR is approximately 14 days [12]
and that our results indicate a FMDV infection mean prev-
alence of 19,2% per month (Table 1), a yearly FMDV inci-
dence proportion of approximately 458% (calculated as
incidence proportion = prevalence/duration) can be
assumed, which means that there is a high risk that a very
large proportion, if not all, animals in LDC become
infected with FMDV during the period of one year. Id est,
there is continuous FMDV circulation in LDC. This FMDV
maintenance in LDC bear also a risk of FMDV spreading
to other parts of Pakistan, hence animals that leave the
colony, e.g. for re-breeding, can be infected and transmit
the disease to other animal populations.
The serological analysis shows that 176 of 180 serologi-
cally tested animals are positive in NSP ELISA and the
majority of those animals have been confronted with
structural antigens from all present serotypes. However,
this does not necessarily mean that they have acquired
immunity by becoming infected with each serotype. We
consider it more likely that those animals have been vac-
cinated with multivalent vaccines, either after they have
had an infection or the vaccine strain has not matched
with the circulating strain. The relatively low titres for
serotype C support this consideration, since only a minor-
ity of available vaccines contain serotype C antigens. Even
if it is possible that they have been vaccinated with a not
properly inactivated or purified vaccine, does the relative
strong signals for the NSP ELISA (Figure 3) not support
this, assuming that there is some form of a NSP purifica-
tion step included in the vaccine production, even in the
black market vaccines.
Figure 5 shows that the calculated median endpoint-titre,
in the virus neutralisation assay, for all tested serotypes,
except for serotype C, is equal or above 1/100 and thus a
good protection status of the tested animals against the
serotypes O, A and Asia 1 can be assumed. The relatively
low endpoint-titre of 1/50 for serotype C may indicate
that vaccines containing this very seldom serotype are still
in use in Pakistan, but not as frequently administered to
the animals as vaccines for the other serotypes and likely
not recently boosted by circulating serotype C FMDV.
Compared with the ELISA titration (Figure 4), were the
median endpoint-titres of the serotypes O, A and Asia 1
are equal at 1/320, is the endpoint-titre for serotype O
lower in the virus neutralisation assay. This can be
explained by the fact that both methods are performed
with the O Manisa lineage and that the ELISA is more
Descriptive statistics of the virus neutralisation test for 10 randomly selected samples per serotypeFigure 5
Descriptive statistics of the virus neutralisation test for 10 randomly selected samples per serotype. Box-and-
whisker diagram of the calculated titres for each serotype. Showing the smallest observation, lower quartile (Q1), median,
upper quartile (Q3), and largest observation. In addition outliers according their interquartile range (IQR) and means are dis-
played. The top and bottom diamond vertices are the respective upper and lower 95% confidence limits (CI) about the group
mean. Each circle represents the calculated titre of a sample.
0
100
200
300
400
500
600
700
800
900
1000
1100
1200
1300
1400
O A Asia 1 C
titre [1/x]
Outlier Boxplot
95% CI Mean Diamond
Outliers > 3 IQR
Virology Journal 2008, 5:53 />Page 11 of 16
(page number not for citation purposes)
robust against virus lineage variations. Also, as we do not
have any further data on those serologically tested ani-
mals it can be assumed that the average age of the slaugh-
tered buffaloes is between 4 and 7 years, based on the
information from farms were we collected mouth swab
samples. Furthermore, due to the tradition of keeping ani-
mals only for one lactation period and purchasing them
from other areas of Pakistan, this result represent more the
FMD situation of whole Pakistan than the particular situ-
ation in LDC, thus the time point of infection can have
been before the animal was brought to LDC.
The phylogenetic analysis of the 65% of the positive sam-
ples sequenced shows that primarily two virus-lineages
have circulated in LDC from April 2006 to April 2007.
Namely, A/Iran/2005, a serotype A lineage which caused
major outbreaks in cattle in Turkey, Egypt and Jordan dur-
ing 2006 and 2007, and a Pakistan specific serotype O lin-
eage. The A/Iran/2005 lineage is extensively described
elsewhere [16]. The serotype O sequences constitute a
monophyletic group, not related to the "old" PanAsia lin-
eage, but related to the recently described PanAsia II line-
age [15]. Thus, vaccine strains covering the PanAsia
lineage of serotype O, e.g. O Manisa-like vaccines, are not
necessary giving a good protection to this lineage. The lat-
ter is also supported by the differences of the median end-
point-titres for serotype O in ELISA and serum
neutralisation assay. Consequently, it can be argued that
those vaccines will lose their efficiency, after further
FMDV evolution, away from the "old" PanAsia lineage.
The most related sequences to the Pakistani originate,
with the exception of one sequence from Malaysia, from
Nepal and Bhutan collected during 2003 and 2004. A
common history of the Pakistan and Bhutan/Nepal line-
age can not be excluded, but the fixed differences at resi-
dues 143 and 200 of the VP1 protein indicates that each
has established its own ecological niche.
Unrooted phylogenetic tree of the partial 1D (VP1) nucleotide sequence of Pakistani serotype O isolates and related published sequencesFigure 6
Unrooted phylogenetic tree of the partial 1D (VP1) nucleotide sequence of Pakistani serotype O isolates and
related published sequences. The root for subtree (Figure 5) is indicated.
PanAsia II
related isolates from
Bhutan/Nepal/Malaysia
PanAsia II
related isolates from
Pakistan
PanAsia II
related isolates from
Bhutan/Nepal
Turkey
isolates
PanAsia
related isolates from
Middle East
PanAsia related
isolates from
Turkey
PanAsia
lineage
root for subtree
Virology Journal 2008, 5:53 />Page 12 of 16
(page number not for citation purposes)
Remarkably, the sequence of the locally produced mono-
valent-O vaccine (Lahore vaccine) is nearly identical with
the sequences of the field strains. According to represent-
atives of the vaccine company in Lahore, the company has
been using the same vaccine strain for approximately 30
years. However, it is the opinion of the authors that this
appears highly unlikely, due to the striking similarity of
the 1D vaccine sequence to the field samples sequence.
Probably, there has been an unmeant contamination of
the vaccine production unit or the information we
received from the company is not correct.
Conclusion
For an effective and realisable FMD control program in
LDC, we suggest to introduce a twice annually mass vacci-
nation of all buffaloes and cattle in the colony. These mass
vaccinations should optimally take place shortly before
the beginning of the two rainy periods, e.g. in June and
September. Those vaccinations should, in our opinion, be
in addition to the already individually performed vaccina-
tions of single animals, as the latter usually targets only
newly introduced animals. This suggested combination of
mass vaccination of all large ruminants with the already
performed individually vaccination should provide a con-
tinuous high level of herd immunity in the entire colony.
Vaccines used for this purpose should contain the match-
ing vaccine strains, i.e. A/Iran/2005 and the regional type
of serotype O (PanAsia II), but also antigens of the, in this
world region endemic, Asia 1 lineage should be included.
As alternative for A/Iran/2005, a vaccine containing the
A22 lineage could potentially be used [23]. For covering
the O sublineage, the locally produced monovalent vac-
cine (Lahore vaccine) could be used, if it is assured that
Bayesian phylogenetic analysis of the full 1D (VP1) nucleotide sequence of Pakistan serotype O isolates (black) and closely related published sequences (grey)Figure 7
Bayesian phylogenetic analysis of the full 1D (VP1) nucleotide sequence of Pakistan serotype O isolates (black)
and closely related published sequences (grey). The local produced monovalent vaccine (Lahore vaccine) is indicated in
red.
Bhutan/Nepal/Malaysia
isolates
Pakistan
isolates
EF494502 PAK 08 April 2006
Virology Journal 2008, 5:53 />Page 13 of 16
(page number not for citation purposes)
this vaccine is similar to the one we purchased and that it
is properly inactivated, purified and with a sufficiently
high antigen content. It is important that a continuous
FMDV surveillance, including sublineage typing, is carried
out, to identify potentially newly introduced FMDV line-
ages and therewith subsequently to be enable good advice
on the choice of the best vaccine strains.
In the long term it will be important to control the vaccine
use, so that subclinical FMD will be avoided.
Methods
Sampling scheme and sample handling
A repeated cross-sectional survey has been performed by
collecting a minimum of 162 mouth swabs from ran-
domly selected animals in selected farms (9 animals from
each of 18 farms) four times, during April and September
2006 and January and April 2007, combined with a
monthly sampling of approximately 30 swabs (5 animals
from each of 6 farms). The survey was based on a 2 stage
cluster-randomised setup, with farms as first unit of ran-
domisation and animals on the farms as second unit. To
confirm an geographical randomised sampling we
indexed each selected farm by latitude and longitude with
a GPS device and plotted the coordinates, using GoogleE-
arth, on a map of LDC.
Mouth swabs have been taken from apparently healthy
animals. If during sampling, animals with healing lesions
were detected, those farms were excluded from prevalence
calculations for aggregate level prevalence (Figure 1).
In addition, we purchased a bottle containing the mono-
valent local produced type O vaccine in a drug store in
LDC.
Plain Plastic/Rayon swabs (Sterilin
®
, U.K.) in a sterile tube
have been used for mouth swab collection. The swab sam-
ple was taken by carefully holding the animal with the
mouth slightly open and than moving the swab up and
down on the surface of the tongue four to five times. The
tip of the swabs was than stored in a 2 ml tube containing
1 ml RLT-buffer (Qiagen, Germany), to preserve any viral
RNA present.
In addition, we collected epithelium samples from clini-
cally affected animals. These animals were not randomly
selected. The tongue epithelium was collected from
unruptured or freshly ruptured vesicles by gently abrading
it with a glove, with rubber dots, grabbing the tongue with
the gloved hand and pulling along the surface.
Epithelium was than placed in vials containing buffered
glycerol (50% glycerol with 50% phosphate buffer, pH
7,6), and kept initially at 4°C and subsequently at -20°C.
All samples were, in compliance with the applicable regu-
lations, sent to National Veterinary Institute, Technical
University of Denmark, Lindholm, for further analysis.
RT-PCR, sequencing and phylogenetic analysis
Total RNA of all collected swab samples was extracted
using QIAamp RNA Blood Kit (Qiagen, Hilden, Ger-
many) according to the manufacturer's instructions. The
Deduced amino acid sequence of the partial VP1 sequence of the serotype O isolates and related sequences from Malaysia, Bhutan and NepalFigure 8
Deduced amino acid sequence of the partial VP1 sequence of the serotype O isolates and related sequences from Malaysia,
Bhutan and Nepal.
Virology Journal 2008, 5:53 />Page 14 of 16
(page number not for citation purposes)
Real-Time RT-PCR described by [11] was used to screen
the samples for FMDV RNA.
Tissue (50–100 mg) was homogenized in 1 ml RNApro™
Solution (Qbiogene, USA) in a Lysing Matrix D tube
(Qbiogene) using a FP 120 Fast Prep™ Cell Disruptor
(Qbiogene). Total RNA was extracted using RNeasy-Mini
Kit™ (Qiagen) according to the manufacturer's instruc-
tions.
cDNA synthesis for tissue samples and positive swab sam-
ples was done using Ready-To-Go™ You-Prime First-
Strand Beads (GE Healthcare Life Sciences, Sweden),
employing the primers NV27T (IUPAC code) and random
hexamers pdN6 (IUPAC code).
Five µl of the template cDNA were added to 45 µl of the
PCR reaction mixture containing 0,2 µM primers, 200 µM
each of dATP, dCTP, dGTP and dTTP, 10 mM Tris-HCl
(pH 8.3), 50 mM KCl, 1.5 mM MgCl2 and 1 U of Ampli-
Taq
®
Gold DNA polymerase (Applied Biosystems, UK).
DNA was amplified with a DNA Thermal Cycler PE9700
(Perkin Elmer) by a two-step cycling reaction as follows:
95°C for 15 min, and five cycles of 94°C for 30 sec, 57°C
for 2 min and 72°C for 30 sec, and then 35 cycles of 94°C
for 30 sec, 61°C for 30 sec and 72°C for 30 sec, followed
by a final extension step of 72°C for 10 min. PCR primers
used have been described elsewhere [16,24].
The resulting PCR products were examined by electro-
phoresis, using a 1,2% agarose gel, with a separation time
of 1.5 hours at 6.5 V/cm. Amplicons were visualised with
ethidium bromide and subsequently extracted and puri-
fied from the agarose gel with QIAquick Gel Extraction kit
(Qiagen). Cycle-sequencing, using PCR primers, was then
performed by Agowa GmbH, Germany.
Bayesian phylogenetic analysis of the partial 1D (VP1) nucleotide sequence of Pakistan serotype A isolates (black) and closely related published sequences (grey)Figure 9
Bayesian phylogenetic analysis of the partial 1D (VP1) nucleotide sequence of Pakistan serotype A isolates (black) and closely
related published sequences (grey).
A/IRAN/2005
Virology Journal 2008, 5:53 />Page 15 of 16
(page number not for citation purposes)
Sequence assembling was performed with ContigExpress
(VectorNTI
©
-software) and multiple alignment was per-
formed by log-expectation comparison, using the MUS-
CLE (v.3.6) software [25].
Models of evolution were determined by hierarchical
Likelihood-Ratio test of 24 substitution models, using the
programs PAUP*(v. 10) (Sinnauer, U.K.) and MrModel-
test (v. 2.2) [26].
For serotype A the Hasegawa-Kishino-Yano plus Gamma
(HKY+G) model was used and Bayesian analysis was per-
formed using MrBayes (v3.2) [27] with the following set-
tings. The maximum likelihood model employed 2
substitution types ("nst = 2"), with base frequencies set to
fixed values ("statefreqpr = fixed"). Rate variation across
sites was modelled using a gamma distribution (rates =
"gamma"). The Markov chain Monte Carlo search was run
with 4 chains for 500000 generations, with trees begin
sampled every 100 generations (the first 1000 trees were
discarded as "burnin").
For serotype O the General Time Reversible plus Gamma
(GTR+G) model was used and Bayesian analysis was per-
formed using MrBayes (v3.2) [27] with the following set-
tings. The maximum likelihood model employed 6
substitution types ("nst = 6"), with base frequencies set to
variable values ("statefreqpr = dirichlet(1,1,1,1)"). Rate
variation across sites was modelled using a gamma distri-
bution (rates = "invgamma"). The Markov chain Monte
Carlo search was run with 4 chains for 500000 genera-
tions, with trees begin sampled every 100 generations (the
first 1000 trees were discarded as "burnin").
ELISA
For the detection of antibodies against FMDV in serum, a
blocking ELISA assay was carried out as described by Have
and Jensen [13] using O-Manisa, A22-Iraq, Asia 1-Shamir
and C-Noville antigens. For detecting antibodies against
non-structural proteins, a blocking ELISA assay was car-
ried out as described by Sorensen et al. [14].
Virus neutralisation test (VNT)
VNT was performed according to OIÈ's Manual of Diag-
nostic Tests and Vaccines for Terrestrial Animals 2007 [28]
and titres calculated according to Kärber [29].
Statistical analysis
Statistical analysis was performed using R [30] and MS-
Excel.
Climate data
Climate data for Karachi were obtained from a database of
Germany's National Meteorological Service, the Deut-
scher Wetterdienst [31].
Authors' contributions
JK participated in planning of the study and carried out
the molecular and field epidemiological analysis, partici-
pated in the field work and drafted the manuscript. MH
and MA participated in the field work and delivered back-
ground information. SA was project coordinator and con-
ceived the study and helped in the field work and to draft
the manuscript. All authors read and approved the final
manuscript.
Additional material
Acknowledgements
We thank Tina Pedersen, Tina Frederiksen, Jane Borch, Jani Christiansen,
Syed Jamal, Abubakar, Liaquat Ali, Hassan Tanweer, Abdul Hafeez Sheikh,
Mehmood Iqbal, Manzoor Asif, Zaka Nazamani for excellent technical
assistance, and Kirsten Tjørnehøj, Håkan Vigre, Thomas Bruun Rasmussen
and Graham Belsham for useful discussions. This work was supported by
the Network of Excellence for Epizootic Disease Diagnosis and Control
(EPIZONE), Call Identifier: FP6-2004-Food-3-A.
References
1. Alexandersen S, Mowat N: Foot-and-mouth disease: host range
and pathogenesis. Curr Top Microbiol Immunol 2005, 288:9-42.
2. Carrillo C, Tulman ER, Delhon G, Lu Z, Carreno A, Vagnozzi A, et al.:
Comparative genomics of foot-and-mouth disease virus. J
Virol 2005, 79:6487-6504.
3. Domingo E, Pariente N, Airaksinen A, Gonzalez-Lopez C, Sierra S,
Herrera M, et al.: Foot-and-mouth disease virus evolution:
exploring pathways towards virus extinction. Curr Top Micro-
biol Immunol 2005, 288:149-173.
4. Office international des épizooties (OIÉ): World Animal Health
Information Database (WAHID) Interface. [http://
www.oie.int/wahid-prod/public.php?page=home]. Accessed 10/7/
2007
5. EUFMD – The European Commission for the Control
ofFoot-and-Mouth Disease – Reports – Executive Commit-
tee – 2005 [ />72report_txt.html]. Accessed 12/5/2007.
Additional file 1
FMDV infection prevalence at aggregate level in tabular form. FMDV
infection prevalence at aggregate level from April 2006 to April 2007,
based on the number of inapparently infected animals found in a two-
stage sampling scheme. The farm-level (herd-level) prevalence reflects the
number of farms with positive found animals, calculated as the proportion
of
Σ
farms infected per month to
Σ
farms sampled per month, and the ani-
mal-level prevalence reflect the number of positive animals within the
sampled population, calculated as the proportion of
Σ
animals infected per
month to
Σ
animals sampled per month
Click here for file
[ />422X-5-53-S1.pdf]
Additional file 2
ODP values of all 180 tested serum samples. ODP values of all 180 tested
serum samples, for serotype specific and NSP ELISA
Click here for file
[ />422X-5-53-S2.pdf]
Publish with BioMed Central and every
scientist can read your work free of charge
"BioMed Central will be the most significant development for
disseminating the results of biomedical research in our lifetime."
Sir Paul Nurse, Cancer Research UK
Your research papers will be:
available free of charge to the entire biomedical community
peer reviewed and published immediately upon acceptance
cited in PubMed and archived on PubMed Central
yours — you keep the copyright
Submit your manuscript here:
/>BioMedcentral
Virology Journal 2008, 5:53 />Page 16 of 16
(page number not for citation purposes)
6. Zahur AB, Irshad H, Hussain M, Anjum R, Khan MQ: Transbound-
ary animal diseases in Pakistan. J Vet Med B Infect Dis Vet Public
Health 2006, 53(Suppl 1):19-22.
7. Tosh C, Hemadri D, Sanyal A: Evidence of recombination in the
capsid-coding region of type A foot-and-mouth disease virus.
J Gen Virol 2002, 83(Pt 10):2455-2460.
8. Perez AM, Thurmond MC, Grant PW, Carpenter TE: Use of the
scan statistic on disaggregated province-based data: foot-
and-mouth disease in Iran. Prev Vet Med 71:197-207. 2005 Oct 12
9. Kesy A: Global situation of foot-and-mouth disease (FMD)–a
short review. Pol J Vet Sci 2002, 5:283-287.
10. Office international des épizooties (OIÉ): HANDISTATUS II.
2007. 2002 [ />]. Accessed
10/02/2007.
11. Reid SM, Ferris NP, Hutchings GH, Zhang Z, Belsham GJ, Alexan-
dersen S: Detection of all seven serotypes of foot-and-mouth
disease virus by real-time, fluorogenic reverse transcription
polymerase chain reaction assay. J Virol Methods 2002,
105:67-80.
12. Alexandersen S, Quan M, Murphy C, Knight J, Zhang Z: Studies of
quantitative parameters of virus excretion and transmission
in pigs and cattle experimentally infected with foot-and-
mouth disease virus. J Comp Pathol 2003, 129:268-282.
13. Detection of antibodies to FMDV type O by enzyme-linked immunosorbent
assay (ELISA). Proceedings of the Session of the Research Group of the
Standing Technical Commitee of the European Commission for the Control
of Foot-and-Mouth Disease, Lelystad, Netherlands, 20–22 Sept. Appendix
VIII 1983:44-51.
14. Sorensen KJ, de Stricker K, Dyrting KC, Grazioli S, Haas B: Differen-
tiation of foot-and-mouth disease virus infected animals
from vaccinated animals using a blocking ELISA based on
baculovirus expressed FMDV 3ABC antigen and a 3ABC
monoclonal antibody. Arch Virol 2005, 150( 4):805-814.
15. EUFMD – The European Commission for the Control of
Foot-and-Mouth Disease – Report of the 37th Session of
EUFMD, Rome 2007 [ />en/eufmd/37report_txt.html]. Accessed 11/19/2007
16. Klein J, Hussain M, Ahmad M, Normann P, Afzal M, Alexandersen S:
Genetic characterisation of the recent foot-and-mouth dis-
ease virus subtype A/IRN/2005. Virol J 4:122. 2007 Nov 15
17. Hutber AM, Kitching RP, Conway DA: Predicting the level of herd
infection for outbreaks of foot-and-mouth disease in vacci-
nated herds. Epidemiol Infect 1999, 122(Suppl 3):539-544.
18. Donaldson AI: The influence of relative humidity on the aero-
sol stability of different strains of foot-and-mouth disease
virus suspended in saliva. J Gen Virol 1972, 15(1):25-33.
19. Alexandersen S, Donaldson AI: Further studies to quantify the
dose of natural aerosols of foot-and-mouth disease virus for
pigs. Epidemiol Infect 2002, 128:313-323.
20. Alexandersen S, Brotherhood I, Donaldson AI: Natural aerosol
transmission of foot-and-mouth disease virus to pigs: mini-
mal infectious dose for strain O1 Lausanne. Epidemiol Infect
2002, 128:301-312.
21. Sorensen JH, Mackay DK, Jensen CO, Donaldson AI: An integrated
model to predict the atmospheric spread of foot-and-mouth
disease virus. Epidemiol Infect 2000, 124:577-590.
22. Kitching RP: Clinical variation in foot and mouth disease: cat-
tle. Rev Sci Tech 2002, 21:499-504.
23. ProMED-mail. PRO/AH> Foot & mouth disease (type A)
(03) – Jordan Middle East. Archieve Number 20070129.0380.
.
24. Klein J, Parlak U, Ozyoruk F, Christensen LS: The molecular epi-
demiology of foot-and-mouth disease virus serotypes A and
O from 1998 to 2004 in Turkey. BMC Vet Res 2006, 2:35.
25. Edgar RC: MUSCLE: multiple sequence alignment with high
accuracy and high throughput. Nucleic Acids Res 32:1792-1797.
2004 Mar 19
26. Nylander JA, Ronquist F, Huelsenbeck JP, Nieves-Aldrey JL: Bayesian
phylogenetic analysis of combined data. Syst Biol 2004,
53:47-67.
27. Huelsenbeck JP, Ronquist F: MRBAYES: Bayesian inference of
phylogenetic trees. Bioinformatics 2001, 17:754-755.
28. Terrestrial Animal Health Code – 2007 [ />eng/normes/Mcode/en_chapitre_1.1.1.htm]. Accessed 12/20/2007
29. Kärber G, Beitrag zur kollektiven: Behandlung pharmakolo-
gischer Reihenversuche. Naunyn Schmiedebergs Arch Pharmacol
1931, 162:480-483.
30. Maindonald JH, Braun J: Data analysis and graphics using R : an
example-based approach. 2nd edition. Cambridge; New York:
Cambridge University Press; 2007.
31. Deutscher Wetterdienst – Homepage [
].
Accessed 4/15/2008