Báo cáo hóa học: " Correlation between pre-treatment quasispecies complexity and treatment outcome in chronic HCV genotype 3a" pptx
Bạn đang xem bản rút gọn của tài liệu. Xem và tải ngay bản đầy đủ của tài liệu tại đây (417.92 KB, 15 trang )
BioMed Central
Page 1 of 15
(page number not for citation purposes)
Virology Journal
Open Access
Research
Correlation between pre-treatment quasispecies complexity and
treatment outcome in chronic HCV genotype 3a
Isabelle Moreau*
1
, John Levis
1
, Orla Crosbie
2
, Elizabeth Kenny-Walsh
2
and
Liam J Fanning
1
Address:
1
Molecular Virology Diagnostic & Research Laboratory, Department of Medicine, Clinical Sciences Building, Cork University Hospital,
Cork, Ireland and
2
Department of Gastroenterology, Cork University Hospital, Cork, Ireland
Email: Isabelle Moreau* - ; John Levis - ; Orla Crosbie - ; Elizabeth Kenny-
Walsh - ; Liam J Fanning -
* Corresponding author
Abstract
Pre-treatment HCV quasispecies complexity and diversity may predict response to interferon
based anti-viral therapy. The objective of this study was to retrospectively (1) examine temporal
changes in quasispecies prior to the start of therapy and (2) investigate extensively quasispecies
evolution in a group of 10 chronically infected patients with genotype 3a, treated with pegylated
α2a-Interferon and ribavirin.
The degree of sequence heterogeneity within the hypervariable region 1 was assessed by analyzing
20–30 individual clones in serial serum samples. Genetic parameters, including amino acid Shannon
entropy, Hamming distance and genetic distance were calculated for each sample. Treatment
outcome was divided into (1) sustained virological responders (SVR) and (2) treatment failure (TF).
Our results indicate, (1) quasispecies complexity and diversity are lower in the SVR group, (2)
quasispecies vary temporally and (3) genetic heterogeneity at baseline can be use to predict
treatment outcome.
We discuss the results from the perspective of replicative homeostasis.
Background
The Hepatitis C virus (HCV), is the causative agent of
chronic hepatitis C and infects at least 170 million indi-
viduals worldwide [1-3]. The virus has been classified into
six major genotypes and more than 70 subtypes based on
sequence diversity [4-10]. The most important feature of
HCV is that it causes chronic infection in about 50–80%
of individuals [3,11-13].
The HCV genome exhibits significant genetic heterogene-
ity due to accumulation of mutations during viral replica-
tion, attributed to a limited fidelity of the RNA dependent
RNA polymerase [14,15]. This phenomenon generates a
dynamic population of heterogeneous but closely related
variants designated as quasispecies [14-17]. The massive
genetic heterogeneity present in quasispecies has impor-
tant biological consequences and enables HCV to escape
immune clearance and to establish chronic infection [18-
22]. Furthermore, the quasispecies distribution may influ-
ence the outcome of anti-viral therapy and be important
in the development of resistance to anti-viral therapy [23-
27]. It is well established that HCV genotype influences
Published: 9 July 2008
Virology Journal 2008, 5:78 doi:10.1186/1743-422X-5-78
Received: 19 May 2008
Accepted: 9 July 2008
This article is available from: />© 2008 Moreau et al; licensee BioMed Central Ltd.
This is an Open Access article distributed under the terms of the Creative Commons Attribution License ( />),
which permits unrestricted use, distribution, and reproduction in any medium, provided the original work is properly cited.
Virology Journal 2008, 5:78 />Page 2 of 15
(page number not for citation purposes)
both response to therapy and disease severity as well as
the viral-host interactions [19,28-30]. Patients infected
with HCV genotypes 2 or 3 respond more favourably than
genotype 1 to pegylated α2a-Interferon and ribavirin anti-
viral therapy [12,27,31,32].
The HCV genomic heterogeneity is not distributed evenly
across the HCV genome. In particular, the untranslated
region at 5' and 3' ends of the genome exhibits areas of
conservations, whereas the hypervariable region 1
(HVR1) located in the amino-terminus of the HCV enve-
lope glycoprotein E2 is the most variable part of the HCV
genome. There is strong evidence to suggest that the
HVR1, encoding 27 amino acids (positions 1491 to 1571
on reference strain H77), is susceptible to immune pres-
sure involving neutralising antibodies and allows the
selection of escape mutants [27,31,33-36]. A considerable
number of investigations into HCV quasispecies have
focused on the analysis of the HVR1, given that a high
degree of diversity increases the likelihood of distinguish-
ing one viral species from another. Many studies have
investigated the composition and the evolution of HCV
quasispecies to determine whether the genetic changes
could provide biological clues for understanding and pre-
dicting the outcome of anti-viral therapy. These studies
have suggested a correlation between a high level of heter-
ogeneity within the HVR1 and a poor response to
pegylated α2a-Interferon and ribavirin therapy
[21,28,30,31,37-43].
A growing body of evidence suggests that the molecular
profile of an individual's pre-treatment HCV quasispecies
diversity (QD) could potentially be used to identify
responders and non-responders. Currently there is little
information on the temporal changes to the QD in
chronic HCV carriers prior to therapy as QD is usually
assessed only at baseline [28,30,37-41,43]. Mapping
sequential alteration to the QD may define possible win-
dows of opportunity during which therapy may have
increased efficacy for patients.
A mechanistic explanation for the temporal patterns of
quasispecies complexity in the non treatment period may
be found in replicative homeostasis (RH), a recently pro-
posed hypothesis [44-47]. Briefly, RH consists of a series
of autoregulatory feedback epicycles that link RNA
polymerase function, RNA replication and protein synthe-
sis through interactions between mutant or wild type pro-
teins and the RNA dependant RNA polymerase (RDRP)
causing formation of stable, but reactive, replicative equi-
libria [47]. Replicative homeostasis provides a rational
explanation for HCV persistence, for HCV viral kinetics,
for quasispecies stability and also for the various
responses seen during anti-viral treatment of HCV.
Recently Chen et al. have reported a study on Hepatitis B
virus (HBV) which provides solid experimental evidence
of replicative homeostasis [48]. The authors have demon-
strated that mutant pre-core protein significantly reduces
HBV replication and HBe antigen (HBeAg) expression rel-
ative to the wild type protein [48].
In the present study we have retrospectively investigated
the genetic distance profile and the molecular evolution
of the HCV quasispecies of a group of patients chronically
infected with HCV genotype 3a (1) in the pre-treatment
period and (2) during the course of treatment with
pegylated α2a interferon plus ribavirin. Our goals were to
define (1) temporal changes in QD during the time prior
to therapy and (2) whether the patterns of these changes
would correlate with the outcome of anti-viral therapy.
Results
Characterisation of the study group
All the samples used in this study were obtained from
chronically infected patients with genotype 3a hepatitis C
virus. The total number of individuals was 10; n = 7
females. Patient demographic details are outlined in Table
1. 9/10 patients were treatment naïve prior to the start of
the standard 24 weeks pegylated α-2a interferon plus rib-
avirin therapy (Table 1). Among the ten patients included
in the study, 6 were classified as sustained virological
responders, hence SVR, and 4 were classified as treatment
failure, hence TF (Table 1). Within the SVR group one
patient, SVR12, could be classified as superfast responder,
hence SFR, as HCV RNA was undetectable in serum at
week 1 of treatment (Table 1). Within the TF group, one
patient was classified as a non responder, hence NR2, as
the viraemia remained stable during the whole course of
treatment, whereas the three others were classified as
relapsers, hence R (Table 1). A t-test was performed to
investigate whether factors as age, body mass index (BMI)
and Viral load at baseline and were significantly different
between SVR and TF group. None of these comparison
were significantly different (P > 0.05, data not shown).
[49,50].
Clonal analysis and sequences data
Reproducibility, accuracy and sensitivity of the RT-PCR
protocol were assessed by use of sera normalised to 4 log
10
IU/mL and by use of Pwo DNA polymerase which exhibits
proofreading activity [51].
In the present study, between 2 and 6 serial samples per
individual were subjected to RT-PCR and clonal sequence
analysis with a mean of 23 individual clones sequenced
for each serum sample (Table 1). A total number of 839
molecular clones were recovered. The sequence analysis
was performed after exclusion of all the defective
sequences: nucleotide deletion (n = 2) or mutation (n = 3)
producing a stop codon. A total number of 834 molecular
Virology Journal 2008, 5:78 />Page 3 of 15
(page number not for citation purposes)
clones, corresponding to a total of 267240 bp, were fur-
ther examined. Sequence analysis of these 834 individual
clones revealed a sequence of 320 bp in length encom-
passing the 81 bp of the HVR1, except for 30 clones which
presented with a 12 nucleotide in-frame insertion. No
other insertions were observed among the entire clonal
population. For the purpose of the genetic analysis, the
804 sequences consisting of a 320 bp amplicon and the 30
sequences consisting of 332 bp amplicon (12 bp inser-
tion) were trimmed by 14 bp, (specifically, 9 bp at the
5'end and 5 bp at the 3'end of the amplicon) leading to a
final sequence of 306 bp or 318 bp (12 bp insertion),
respectively. The 834 trimmed sequences were assigned
unique GenBank accession nos. EU023073
–EU023906.
The 12 bp insertion observed among 30 individual molec-
ular clones, is located exactly at the junction of the E1 and
E2 regions (5'end of the 27 aa HVR1) and encoded a
sequence of 4 aa. All of the 30 individual clones belonged
to patient SVR6. A description of the molecular clones
containing the 12 bp insertion is detailed at the end of the
results section.
Phylogenetic trees reconstruction has shown independent
clustering of the sequences from each individual or set of
separate sequences. This finding confirms the absence of
inter sample contamination (data not shown).
Genetic variation during the pre-treatment assessment
period
A serum sample 24–44 weeks prior to the start of therapy
was available for each patient. This early sample, hence E,
represents an intra-patient untreated control. The mean
time between the E sample and the baseline sample,
hence B, was 34 weeks (SEM ± 10) for the SVR group and
24 weeks (SEM ± 0) for the TF group (Table 2). At E and B
time points the viral load did not differ significantly
among SVR and TF groups (P > 0.05, Figure 1A). The
changes in viral load observed for E vs B time points and
B vs W1 time points were found to be significant within
each group of patient but were non significant for inter-
group comparison (Table 2). Although at E and B time
points, within the HVR1, samples from the TF group
exhibited higher viral load and higher quasispecies com-
Table 1: Demographic details, treatment outcomes based on virologic responses, viral load at baseline and serial serum samples
analysed over time for HCV genotype 3a chronically infected patients
Patient
Group
Type of
Response
Sex Rx Naïve Age
(years) at
Baseline
Viral Load
log
10
IU/
ml at
Baseline
Time points
Pre treatment period Early treatment period Post
treatmen
t period
Sustained virological
response (SVR)
Mean Age
41 ± 12
Mean VL
5.66 ±
0.66
E B W1 W2 W3 W4 L
SVR3 SVR F Yes 28 5.47 + + + + + - (V) TND
SVR6 SVR F Yes 35 5.16 + + - (V) TND TND TND TND
SVR7 SVR F Yes 32 5.46 + + + - (V) TND TND TND
SVR8 SVR F Yes 59 6.89 + + + NA NA + (V) TND
SVR9 SVR F No 45 6.37 + + + + NA - (V) TND
SVR12 SFR F Yes 49 5.17 + + TND TND TND TND TND
Treatment failure
(TF)
Mean Age
41 ± 7
Mean VL
6.23 ±
0.63
E B W1 W2 W4 W12* L
NR2 NR F Yes 42 5.05 + + + NA + + + (W3)
R1 R M Yes 46 7.5 + + + (V) TND TND TND + (W2)
R4 R M Yes 45 7.11 + + + + (V) TND TND + (W10)
R13 R M Yes 31 6.32 + + + - TND TND - (W12)
The pre treatment period corresponds to E and B time point. E for early sample, taken between 6 to 12 months before treatment and B for
baseline sample, taken at day 0 of pegylated INF-α2a/ribavirin treatment. The early treatment period corresponds to W1 to W4 time points
(samples taken at 1, 2, 3 or 4 weeks of treatment). The sample taken at week 12 of treatment was only available for the non-responder patient
(W12*). The post treatment period corresponds to the L time point and was only available within the TF group. L for late sample taken at 2, 3, 10
or 12 weeks after the end of treatment). +, sample available with successful analysis. -, sample available with unsuccessful analysis. TND, target not
detected when HCV RNA was not detectable in the sample. (V), sample treated with the Viraffinity™ reagent. NA, sample non available for
analysis.
Virology Journal 2008, 5:78 />Page 4 of 15
(page number not for citation purposes)
Table 2: Changes within HVR1 and outside HVR1 in viral load, normalised entropy, genetic diversity and genetic distance in patients with chronic hepatitis C according to their response
to pegylated α2a-interferon/ribavirin therapy
Patient group No. of patients Time points Interval mean
weeks
Change in serum
HCV RNA × 10
5
copy/ml
Change in
Normalised
Shannon Entropy
(Nucleotides)
Change in
Normalised
Shannon Entropy
(Amino Acids)
Change in genetic
diversity (mean
Hamming
distance)
Change in genetic
distance
SVR 6 E vs B 34 ± 10 3.56 ± 9.01† 0.030 ± 0.297 -0.026 ± 0.266 -1.15 ± 4.56 -0.005 ± 0.025
4B vs w1 1 ± 0 -17.21 ± 26.33† -0.177 ± 0.329 -0.111 ± 0.225* -0.05 ± 4.14 0.002 ± 0.026
2B vs w2 2 ± 0 -25.98 ± 30.95 -0.001 ± 0.267 -0.008 ± 0.257 1.10 ± 1.00 -0.001 ± 0.004
2 B vs W3/4 3.5 ± 0.5 -39.47 ± 38.11 -0.243 ± 0.064 -0.178 ± 0.156 -3.35 ± 1.85 -0.027 ± 0.015
HVR1
TF 4 E vs B 24 ± 0 83.31 ± 92.20‡ 0.147 ± 0.063 0.118 ± 0.141 8.75 ± 4.13 0.018 ± 0.032
4B vs w1 1 ± 0 -116.22 ± 125.37‡ -0.126 ± 0.236 -0.086 ± 0.146* -7.63 ± 9.98 -0.026 ± 0.036
2 B vs W2/4 3 ± 1 -49.94 ± 56.35 -0.073 ± 0.268 -0.049 ± 0.220 -0.50 ± 3.70 -0.001 ± 0.016
3B vs L 5 ± 4 -33.70 ± 48.92 -0.336 ± 0.348 -0.398 ± 0.172 -15.60 ± 15.99 -0.054 ± 0.056
SVR 6 E vs B 0.092 ± 0.232 0.024 ± 0.174 0.02 ± 0.77 0.002 ± 0.006
4B vs w1 -0.104 ± 0.108 -0.049 ± 0.142 -0.45 ± 0.62 -0.004 ± 0.005
2B vs w2 0.127 ± 0.047 -0.003 ± 0.054 0.05 ± 0.05 0.000 ± 0.001
2 B vs W3/4 -0.071 ± 0.185 -0.002 ± 0.026 -1.35 ± 0.95 -0.013 ± 0.010
Outside
TF 4 E vs B -0.089 ± 0.276 -0.035 ± 0.223 0.18 ± 1.43 -0.010 ± 0.018
4B vs w1 0.064 ± 0.274 0.009 ± 0.065 0.15 ± 0.43 -0.005 ± 0.008
2 B vs W2/4 0.106 ± 0.239 0.032 ± 0.049 0.10 ± 0.10 0.001 ± 0.003
3B vs L -0.007 ± 0.109 -0.049 ± 0.148 0.12 ± 0.48 -0.007 ± 0.009
SVR correspond to the sustained virological response patient group. TF correspond to the treatment failure group. The number of patients indicates the number of samples available for analysis at the
corresponding time points. E represents the early time point, B the baseline or day 0 of treatment, W1–4 the week 1 to week 4 of treatment and L the sample taken after the end of treatment only
available for analysis in the TF group. Negative values correspond to a reduction in HCV RNA level, normalized entropy at nucleotides or amino acids level, mean Hamming distance and genetic distance.
The data represent mean ± SEM. The statistical significance of comparisons between time points and between the two groups of patients were analysed with non parametric Mann-Whitney U test. †, P
= 0.01 for the change between time point E vs B and B vs W1 within the SVR group. ‡, P = 0.057 for the change between time point E vs B and B vs W1 within the TF group. *, P = 0.038 for the change
at time point B vs W1 between the SVR and the TF group
Virology Journal 2008, 5:78 />Page 5 of 15
(page number not for citation purposes)
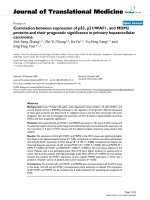
Viral Load and genetic parameters in the two groups of patient (SVR and TF group) and at two time points (E, prior therapy and B, at baseline)Figure 1
Viral Load and genetic parameters in the two groups of patient (SVR and TF group) and at two time points (E,
prior therapy and B, at baseline). In order to provide a mean value for multi parameter comparison, the variables were
adjusted to fit to an appropriate scale i.e, (VL) Serum HCV RNA, No. of copies/ml × by a factor of 2.10
-8
, (Sn-nt) normalised
entropy at nucleotide level and (Sn-aa) at amino acid level are actual values, (HD) mean Hamming distance × by a factor of 5
and (GD) genetic distance × by a factor of 10. The genetic parameters (Sn-nt, Sn-aa, HD and GD) were calculated (A), within
the HVR1 (27 aa) and (B), outside the HVR1 (62 aa). (*), P = 0.019 for Sn-aa and (¶), P = 0.019 for HD, represent significant dif-
ference between the SVR and the TF group at B time point calculated by non parametric Mann-Whitney U test.
AB
VL and genetic parameters at E and B time point
SVR group versus TF group
0
0.1
0.2
0.3
0.4
0.5
0.6
0.7
0.8
0.9
1
VL Sn - n t Sn - a a H D GD
HVR1
SVR-E
SVR-B
TF- E
TF- B
*
*
¶
¶
VL and genetic parameters at E and B time point
SVR group versus TF group
0
0.1
0.2
0.3
0.4
0.5
0.6
0.7
0.8
0.9
1
VL Sn - n t Sn - a a H D GD
Outside HVR1
SVR-E
SVR-B
TF- E
TF- B
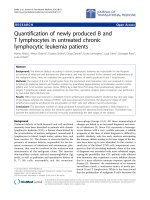
Evolution of QC and QD within the 27 aa of the HVR1 in both group of patientsFigure 2
Evolution of QC and QD within the 27 aa of the HVR1 in both group of patients. (A) 2 representative individuals
within the SVR group, SVR3 and SVR8. (B) 2 representative individuals within the TF group, 1 non-responder (NR2) and 1
relapser (R4). The vertical bars indicate the number and the proportion of viral variants within each sample. Within the vertical
bars, each variant is represented by a different colour. The dominant viral strain found in each patient at Baseline is in pink col-
our. The other strains are represented by different colours. The same colour indicates identity between viral strain present at
different time point but not between different patients. The black line indicates the quasispecies diversity calculated by the
mean Hamming distance (HD) from each sample.
A
SVR group
HVR1 (27aa)
R4
0
10
20
30
40
50
60
70
80
90
100
EBW1W2L
Time Point
Identical Clones (%)
0
5
10
15
20
25
30
35
40
Mean Hamming Distance
•—•
HVR1 (27aa)
NR2
0
10
20
30
40
50
60
70
80
90
100
E B W1 W4 L
Time Point
Identical Clones (%)
0
5
10
15
20
25
30
35
40
Mean Hamming Distance
•—•
HVR1 (27aa)
SVR3
0
10
20
30
40
50
60
70
80
90
100
EBW 1W2W 3
Time Point
Identical clones (%)
0
5
10
15
20
25
30
35
40
Mean Hamming Distance
•—•
HVR1 (27aa)
SVR8
0
10
20
30
40
50
60
70
80
90
100
EBW1W4
Time Poi nt
Identical Clones (%)
0
5
10
15
20
25
30
35
40
Mean Hamming Distanc e
•—•
B
TF group
Virology Journal 2008, 5:78 />Page 6 of 15
(page number not for citation purposes)
plexity (QC) than patients in the SVR group, (1) the viral
load, (2) the normalised Shannon entropy at the nucle-
otide level (Sn-nt) and (3) the genetic distance (GD) did
not differ significantly between the two groups of patients
(p > 0.05, Figure 1A). In contrast, the normalised Shannon
entropy at the amino acids level (Sn-aa) and the genetic
diversity (mean Hamming distance, HD), within the
HVR1, were significantly lower in the SVR than in the TF
group at B time point (P = 0.019 for both parameters, Fig-
ure 1A) but not at E time point (P > 0.05, Figure 1A). The
same analysis was performed on the 62 predicted aa
sequences outside the HVR1 located at the 5'end of the
HVR1. In all patient groups, the normalized Shannon
entropy at both nucleotide and amino acid level, the
genetic diversity and the genetic distance were always
lower outside the HVR1 than within the HVR1 (Figure
1B). No significant difference for any of the genetic
parameters examined outside the HVR1 was observed at E
or at B time point between the two groups of patients (P >
0.05, Figure 1B).
Genetic variation and molecular evolution of the HCV
quasispecies during treatment in patients with different
patterns of response
Samples in the SVR group showed a decrease in HD, GD,
Sn-nt and Sn-aa between the B sample and the other serial
samples available for analysis but none of the difference
were significant (Table 2). These variations were associ-
ated with a significant reduction of HCV viral load (P =
0.01, Table 2). In the majority of SVR patients these
changes occurred before week 2, leading to a collapse of
QD followed by a decrease of viral RNA below the lower
level of detection (LOD, 10 IU/mL) (Figure 2A and Table
1). Within the TF group, despite a decrease in viral load
over time, this variation was not significant (P = 0.057,
Table 2). For the TF patients who had an end of treatment
response followed by relapse, genetic diversity decreased
at a slower rate than within the SVR group, leading to an
almost homogeneous HCV quasispecies population at the
time of relapse only (R4, Figure 2B). The reduction in Sn-
aa at time point B versus W1 was significant when com-
pared the two groups of patients (P = 0.038, Table 2).
Among the TF group, NR2 who did not response to ther-
apy had a viral load that was stable during the course of
treatment (mean 5.15 ± 0.33). In NR2 the genetic diver-
sity increased in the first 2 weeks of treatment and then
decreased slightly over the 24 weeks of treatment where
samples were available (NR2, Figure 2B). The same analy-
sis was performed on the 62 predicted aa sequence out-
side the HVR1 located at the 5'end of the HVR1. In all
patient groups, the normalized Shannon entropy at both
nucleotides and amino acids level, the genetic diversity
and the genetic distance did not show any significant var-
iation over time (P > 0.05, Table 2).
The analysis of individual viral variants within a patient
was performed by examination of the 27 aa HVR1
sequences at each time point and grouped according to
the pattern of response to therapy (Figure 2). The two rep-
resentative examples of the SVR group, patient SVR3 and
SVR8 depicted in Figure 2A, showed clearly that the
number of viral strains present at baseline and at week 1
is reduced or retain at a low level of heterogeneity. In all
SVR samples the dominant strain at week 1 of therapy rep-
resents an average of 90% of the total viral population.
Interestingly, the dominant strain present at baseline was
still present in 3 patients in the SVR group at week 1 (Fig-
ure 2A, SRV8 is a representative example, other results not
shown) and retained dominance in two of them while
disappearing in 1 patient (results not shown). In the case
of the superfast responder, SFR (SVR12, Table 1), there
was 100% homogeneity at the amino acid level at base-
line (data not shown).
The two representative examples in TF group, patient NR2
and R4 depicted in Figure 2B, showed clearly that the
number of viral strains present at baseline and at week 1
is higher than in the SVR group. Interestingly, the differ-
ence observed between the two groups was significant at
both time points. At B time point in the TF group, the
number of clonotypes was 6 versus 3 in the SVR group
with a P value of 0.024, whereas at W1 time point, the
number of clonotypes in the TF group was 5 versus 2
within the SVR group with a P value of 0.03. In all TF cases
at least one strain present at B time point was retained dur-
ing the course of therapy and after the end of treatment.
In all TF cases at the L time point, where sample was avail-
able, the pre-dominant strain was either the dominant
strain or a minor strain already present at B time point.
This finding suggests the pre-existence of a "future" high
fitness strain able to persist and effectively dominate the
quasispecies population under interferon base anti-viral
therapy.
Phylogenetic analysis of the HCV quasispecies prior and
during treatment in patient with different patterns of
response
To monitor viral variation and evolutionary relationships
over time, phylogenetic analysis of all amino acid viral
sequences of the HVR1 within a patient were performed.
The phylogenetic trees represented in Figure 3 correspond
to representative patterns according to therapy outcome.
In the SVR group a distinct cluster of a monophyletic pop-
ulation was observed at E time point in 5 over 6 patients
(representative example SVR3, Figure 3A) supported by a
bootstrap proportion of greater than 650 of 1000 boot-
strap replicates annotated at the appropriate branches as a
percentage value (Figure 3A). During the course of ther-
apy in all cases examined, the viral sequences showed dis-
tinctive clustering within the sampling time points for the
Virology Journal 2008, 5:78 />Page 7 of 15
(page number not for citation purposes)
SVR group. This phenomenon was not observed for the TF
group. Thus for SVR patients, there was a progressive shift
in the viral population over time (Figure 3A). This obser-
vation is consistent with the low level of quasispecies
diversity observed during the pre-treatment assessment
period and with the decrease of QD observed over time
within the SVR group. In contrast, no cluster of a mono-
phyletic population was observed at E time point within
the TF group and in most cases the viral sequences showed
no emergence of a cluster within the sampling time
points, during the course of treatment. The NR2 case in
Figure 3B is a representative example of this pattern show-
ing intermingling of variants. This observation suggests a
relative evolutionary stasis of the viral population in
response to interferon based therapy compared to the pat-
tern observed in the SVR group. However, in relapse
patients a tendency to form clusters was observed at the
time of relapse only, case R4 in Figure 3B. These results are
consistent with the high level of QD observed within the
TF group during the pre-treatment assessment period and
with the decrease in QD observed in relapse patient at the
time of relapse.
Intra-sample and inter-sample genetic distance variability
during treatment in patient with different patterns of
response
The intra-sample analysis which is a pairwise comparison
between all sequences within a particular quasispecies
population, measured the level of diversity within each set
of quasispecies population. At the HVR1, the mean intra-
sample genetic distance variability showed no marked
change over time within the SVR group (P > 0.05, Table
3). Within the TF group, the mean intra-sample genetic
distance variability showed a slight decrease over time but
the magnitude of change between the different time
points were not significant (P > 0.05, Table 3). Overall,
these results are concordant with the lower QC and QD
observed within the SVR group when compared to the TF
group during the pre-treatment assessment period and
during the course of therapy (Figure 2).
Inter-sample analysis which is the comparison of the
baseline sample alone versus the consensus of baseline
plus follow-up samples showed a slight increase of the
mean genetic distance within the SVR group (Table 3). In
Phylogenetic trees of all viral HVR1 amino acid sequences within each group of patientsFigure 3
Phylogenetic trees of all viral HVR1 amino acid sequences within each group of patients. (A) 2 representative indi-
viduals within the SVR group, SVR3 and SVR8. (B) 2 representative individuals within the TF group, 1 non-responder (NR2) and
1 relapser (R4). The phylogenetic trees were constructed with the NEIGHBOR program in the PHYLIP package based on
Kimura's distance, shown as scale bar below each tree. A bootstrap analysis using 1000 bootstrap replicates was performed to
assess the reliability of each branch point. Bootstrap scores are given as percentage value. The values greater than 60% are
annotated at appropriate branches. Each dot represents an individual clone. Each colour corresponds to a different time point.
A
SVR group
SVR
8
E
99
63
88
99
66
0.01
B
W1
W4
0.01
SVR3
60
64
66
64
89
E
B
W1
W3
W2
82
62
64
0.01
NR
2
E
B
W1
W4
W12
L
62
70
0.01
R4
E
B
W1
W2
L
B
TF group
0.010.01 0.01 0.01
Virology Journal 2008, 5:78 />Page 8 of 15
(page number not for citation purposes)
contrast, within the TF group, inter-sample genetic dis-
tance variability revealed a slight decrease over time
(Table 3). None of these changes were significant (P >
0.05, Table 3). These findings are concordant with the
phylogenetic analysis indicative of a relative evolutionary
stasis of the viral population in response to interferon
based therapy within the TF group and a dynamic change
in the quasispecies population in response to interferon
based therapy within the SVR group.
Intra-sample and inter-sample genetic distance variability
was determined outside the HVR1 and in all groups this
Table 3: Intra- and intersample genetic variability of the HVR1 and outside the HVR1 over time in the two groups of patients
Region Patient
Group
Samples
a
Intrasample variability Samples
b
Intersample variability
Ks Ka Ka/Ks gd Ks Ka Ka/Ks gd
SVR E 0.0195 ±
0.0141
0.0308 ±
0.0130
0.998 0.0283 ±
0.0095
B 0.0236 ±
0.0175
0.0225 ±
0.0115*
0.850
†
0.0233 ±
0.0091
B-B 0.0236 ±
0.0175
0.0225 ±
0.0115*
0.850 0.0233 ±
0.0091
W1 0.0277 ±
0.0152
0.0302 ±
0.0100
1.067
‡
0.0302 ±
0.0087
B-W1 0.0293 ±
0.0160
0.0305 ±
0.0110
1.041 0.0305 ±
0.0095
W2 0.0050 ±
0.0025
0.0375 ±
0.0155
2.700 0.0280 ±
0.0125
B-W2 0.0070 ±
0.0045
0.0370 ±
0.0205
7.300 0.0285 ±
0.0125
W3/W4 0.0000 ±
0.0000
0.0135 ±
0.0075
NA 0.0095 ±
0.0045
B-W3/4 0.0015 ±
0.0015
0.0150 ±
0.0085
9.333 0.0110 ±
0.0055
HVR1
NR E 0.0292 ±
0.0185
0.0585 ±
0.0207
1.860 0.0492 ±
0.0145
B 0.0345 ±
0.0192
0.0802 ±
0.0227*
2.427
†
0.0667 ±
0.0185
B-B 0.0345 ±
0.0192
0.0802 ±
0.0227*
2.427 0.0667 ±
0.0185
W1 0.0172 ±
0.0115
0.0507 ±
0.0175
2.033
‡
0.0412 ±
0.0135
B-W1 0.0218 ±
0.0125
0.0538 ±
0.0178
2.332 0.0432 ±
0.0130
W2/4 0.0205 ±
0.0175
0.0320 ±
0.0135
1.574 0.0290 ±
0.0115
B-W2/4 0.0200 ±
0.0100
0.0325 ±
0.0135
1.648 0.0295 ±
0.0120
L 0.0160 ±
0.0033
0.008 ±
0.0036
0.285 0.0106 ±
0.0043
B-L 0.0153 ±
0.008
0.0133 ±
0.0057
0.873 0.0137 ±
0.0047
Outside
SVR E 0.0106 ±
0.005
0.0023 ±
0.0015
0.216 0.0045 ±
0.0016
B 0.0130 ±
0.0061
0.0036 ±
0.0020
0.277 0.0061 ±
0.0023
B-B 0.0130 ±
0.0061
0.0036 ±
0.0020
0.277 0.0061 ±
0.0023
W1 0.0052 ±
0.0022
0.0017 ±
0.0015
0.327 0.0027 ±
0.0012
B-W1 0.0050 ±
0.0020
0.0018 ±
0.0018
0.360 0.0025 ±
0.0013
W2 0.0035 ±
0.0025
0.0025 ±
0.0015
0.714 0.0025 ±
0.0020
B-W2 0.0035 ±
0.0025
0.0025 ±
0.0020
0.714 0.0025 ±
0.0020
W3/W4 0.0015 ±
0.0015
0.0010 ±
0.0010
0.667 0.0010 ±
0.0010
B-W3/4 0.0015 ±
0.0015
0.0010 ±
0.0010
0.667 0.0010 ±
0.0010
NR E 0.0612 ±
0.0205
0.0042 ±
0.0025
0.068 0.0180 ±
0.0052
B 0.0280 ±
0.0115
0.0017 ±
0.0012
0.061 0.0085 ±
0.0032
B-B 0.0280 ±
0.0115
0.0017 ±
0.0012
0.061 0.0085 ±
0.0032
W1 0.0132 ±
0.0085
0.0005 ±
0.0005
0.038 0.0040 ±
0.0022
B-W1 0.0148 ±
0.0090
0.0008 ±
0.0008
0.054 0.0043 ±
0.0025
W2/4 0.0100 ±
0.0060
0.0015 ±
0.0010
0.150 0.0047 ±
0.0026
B-W2/4 0.0095 ±
0.0060
0.0015 ±
0.0010
0.158 0.0035 ±
0.0020
L 0.0133 ±
0.0060
0.0006 ±
0.0006
0.045 0.0030 ±
0.0020
B-L 0.0140 ±
0.0057
0.0010 ±
0.0010
0.071 0.0043 ±
0.0020
a
The average number of nucleotide substitutions per nonsynonymous site and per synonymous site for all pairwise comparisons within each
sampling point.
b
The average number of nucleotide substitutions per nonsynonymous site and per synonymous site for all pairwise comparisons for
consensus of baseline for baseline sample (B-B) and follow-up samples (B-W1-2-3/4 and B-L). Ka/Ks indicate the ratio of nonsynonymous to
synonymous nucleotide substitutions. All data represent mean ± SEM. The statistical significance of comparisons among individual samples or
between the two groups of patients were analysed with non parametric Mann-Whitney U test.*, P = 0.05 for comparison between the two groups
of patient. †, P = 0.01 for comparison between the two groups of patient. ‡, P = 0.05 for comparison between the two groups of patient.
Virology Journal 2008, 5:78 />Page 9 of 15
(page number not for citation purposes)
regional analysis showed a lower rate of genetic variability
and heterogeneity over time (Table 3).
Rate of accumulation of synonymous and nonsynonymous
substitutions during treatment in patients with different
patterns of response
The accumulation rates of synonymous substitutions per
synonymous site (Ks) and nonsynonymous substitutions
per nonsynonymous site (Ka) were compared in each
group of patients to screen for positive selection in the
HVR1. Table 3 shows the intra-sample accumulation rates
of synonymous and nonsynonymous substitutions at
each time point and inter-sample accumulation rates of
synonymous and nonsynonymous substitutions when
compared to the consensus of the viral sequence derived
from the B time point.
At the HVR1, in both group of patients during therapy, the
intra-sample rate of nonsynonynous substitution was
higher than the rate of synonymous substitution indicat-
ing that HVR1 is under positive selection (ratio Ka/Ks > 1).
The number of both synonymous (Ks) and nonsynony-
mous (Ka) substitutions over time was higher within the
TF group compared to the SVR group with a significant
difference observed at B time point for Ka (P = 0.025,
Table 3). Furthermore, the intra-sample ratio Ka/Ks was
significantly higher in the TF group when compared to the
SVR group at B time point (P = 0.01, Table 3) and at W1
time point (P = 0.05, Table 3). This result is consistent
with the higher intra-sample QC and QD at B time within
the TF group when compared with the SVR group. No sig-
nificant difference was observed between the two groups
of patients for the other follow up samples probably due
to the limited number of sample available (P > 0.05, Table
3).
Inter-sample analysis within the SVR group showed a rel-
atively stable Ka, associated with a decreasing Ks, hence,
an increase in the magnitude of the Ka/Ks ratio in
response to interferon based therapy (Table 3). In con-
trast, inter-sample analysis within the TF group showed a
concomitant decline in Ka and Ks resulting in a progres-
sive decrease of the Ka/Ks ratio in response to interferon
based therapy (Table 3). Overall, intra-sample analysis
indicates that while the QC remains relatively stable over
time, the actual amino acid composition changes due to
nonsynonynous mutations in the SVR group likely due to
enhanced positive selection in the SVR group compared to
the TF group. In contrast, the intra-sample and the inter-
sample substitutions outside the HVR1 were mainly syn-
onymous in all groups of patients suggesting that this
region evolved under purifying selection (Table 3).
Sequence analysis of the molecular clones with the 12 bp
insertion
A total of 30 molecular clones were found to contain a 12
bp in-frame insertion. All these molecular clones
belonged to patient SVR6, a patient from the SVR group
who had been examine at E and B time point only,
because no viral RNA was recovered after viraffinity proto-
col on the W1 sample (Table 1). For this particular
patient, at E time point, 50% of clones (n = 10/20) con-
tained the 12 bp insertion encoding the following amino
acids: KTGG (EU023503
–EU023512). At B time point
100% of clones (n = 20) contained the 12 bp insertion
with 2 different non-synonymous mutations compared to
the original 4 aa motif. The 12 bp insertion encoded the
aa sequence KTDG within 85% of clones (EU023525
,
EU023526
and EU023528–EU023542), whereas the 12
bp insertion of the remaining 15% of individual clones
encoded the aa sequence KTEG (EU023523
, EU023524
and EU023527). Interestingly, the 3 different species har-
bouring the insertion contained no synonymous muta-
tions within the region sequenced. Furthermore, the 3
variants showed conservation of 3/4 aa, the aa change
occurring always at the third position of this short motif.
The variant with the insertion at E time point encodes for
a Glycine (G) at the third position whereas the two other
variants present at B time point encode for an Aspartic
Acid (D) or a Glutamic Acid (E). Aspartic Acid and the
Glutamic Acid are both hydrophilic, polar and negatively
charged amino acids whereas Glycine is a less hydrophilic
and neutral amino acid (i.e. uncharged). These differences
suggest that KTDG and KTEG motifs present at B time
point are more likely coding for external motifs with the
potential to bind to positively-charged molecules. These
findings strongly suggest that the 12 bp insertion may be
an important part of the quasispecies evolution.
The HVR1 of the HCV genome in this particular quasispe-
cies population, i.e., SVR6, likely encodes 31 aa instead of
27 aa. In fact this is not the first description of a 12 nucle-
otides in-frame insertion at this position. However, this is
the first reported, to our knowledge, of an in-frame inser-
tion in a genotype 3a virus. Aizaki et al. [52] have reported
a 12 nucleotides in-frame insertion at exactly the same
position, junction of the E1 and E2 regions, within a gen-
otype 1b isolate. Only a limited number of other variants
harbouring insertions of 1 to 4 amino acids without frame
shift have been reported [53-57]. These insertions
occurred at the same position as the insertion we
described here, i.e., 5'end of the 27 aa HVR1 [52,54]) or
after the first amino acid within the HVR1 [53,55-57].
Based on GenBank database sequence analysis we found
no sequence identity at both nucleotide and amino acid
level between our sequence and the few variants already
published [52-57]. According to their recent data, Torres-
Puente et al. argued that variability in the size of the HVR1
Virology Journal 2008, 5:78 />Page 10 of 15
(page number not for citation purposes)
could affect its antigenic property and its ability to bind to
cellular receptor [57]. Their results suggest a possible asso-
ciation between the presence of insertion and a lack of
response to therapy for genotype 1b infected patients. In
contrast in our study, the patient harbouring the insertion
within the HVR1 had showed a sustained virological
response after the end of therapy. Further studies are
needed to definitively understand the contribution of
these naturally occurring variant viruses to the HCV qua-
sispecies population dynamics and their implication in
the HCV life cycle and pathogenicity.
Discussion
In this retrospective study we aimed to characterise QS
evolution in chronically infected hepatitis C genotype 3a
patients, (1) in the pre-treatment period and (2) during
the course of standard combination anti-viral therapy.
The study outlined here is the first to evaluate QS genetic
evolution in a single HCV genotype 3a population. Treat-
ment resulted in an early virological response rate of 90%
(TND at week 1 to 4 of treatment), an end of treatment
response rate of 90% and a sustained virological response
rate of 60%. The rate of SVR reported here is slightly lower
than the rate for larger studies [58] for genotype 3a
patients, probably because of the limited number of sam-
ples analysed. Age, BMI and viral load were not associated
with treatment outcome as previously demonstrated in
larger genotype 3a population studies [49,50]. In the
present study, we have described (1) temporal changes
during the pre-treatment period in Sn-aa and in HD and
(2) how these changes in Sn-aa and HD relate to treat-
ment outcome. Baseline complexity was significantly
lower in the SVR groups compared to the TF group (P =
0.019 for Sn-aa and in HD).
Our results are in broad agreement with previous studies
that have investigated viral genetic parameters as possible
predictive markers of treatment outcome [28,37,43].
However, our study advances these observations and fur-
ther confirms the findings reported by Yeh et al. on a
homogeneous population of HCV genotype 1b infected
patients. Our data suggests that it may be possible to pre-
dict treatment outcome on the basis of QC at an earlier
stage in the treatment regimen [30]. The observed vari-
ances between our study and those of Farci et al. and
Chambers et al. is likely due to differences in the genotype
composition of the study population, in the methodolog-
ical approach and in the genetic parameters examined
[28,37,43]. In the study reported here, variables were con-
trolled to reduce the number of parameters contributing
to the analysis: (1) single genotype/subtype examined, (2)
evolution rates were controlled by use of intra-patient
data, (3) sera was normalised to 4 log
10
IU/mL and (4) a
previously validated proof-reading DNA polymerase
based PCR methodology was used [51]. This study design,
in particular, the use of intra-patient versus inter-patient
controls and the use of a proof reading polymerase, likely
accounts for the differences in the proportion of defective
or unreadable clones (0.006) seen in our study and that
reported by Farci et al. (0.099), P < 10
-6
(data not shown)
[28]. Consequently, the inferred HCV quasispecies com-
plexity defined in our study is likely more reflective of the
true quasispecies complexity in vivo.
It is widely accepted that the genotype of the infecting
virus has a very large impact on treatment efficacy and the
kinetics of response in terms of actual viral load. Perhaps
the quasispecies dynamic also varies by according to gen-
otype. The investigation of the molecular changes induced
by an interferon based therapy in a mixed HCV genotype
infected population suffers from this caveat. [28,37].
Abbate et al. and Yeh et al. have both examined a homo-
geneous population of HCV genotype 1b infected patients
[30,43]. At baseline, Yeh et al. found that the quasispecies
complexity at the amino acid level was significantly lower
in the SVR group than in the TF group. Conversely, Abbate
et al., despite using a homogeneous genotype population
and importantly utilised a proofreading DNA polymerase
protocol, did not find any significant difference between
the SVR and the TF group with respect to Shannon entropy
at the nucleotide level [30,43]. However, Abbate et al. did
not present data relating to Shannon entropy at the amino
acid level [43]. Chambers et al. in their study on HCV gen-
otype 1a and 1b infected patients described a trend
towards a greater pre-treatment amino acid complexity in
the HVR1 amongst non-responders and this pattern was
significantly associated with a higher likelihood of non-
response [37]. However, the authors have additionally
concluded that this trend could not significantly distin-
guish responders from non-responders based on achieve-
ment of a SVR [37]. Our study showed that a significant
difference between the SVR and the TF group existed for
Shannon entropy at the amino acid level but not at the
nucleotide level. These latter results are consistent with
Yeh et al [30].
The diversity, measure by the mean HD, was significantly
lower in the SVR group when compare to the TF group in
our study population. This result indicates that, at base-
line in the SVR group, the individual viral strains are
closely related to each other, as the mean HD defines the
diversity among a set of sequences. Farci et al. did not cor-
relate the mean HD results at baseline to the different pat-
terns of response [28]. Therefore it is difficult to directly
compare the two studies based on the mean HD parame-
ter.
Our findings document patterns of quasispecies change in
the HVR1 in a genotype 3a population in the months
prior to the start of therapy. Therapy-driven changes to the
Virology Journal 2008, 5:78 />Page 11 of 15
(page number not for citation purposes)
quasispecies are a key viral trait in the early response to the
therapeutic pressure and likely vary according to the gen-
otype sensitivity to pegylated interferon and ribavirin.
Abbate et al. have reported results supporting this concept,
in a single genotype population, and have postulated that
the evaluation of viral quasispecies at time points earlier
than baseline is likely to be more informative with respect
to viral evolution [43]. Collectively this information begs
the following question: what mechanism could rationally
explain why a low level of quasispecies complexity and
diversity prior to the start of anti-viral therapy correlates
with therapy induced HCV viral clearance? Replicative
homeostasis may provide a mechanistic explanation [44-
47].
Replicative homeostasis (RH) consists of an epicyclical
regulatory mechanism which links dynamically RNA
polymerase function with quasispecies phenotypic diver-
sity resulting in the formation of stable, but reactive, rep-
licative equilibria [47]. Experimental evidence for RH has
been recently reported by Chen et al. in Hepatitis B virus
infection [48]. In brief, RH hypothesises that a RDRP that
is highly processive has a reduced replication fidelity
resulting in a high intracellular concentration of mutant
genomes and consequently, a mutant spectrum of pro-
teins. This mutant protein population (out) competes
with wild type forms and RNA polymerase interactions
resulting in a progressive increase in RDRP fidelity. Hepa-
titis C has a breadth of sequence space within which
mutations can be tolerated. This epicyclic variation in
viral sequence space is continuously constrained by fac-
tors such as viral fitness and the totality of the host's
defence systems. The normalised Shannon entropy at the
amino acids level (Sn-aa) can be considered, in part, a
measure of the fidelity of the RDRP. However, fidelity can
be influence by other factors. High Sn-aa equates to a
highly processive RDRP, which equates to a high quasis-
pecies complexity. The potential pre-treatment efficacy of
peglyated interferon based therapy is related to Sn-aa, in
our study population, as evidence by the fact that the SVR
group had a significantly lower Sn-aa at time point B
when compared to the TF group (P = 0.019, Figure 1A).
The normalised Shannon entropy at the amino acids level
could therefore be used to predict treatment outcome
before therapy has started in a genotype 3a population.
The differences between the Sn-aa at the E and B time
point, even within the limited sample set examined, indi-
cated that oscillations in the Sn-aa value occur over a short
period of time. These oscillations are of limited variance
for the SVR group with a trend towards reduced Sn-aa (-
0.026, Table 2) and according to RH likely to be in a phase
where RDRP fidelity is high [47]. Knowledge of the Sn-aa
may assist in the pre-treatment identification of the
approximate 20% of HCV 3a patients who will not
respond to pegylated interferon based anti-viral therapy.
The separation of SVR from TF based on Sn-aa and HD
suggests that real time mapping of QC and QD may iden-
tify windows of reduced Sn-aa and HD and by association,
windows of enhanced treatment efficacy. Two cases that
highlight the possible existence of windows of enhanced
treatment efficacy are (1) SVR8 and, (2) NR2 (Figure 3):
(1) SVR8 exhibited a Sn-aa and HD for the E sample that
were considerably higher than that recored for the B sam-
ple, 0.467 versus 0.067, and, 10.80 versus 5.20, respec-
tively. While it is impossible to predict what the treatment
outcome would have been at time point E, the quasispe-
cies complexity at time point B is less, existing primarily as
a single strain representing 95% of clones recovered.
Based on the Sn-aa, the extent of clonotype diversity and
the HD, perhaps the timing of treatment of SVR8 was for-
tuitous. (2) Conversely, NR2 may have had a window of
greater efficacy 24 weeks prior to the initiation of therapy.
Specifically, the Sn-aa and HD for NR2 between the E and
B time points were 0.173 versus 0.481, and, 1.40 versus
5.40, respectively. The expansion of the viable sequence
space for the pre-treatment B sample correlates with
reduced treatment efficacy.
The SFR (SVR12) represents an extreme example of RDRP
fidelity which results in a collapsing of the quasispecies
diversity at the HVR1 and likely viable sequence space.
The addition of exogenous pegylated interferon and riba-
virin further restricts the viable sequence space and in
combination with a RDRP of high fidelity results in viral
extinction.
Conclusion
In conclusion, low Sn-aa and low HD at baseline are sig-
nificantly associated with the clearance of HCV in this
genotype 3a population. The replicative homeostasis
hypothesis provides a probable mechanistic explanation
for our findings [30,47,48]. Temporal windows of
enhanced efficacy for pegylated-interferon based therapy
may exist, although this will require prospective evalua-
tion.
Methods
Patients
Ten patients with a chronic HCV genotype 3a infection (7
females and 3 men, mean age of 41 ± 9 years) were
included in the present retrospective study. All the
patients had been treated with standard pegylated α-2a
interferon plus ribavirin for 24 weeks and 9/10 patients
were treatment naïve at the start of the therapy (Table 1).
Previously, patient SVR9 had been treated with Interferon
A alone for a period of 3 months. SVR9 was off treatment
for 6.5 years before the start of the standard pegylated α-
2a interferon plus ribavirin treatment course. All HCV
viral load measurements were determined by use of com-
mercial assay Ampliprep/COBAS-TaqMan 48 platform
Virology Journal 2008, 5:78 />Page 12 of 15
(page number not for citation purposes)
(Roche Diagnostic, UK) (Table 1). Treatment outcome
was defined by viral status six months post-cessation of
therapy, i.e., non detectable viral RNA equated to a sus-
tained virological response (SVR) and presence of detect-
able viral RNA equated to a treatment failure (TF). For the
purpose of this study, sera samples were classified in (1)
SVR or (2) TF in accordance to their treatment outcome
(Table 1). A waiver of consent was provided by Clinical
Research Ethics Committee of the Cork Teaching Hospi-
tals as samples used in this study were surplus to require-
ments following diagnostic investigations.
Design of the study
The number of viral variants, the genetic distance among
the different variants (genetic diversity), the level of com-
plexity (Shannon entropy), the evolution of HCV quasis-
pecies and the level of viral replication were studied in
serial serum samples obtained at different time points
before and during the course of therapy.
All serum samples were normalised to 4 log
10
IU/mL
before RNA preparation in order to (1) standardise ampli-
fication efficiencies for intra and inter-patients sera and
(2) reduce the number of variables relative to the study.
The lower limit of detection (LOD) of the HVR1 RT-PCR
reaction was 3 log
10
IU/mL. Viral load 4 log
10
IU/mL was
chosen as the normalisation point for all samples.
Viraffinity reagent (Biotech Support Group, US), allows
the capture and the subsequent recovery of whole infec-
tious virions, viral components, and sample preparation
for subsequent detection and analysis. In the present
study, 7 serum samples which had RNA level between 3–
4 log
10
IU/mL were treated with the Viraffinity™ reagent
(Table 1).
For each patient the following serial serum samples were
obtained: one sample between 6 to 12 months before the
start of treatment (hence E, for early), one sample at day 0
before the start of treatment (hence B, for baseline) and
one at week 1 of treatment (hence W1) (Table 1). Addi-
tional serial serum samples were analysed, according to
the pattern of response, between week 2 and week 12 of
treatment (hence, W2–W12) (Table 1). A later sample
(hence, L) was analysed for the TF group (Table 1). In
relapse patients, the later sample was taken at time of
relapse, between 2 to12 weeks after the cessation of ther-
apy and in the non-responder patient it was taken 3 weeks
after the end of treatment (Table 1).
Amplification of the E1/E2 region encompassing the HVR1
All serum was normalised to 4 log
10
IU/mL by dilution in
buffer Tris-Hcl 10 mM pH 7.5. Total RNA was extracted
from 140 μl of the normalised sera (QIAmp Viral RNA
Mini kit, Qiagen, UK) and eluted in 60 μl of molecular
biology grade water. For the 7 serum samples which had
RNA level between 3 log
10
(LOD of RT-PCR reaction) and
4 log
10
IU/mL, 1 ml of pure serum was processed in pres-
ence of 250 μl Viraffinity™ reagent (Biotech Support
Group, US) according to the manufacturer recommenda-
tions and viral particles when recovered at the last round
of centrifugation were directly lysed into 560 μl of lysis
buffer provided in the QIAmp Viral RNA Mini kit (Qia-
gen, UK). Unfortunately, 4 samples had insufficient RNA
to permit amplification even after Viraffinity treatment
and were therefore excluded from the study (Table 1).
0.5 μg random primers mix (Promega, Madison, WI) was
added to 11 μl of RNA. The RNA and primer mixture was
heated at 75°C for 10 min. and then cooled on wet ice. To
this was added 400 μM dNTPs (Roche, UK), 40 units
RNAse inhibitor (Promega, Madison, WI), 4 μl of AMV RT
5× reaction buffer and 10 units of AMV reverse tran-
scriptase (Promega, Madison, WI) to a final volume of 20
μl. The reaction was incubated at 42°C for 60 min. with a
final 94°C, 3 min. enzyme denaturation step. The ampli-
fication of E1/E2 region encompassing the HVR1 was car-
ried out by use of nested primers, hence, set I previously
described by Ju Lin et al resulting in a 320 bp fragment
extending from nucleotides 1254 to 1572 according to
reference strain HCVCENS1 genotype 3a (GenBank acces-
sion no X76918
)[59]. The primer sequences were as fol-
low (5' to 3'): outer forward, OF (I),
ATGGCATGGGATATGAT; outer reverse, OR (I), AAG-
GCCGTCCTGTTGA; inner forward, IF (I), GCATGGGA-
TATGATGATGAA; inner reverse, IR (I),
GTCCTGTTGATGTGCCA. The PCR reactions were per-
formed with the proofreading Pwo DNA polymerase
(Roche Molecular Biochemicals, UK) to ensure the accu-
racy of observed quasispecies diversity as previously
described by Mullan et al. [51]. First round-PCR was per-
formed by mixing 5 μl of RT reaction mixture to a final
volume of 50 μl containing 15 pmol each of OF (I) and
OR (I) primers, 200 μM dNTP mix, 5 μl 10× Pwo PCR
MgSO
4
free buffer (Roche, UK), 1.5 mM MgSO
4
and 2.5
units of Pwo DNA Polymerase. Samples were amplified in
a GeneAmp PCR System 2700 thermal cycler (Perkin
Elmer, Kenilworth, NJ) under the following thermal
cycling profile: 3 min. at 94°C for initial denaturation of
cDNA; 35 cycles of 94°C, 15 s; 51°C, 30 s and 72°C, 45
s; followed by final elongation at 72°C for 7 min. The sec-
ondary nested PCR reaction was done using 4 μl of pri-
mary PCR product as a template and identical
composition to the first round of PCR, except for the rele-
vant nested primer set, IF (I) and IR (I) (15 pmol each), a
MgSO
4
concentration adjustment to 1 mM and a melting
temperature (Tm) of 53°C for the annealing step.
Suitable precautions were taken to reduce the risk of inter-
sample contamination as suggested by Kwok and Higuchi
[60]. In addition, for each test sample, a negative control
Virology Journal 2008, 5:78 />Page 13 of 15
(page number not for citation purposes)
was analysed in parallel throughout the entire procedure.
To screen for potential contamination of product DNA,
the viral sequences were analysed by cross comparisons of
all PCR product sequences included in the study as well as
comparisons with other viral sequences generated in the
laboratory by using a Neighbor-Joining algorithm
(PHYLIP) [61].
Molecular cloning and sequencing
After gel purification (Qiaquick Gel Extraction Kit, QIA-
GEN, UK), the amplicons from E1/E2 were cloned into
pCR4 Blunt-Topo vector by use of the Zero Blunt TOPO
system (Invitrogen, Belgium) and transformed into chem-
ically competent Escherichia Coli strain TOP10 (Invitro-
gen, Belgium). This cloning kit provides a quick and
highly efficient one-step cloning strategy for direct inser-
tion of blunt-end PCR products, generated by thermosta-
ble proof reading polymerases such as Pwo DNA
polymerase, into a plasmid vector specifically designed
for sequencing. Transformants were detected and 20
recombinant clones for each sample were selected at ran-
dom, plasmid DNA was purified by use of QIAprep Spin
Miniprep Kit (Qiagen, UK) and screened for presence of
inserts. The double-stranded plasmid DNA sequencing
was out sourced to MWG-Biotech, Germany. Where
sequences had a high degree of homogeneity primary and
secondary PCR amplicons were re-generated in duplicate
from the initial cDNA template. After cloning into pCR4
Blunt-Topo vector only 5 additional clones were recov-
ered for each new generated amplicon, purified and
sequenced as previously described.
GenBank accession numbers
The sequences reported in this study have been assigned
the following GenBank accession nos (EU023073
–
EU023906
)
Sequence analysis of the E1/E2 region encompassing the
HVR1
Sequence similarities between the sequences generated
during this study were examined by use of the BLASTN
web program />Blast.cgi or />BASIC_BLAST/basic_blast.html.
Sequence alignments were performed with CLUSTALW
(version 1.74) /> as previ-
ously described [62]. Sequence analysis was performed
after exclusion of all the defective sequences due to nucle-
otide insertion or deletion or mutation producing a stop
codon. Genetic diversity was calculated by analysis of pre-
dicted amino acid sequences amplified from E1 and E2
genes of the HCV genome including and excluding the 27
aa of the HVR1. The genetic diversity was calculated as
Hamming distance, or (1-S) ×100, where S is the fraction
of shared sites in two aligned nucleotide sequences. The
mean Hamming distance which is the average of the val-
ues taken for all sequence pairs derived from a single sam-
ple was separately calculated within the HVR1 (27 aa) and
on the sequence outside the HVR1 (62 aa) [28]. The mean
genetic distance (GD), the number of synonymous
(silent) nucleotide substitutions per synonymous site (Ks)
and the number of nonsynonymous (amino acid replace-
ment) nucleotide substitutions per nonsynonymous site
(Ka) were calculated with the Kimura two-parameter
method, all sites, in the Molecular Evolutionary Genetics
Analysis software package (MEGA2 program, [63]. The
average number of Ks and the average number of Ka rela-
tive to the ancestral consensus sequence were calculated
for each time point within a single patient with the
MEGA2 program. Sequences obtained from each time
point were compared with the consensus reference
sequence of the baseline sample [28,37].
The complexity of the HCV strain in the region of interest
was quantified by calculating the normalised Shannon
entropy (Sn) at both nucleotides and amino acids level.
The Shannon entropy is a measure of the proportion of
identical sequences in a mutant distribution. The possible
values of Sn range from zero (when all genomes are iden-
tical) to one (when all genomes differ from one another).
Sn was calculated following the formula: Sn = Σ
i
[(p
i
× ln
p
i
)ln n], in which p
i
is the frequency of each sequences in
the mutant spectrum and n is the total number of
sequences compared [64]. Phylogenetic analyses were
conducted by using the NEIGHBOR program in the
PHYLIP package [65], as previously described [62].
Statistical analysis
The results are expressed as the mean ± SE. The statistical
significance of comparisons among individual samples or
between the two groups of patients were analysed with
non parametric Mann-Whitney U test. A Chi Square Test
was performed to compare the overall proportion of via-
ble sequences obtained in our study and in Farci et al.
study [28]. In all tests a P value less than 0.05 was consid-
ered statistically significant.
Competing interests
The authors declare that they have no competing interests.
Authors' contributions
IM contributed to the experimental design, sequence
alignments, data analysis and preparation of manuscript.
JL determined qualitative, quantitative and genotype of
clinical specimens described here. OC and EKW are clini-
cians who manage HCV at Cork University Hospital. LF
supervised the project and assisted with analysis and prep-
aration of manuscript.
Virology Journal 2008, 5:78 />Page 14 of 15
(page number not for citation purposes)
Acknowledgements
The authors would like to gratefully acknowledge the expert assistance
provided by Professor Richard Sallie (Perth, Australia. Email: sal-
) in the preparation of this manuscript. Funding for this study
was provided by an unrestricted research grant from Roche Pharmaceuti-
cals, Ireland to EKW and LJF.
References
1. NIH: NIH Consensus Statement on Management of Hepatitis
C: 2002. NIH Consens State Sci Statements 2002, 19:1-46.
2. WHO: 2006 [ />whocdscsrlyo2003/en/index3.html].
3. Moradpour D, Cerny A, Heim MH, Blum HE: Hepatitis C: an
update. Swiss Med Wkly 2001, 131:291-298.
4. Simmonds P, McOmish F, Yap PL, Chan SW, Lin CK, Dusheiko G,
Saeed AA, Holmes EC: Sequence variability in the 5' non-coding
region of hepatitis C virus: identification of a new virus type
and restrictions on sequence diversity. J Gen Virol 1993, 74(Pt
4):661-668.
5. Simmonds P: Variability of hepatitis C virus genome. Curr Stud
Hematol Blood Transfus 1994:12-35.
6. Smith DB, Pathirana S, Davidson F, Lawlor E, Power J, Yap PL, Sim-
monds P: The origin of hepatitis C virus genotypes. J Gen Virol
1997, 78(Pt 2):321-328.
7. Simmonds P: Clinical relevance of hepatitis C virus genotypes.
Gut 1997, 40:291-293.
8. Simmonds P: The origin and evolution of hepatitis viruses in
humans. J Gen Virol 2001, 82:693-712.
9. Simmonds P: Genetic diversity and evolution of hepatitis C
virus–15 years on. J Gen Virol 2004, 85:3173-3188.
10. Simmonds P, Bukh J, Combet C, Deleage G, Enomoto N, Feinstone S,
Halfon P, Inchauspe G, Kuiken C, Maertens G, Mizokami M, Murphy
DG, Okamoto H, Pawlotsky JM, Penin F, Sablon E, Shin IT, Stuyver LJ,
Thiel HJ, Viazov S, Weiner AJ, Widell A: Consensus proposals for
a unified system of nomenclature of hepatitis C virus geno-
types. Hepatology 2005, 42:962-973.
11. Wasley A, Alter MJ: Epidemiology of hepatitis C: geographic
differences and temporal trends. Semin Liver Dis 2000, 20:1-16.
12. Chevaliez S, Pawlotsky JM: Hepatitis C virus: virology, diagnosis
and management of antiviral therapy. World J Gastroenterol
2007, 13:2461-2466.
13. Seeff LB: Natural history of chronic hepatitis C. Hepatology
2002, 36:S35-46.
14. Bowen DG, Walker CM: The origin of quasispecies: cause or
consequence of chronic hepatitis C viral infection? J Hepatol
2005, 42:408-417.
15. Martell M, Esteban JI, Quer J, Genesca J, Weiner A, Esteban R, Guar-
dia J, Gomez J: Hepatitis C virus (HCV) circulates as a popula-
tion of different but closely related genomes: quasispecies
nature of HCV genome distribution. J Virol 1992, 66:3225-3229.
16. Domingo E, Escarmis C, Sevilla N, Moya A, Elena SF, Quer J, Novella
IS, Holland JJ: Basic concepts in RNA virus evolution. Faseb J
1996, 10:859-864.
17. Domingo E, Gonzalez-Lopez C, Pariente N, Airaksinen A, Escarmis C:
Population dynamics of RNA viruses: the essential contribu-
tion of mutant spectra. Arch Virol Suppl 2005:59-71.
18. Shimizu YK, Igarashi H, Kiyohara T, Cabezon T, Farci P, Purcell RH,
Yoshikura H: A hyperimmune serum against a synthetic pep-
tide corresponding to the hypervariable region 1 of hepatitis
C virus can prevent viral infection in cell cultures. Virology
1996, 223:409-412.
19. Farci P, Purcell RH: Clinical significance of hepatitis C virus gen-
otypes and quasispecies. Semin Liver Dis 2000, 20:103-126.
20. Purcell R: The hepatitis C virus: overview. Hepatology 1997,
26:11S-14S.
21. Cox AL, Mosbruger T, Mao Q, Liu Z, Wang XH, Yang HC, Sidney J,
Sette A, Pardoll D, Thomas DL, Ray SC: Cellular immune selec-
tion with hepatitis C virus persistence in humans. J Exp Med
2005, 201:1741-1752.
22. Quiroga JA, Llorente S, Castillo I, Rodriguez-Inigo E, Lopez-Alcoro-
cho JM, Pardo M, Carreno V: Virus-specific T-cell responses
associated with hepatitis C virus (HCV) persistence in the
liver after apparent recovery from HCV infection. J Med Virol
2006, 78:1190-1197.
23. Poynard T, Marcellin P, Lee SS, Niederau C, Minuk GS, Ideo G, Bain
V, Heathcote J, Zeuzem S, Trepo C, Albrecht J: Randomised trial
of interferon alpha2b plus ribavirin for 48 weeks or for 24
weeks versus interferon alpha2b plus placebo for 48 weeks
for treatment of chronic infection with hepatitis C virus.
International Hepatitis Interventional Therapy Group
(IHIT). Lancet 1998, 352:1426-1432.
24. Reichard O, Norkrans G, Fryden A, Braconier JH, Sonnerborg A,
Weiland O: Randomised, double-blind, placebo-controlled
trial of interferon alpha-2b with and without ribavirin for
chronic hepatitis C. The Swedish Study Group. Lancet 1998,
351:83-87.
25. McHutchison J: Hepatitis C therapy in treatment-naive
patients. Am J Med 1999, 107:56S-61S.
26. Davis GL, Esteban-Mur R, Rustgi V, Hoefs J, Gordon SC, Trepo C,
Shiffman ML, Zeuzem S, Craxi A, Ling MH, Albrecht J: Interferon
alfa-2b alone or in combination with ribavirin for the treat-
ment of relapse of chronic hepatitis C. International Hepati-
tis Interventional Therapy Group. N Engl J Med 1998,
339:1493-1499.
27. Hu KQ, Vierling JM, Redeker AG: Viral, host and interferon-
related factors modulating the effect of interferon therapy
for hepatitis C virus infection. J Viral Hepat 2001, 8:1-18.
28. Farci P, Strazzera R, Alter HJ, Farci S, Degioannis D, Coiana A, Peddis
G, Usai F, Serra G, Chessa L, Diaz G, Balestrieri A, Purcell RH: Early
changes in hepatitis C viral quasispecies during interferon
therapy predict the therapeutic outcome. Proc Natl Acad Sci
USA 2002, 99:3081-3086.
29. Thimme R, Bukh J, Spangenberg HC, Wieland S, Pemberton J, Steiger
C, Govindarajan S, Purcell RH, Chisari FV: Viral and immunologi-
cal determinants of hepatitis C virus clearance, persistence,
and disease. Proc Natl Acad Sci USA 2002, 99:15661-15668.
30. Yeh BI, Han KH, Lee HW, Sohn JH, Ryu WS, Yoon DJ, Yoon J, Kim
HW, Kong ID, Chang SJ, Choi JW: Factors predictive of response
to interferon-alpha therapy in hepatitis C virus type 1b infec-
tion. J Med Virol 2002, 66:481-487.
31. Le Guillou-Guillemette H, Vallet S, Gaudy-Graffin C, Payan C, Pivert
A, Goudeau A, Lunel-Fabiani F: Genetic diversity of the hepatitis
C virus: impact and issues in the antiviral therapy. World J Gas-
troenterol 2007, 13:2416-2426.
32. Moradpour D, Blum HE: Therapy of chronic hepatitis C. Schweiz
Rundsch Med Prax 2006, 95:1451-1457.
33. Weiner AJ, Geysen HM, Christopherson C, Hall JE, Mason TJ, Saracco
G, Bonino F, Crawford K, Marion CD, Crawford KA, Brunetto M,
Barr PJ, Miyamura T, Mchutchinson J, Houghton M: Evidence for
immune selection of hepatitis C virus (HCV) putative enve-
lope glycoprotein variants: potential role in chronic HCV
infections.
Proc Natl Acad Sci USA 1992, 89:3468-3472.
34. Mondelli MU, Cerino A, Meola A, Nicosia A: Variability or conser-
vation of hepatitis C virus hypervariable region 1? Implica-
tions for immune responses. J Biosci 2003, 28:305-310.
35. Silini E, Belli L, Brambilla S, Foti L, Gritti C, Lisa A, Alberti AB, Vinci
M, De Carlis L, Rondinara G, Pinzello G: Sequence variation in the
hypervariable region 1 of hepatitis C virus and posttrans-
plantation recurrent hepatitis. Liver Transpl 2003, 9:1040-1047.
36. Pavio N, Lai MM: The hepatitis C virus persistence: how to
evade the immune system? J Biosci 2003, 28:287-304.
37. Chambers TJ, Fan X, Droll DA, Hembrador E, Slater T, Nickells MW,
Dustin LB, Dibisceglie AM: Quasispecies heterogeneity within
the E1/E2 region as a pretreatment variable during
pegylated interferon therapy of chronic hepatitis C virus
infection. J Virol 2005, 79:3071-3083.
38. Sandres K, Dubois M, Pasquier C, Payen JL, Alric L, Duffaut M, Vinel
JP, Pascal JP, Puel J, Izopet J: Genetic heterogeneity of hypervar-
iable region 1 of the hepatitis C virus (HCV) genome and
sensitivity of HCV to alpha interferon therapy. J Virol 2000,
74:661-668.
39. Salmeron J, De Rueda PM, Ruiz-Extremera A, Casado J, Huertas C,
Bernal Mdel C, Rodriguez L, Palacios A: Quasispecies as predic-
tive response factors for antiviral treatment in patients with
chronic hepatitis C. Dig Dis Sci 2006, 51:960-967.
40. Pawlotsky JM, Germanidis G, Frainais PO, Bouvier M, Soulier A, Pel-
lerin M, Dhumeaux D: Evolution of the hepatitis C virus second
envelope protein hypervariable region in chronically
infected patients receiving alpha interferon therapy. J Virol
1999, 73:6490-6499.
Publish with BioMed Central and every
scientist can read your work free of charge
"BioMed Central will be the most significant development for
disseminating the results of biomedical research in our lifetime."
Sir Paul Nurse, Cancer Research UK
Your research papers will be:
available free of charge to the entire biomedical community
peer reviewed and published immediately upon acceptance
cited in PubMed and archived on PubMed Central
yours — you keep the copyright
Submit your manuscript here:
/>BioMedcentral
Virology Journal 2008, 5:78 />Page 15 of 15
(page number not for citation purposes)
41. Nagaki M, Imose M, Naiki T, Kimura K, Hayashi H, Shimizu M, Ohnishi
H, Tomita E, Sugihara J, Amano K, Sakai T, Kojima T, Katsumura N,
Kondo Y, Fujimoto M, Moriwaki H: Prospective study on early
virologic response to treatment with interferon alpha-2b
plus ribavirin in patients with chronic hepatitis C genotype
1b. Hepatol Res 2005, 33:285-291.
42. Kumagai N, Kaneko F, Tsunematsu S, Tsuchimoto K, Tada S, Saito H,
Hibi T: Complexity of the HVR-1 quasispecies and disease
activity in patients with hepatitis C. Eur J Clin Invest 2007,
37:566-572.
43. Abbate I, Lo Iacono O, Di Stefano R, Cappiello G, Girardi E, Longo R,
Ferraro D, Antonucci G, Di Marco V, Solmone M, Craxi A, Ippolito
G, Capobianchi MR: HVR-1 quasispecies modifications occur
early and are correlated to initial but not sustained response
in HCV-infected patients treated with pegylated- or stand-
ard-interferon and ribavirin. J Hepatol 2004, 40:831-836.
44. Sallie R: Replicative homeostasis: a mechanism of viral per-
sistence. Med Hypotheses 2004, 63:515-523.
45. Sallie R: Replicative homeostasis: a fundamental mechanism
mediating selective viral replication and escape mutation.
Virol J 2005, 2:10.
46. Sallie R: Replicative homeostasis II: influence of polymerase
fidelity on RNA virus quasispecies biology: implications for
immune recognition, viral autoimmunity and other "virus
receptor" diseases. Virol J 2005, 2:70.
47. Sallie R: Replicative homeostasis III: implications for antiviral
therapy and mechanisms of response and non-response. Virol
J 2007, 4:29.
48. Chen CY, Crowther C, Kew MC, Kramvis A: A valine to phenyla-
lanine mutation in the precore region of hepatitis B virus
causes intracellular retention and impaired secretion of
HBe-antigen. Hepatol Res 2008, 38:580-92.
49. Powis J, Peltekian KM, Lee SS, Sherman M, Bain VG, Cooper C, Kra-
jden M, Deschenes M, Balshaw RF, Heathcote EJ, Yoshida EM:
Exploring differences in response to treatment with
peginterferon alpha 2a (40 kD) and ribavirin in chronic hep-
atitis C between genotypes 2 and 3.
J Viral Hepat 2008, 15:52-57.
50. Mangia A, Santoro R, Minerva N, Ricci GL, Carretta V, Persico M,
Vinelli F, Scotto G, Bacca D, Annese M, Romano M, Zechini F, Sogari
F, Spirito F, Andriulli A: Peginterferon alfa-2b and ribavirin for
12 vs. 24 weeks in HCV genotype 2 or 3. N Engl J Med 2005,
352:2609-2617.
51. Mullan B, Kenny-Walsh E, Collins JK, Shanahan F, Fanning LJ: Inferred
hepatitis C virus quasispecies diversity is influenced by
choice of DNA polymerase in reverse transcriptase-
polymerase chain reactions. Anal Biochem 2001, 289:137-146.
52. Aizaki H, Saito A, Kusakawa I, Ashiwara Y, Nagamori S, Toda G,
Suzuki T, Ishii K, Matsuura Y, Miyamura T: Mother-to-child trans-
mission of a hepatitis C virus variant with an insertional
mutation in its hypervariable region. J Hepatol 1996,
25:608-613.
53. Kato N, Ootsuyama Y, Tanaka T, Nakagawa M, Nakazawa T, Muraiso
K, Ohkoshi S, Hijikata M, Shimotohno K: Marked sequence diver-
sity in the putative envelope proteins of hepatitis C viruses.
Virus Res 1992, 22:107-123.
54. Abe K, Inchauspe G, Fujisawa K: Genomic characterization and
mutation rate of hepatitis C virus isolated from a patient
who contracted hepatitis during an epidemic of non-A, non-
B hepatitis in Japan. J Gen Virol 1992, 73(Pt 10):2725-2729.
55. Hohne M, Schreier E, Roggendorf M: Sequence variability in the
env-coding region of hepatitis C virus isolated from patients
infected during a single source outbreak. Arch Virol 1994,
137:25-34.
56. Gerotto M, Dal Pero F, Loffreda S, Bianchi FB, Alberti A, Lenzi M: A
385 insertion in the hypervariable region 1 of hepatitis C
virus E2 envelope protein is found in some patients with
mixed cryoglobulinemia type 2. Blood 2001, 98:2657-2663.
57. Torres-Puente M, Cuevas JM, Jimenez-Hernandez N, Bracho MA,
Garcia-Robles I, Carnicer F, del Olmo J, Ortega E, Moya A, Gonzalez-
Candelas F: Contribution of insertions and deletions to the
variability of hepatitis C virus populations. J Gen Virol 2007,
88:2198-2203.
58. Patel K, Muir AJ, McHutchison JG: Diagnosis and treatment of
chronic hepatitis C infection. Bmj 2006, 332:
1013-1017.
59. Lin HJ, Seeff LB, Barbosa L, Hollinger FB: Occurrence of identical
hypervariable region 1 sequences of hepatitis C virus in
transfusion recipients and their respective blood donors:
divergence over time. Hepatology 2001, 34:424-429.
60. Kwok S, Higuchi R: Avoiding false positives with PCR. Nature
1989, 339:237-238.
61. Korber BT, Learn G, Mullins JI, Hahn BH, Wolinsky S: Protecting
HIV databases. Nature 1995, 378:242-244.
62. Moreau I, Hegarty S, Levis J, Sheehy P, Crosbie O, Kenny-Walsh E,
Fanning LJ: Serendipitous identification of natural intergeno-
typic recombinants of hepatitis C in Ireland. Virol J 2006, 3:95.
63. Kumar S, Tamura K, Jakobsen IB, Nei M: MEGA2: molecular evo-
lutionary genetics analysis software. Bioinformatics 2001,
17:1244-1245.
64. Volkenstein MV: Physical approaches to biological evolution Berlin, Ger-
many: Springer-Verlag; 1994.
65. Felsenstein J: Phylogeny Inference Package. University of Wash-
ington, Seattle, USA; 1995.