Process Engineering for Pollution Control and Waste Minimization_3 ppt
Bạn đang xem bản rút gọn của tài liệu. Xem và tải ngay bản đầy đủ của tài liệu tại đây (934.49 KB, 26 trang )
A directive shall be binding, as to the result to be achieved, upon each
Member State to which it is addressed, but shall leave to the national
authorities the choice of form and methods.
A decision shall be binding in its entirety upon those to whom it is
addressed. Recommendations and opinions shall have no binding force.
By the Treaty of Amsterdam the members of the European Community are
obligated to pursue a common environmental policy. Community policy on the
environment shall contribute to pursuit of the following objectives:
Preserving, protecting, and improving the quality of the environment
Protecting human health
Prudent and rational utilization of natural resources
Promoting measures at the international level to deal with regional or
worldwide environmental problems
Further Community policy on the environment shall aim at a high level of
protection, taking into account the diversity of situations in the various regions
of the Community. It shall be based on the precautionary principle and on the
principles that preventive action should be taken, that environmental damage
should as a priority be rectified at the source, and that the polluter should pay. In
this context, harmonization measures answering environmental protection re-
quirements shall include, where appropriate, a safeguard clause allowing Member
States to take provisional measures, for noneconomic environmental reasons,
subject to a Community inspection procedure.
Without prejudice to certain measures of a Community nature, the Member
States shall finance and implement the environment policy.
Without prejudice to the principle that the polluter should pay, if a measure
based on the provisions of paragraph 1 involves costs deemed disproportionate
for the public authorities of a Member State, the Council shall, in the act
adopting that measure, lay down appropriate provisions in the form of temporary
derogation, and/or financial support from the Cohesion Fund of the European
Community.
Exemplary discussed should be the newest and most important decisions
dealing with the universal treatment of wastes and the waste management
strategy.
2 EUROPEAN DIRECTIVES ON WASTE MANAGEMENT
2.1 European Parliament and Council Directive on
Packaging and Packaging Waste
The Directive on packaging and packaging waste aims to harmonize national
measures concerning the management of packaging and packaging waste in order,
Copyright 2002 by Marcel Dekker, Inc. All Rights Reserved.
on the one hand, to prevent any impact thereof on the environment of all Member
States as well as of third countries or to reduce such impact, thus providing a high
level of environmental protection, and, on the other hand, to ensure the function-
ing of the internal market and to avoid obstacles to trade and distortion and
restriction of competition within the Community. This Directive lays down
measures aimed, as a first priority, at preventing the production of packaging
waste and, as additional fundamental principles, at reusing packaging, at recycl-
ing and other forms of recovering packaging waste and, hence, at reducing the
final disposal of such waste. It covers all packaging placed on the market in the
Community and all packaging waste, whether it is used or released at industrial,
commercial, office, shop, service, household, or any other level, regardless of the
material used. This Directive shall apply without prejudice to existing quality
requirements for packaging such as those regarding safety, the protection of health
and the hygiene of the packed products or to existing transport requirements.
In this context, “packaging” shall mean all products made of any materials
of any nature to be used for the containment, protection, handling, delivery, and
presentation of goods, from raw materials to processed goods, from the producer
to the user or the consumer. “Nonreturnable” items used for the same purposes
shall also be considered to constitute packaging. Generally recommendable is the
prevention of packaging. Therefore it shall be ensured that preventive measures
are implemented. Such other measures may consist of national programs or
similar actions adopted, if appropriate in consultation with economic operators,
and designed to collect and take advantage of the many initiatives taken within
Member States as regards prevention. Furthermore, all Member States should
encourage reuse systems of packaging, which can be reused in an environmen-
tally sound manner, in conformity with the Treaty.
In order to comply with the objectives of this Directive, Member States
shall take the necessary measures to attain the following targets covering the
whole of their territory. No later than five years between 50% as a minimum and
65% as a maximum by weight of the packaging waste will be recovered.
Moreover, within this general target, and with the same time limit, between 25%
as a minimum and 45% as a maximum by weight of the totality of packaging
materials contained in packaging waste will be recycled, with a minimum of 15%
by weight for each packaging material. At least no later than 10 years from the
date by which this Directive must be implemented in national law, a percentage
of packaging waste will be recovered and recycled, which will have to be
determined by the Council.
Member States shall, where appropriate, encourage the use of materials
obtained from recycled packaging waste for the manufacturing of packaging and
other products.
Member States which have, or will, set programs going beyond the above-
mentioned targets and which provide to this effect appropriate capacities for
Copyright 2002 by Marcel Dekker, Inc. All Rights Reserved.
recycling and recovery, are permitted to pursue those targets in the interest of a
high level of environmental protection, on condition that these measures avoid
distortions of the internal market and do not hinder compliance by other Member
States with the Directive.
Member States shall take the necessary measures to ensure that systems are
set up to provide on the one hand the collection and return of used packaging and
packaging waste from the consumer, other final user, or from the waste stream in
order to channel it to the most appropriate waste management alternatives. On the
other hand, the reuse or recovery including recycling of the packaging and/or
packaging waste collected, in order to meet the objectives laid down in this
Directive, should be ensured. These systems shall be open to the participation of
the economic operators of the sectors concerned and to the participation of the
competent public authorities.
For waste management, a marking and identification system of waste
packaging is essential. Therefore, the Council shall decide no later than two years
after the entry into force of this Directive on the marking of packaging. To
facilitate collection, reuse, and recovery (including recycling), packaging shall
indicate for purposes of its identification and classification by the industry
concerned the nature of the packaging material(s) used. To that end, the Commis-
sion will specify the numbering and abbreviations on which the identification
system is based and shall specify which materials shall be subject to the
identification system in accordance with the same procedure. Packaging shall
bear the appropriate marking either on the packaging itself or on the label. It shall
be clearly visible and easily legible. The marking shall be appropriately durable
and lasting, even when the packaging is opened.
In addition, the Commission will promote, as appropriate, the preparation
of European standards relating to the essential requirements, in particular, the
preparation of European standards relating to:
Criteria and methodologies for life-cycle analysis of packaging
The methods for measuring and verifying the presence of heavy metals and
other dangerous substances in the packaging and their release into the
environment from packaging and packaging waste
Criteria for a minimum content of recycled material in packaging for
appropriate types of packaging
Criteria for recycling methods
Criteria for composting methods compost produced
Criteria for the marking of packaging
With this Directive it will be ensured that the sum of concentration levels
of lead, cadmium, mercury, and hexavalent chromium present in packaging or
packaging components shall not exceed the following:
Copyright 2002 by Marcel Dekker, Inc. All Rights Reserved.
600 ppm by weight in 1998
250 ppm by weight in 1999
100 ppm by weight in 2001
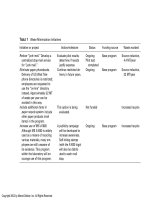
Regarding effective packaging management, European information system
should be introduced. Thus, Member States shall take the necessary measures to
ensure that databases on packaging and packaging waste are established, where
not already in place, on a harmonized basis in order to help Member States and
the Commission to monitor the implementation of the objectives set out in this
Directive. To this effect, the databases shall provide in particular information on
the magnitude, characteristics, and evolution of the packaging and packaging
waste flows (including information on the toxicity or danger of packaging
materials and components used for their manufacture) at the level of individual
Member States. In order to harmonize the characteristics and presentation of the
data produced and to make the data of the Member States compatible, Member
States shall provide the Commission with their available data in standard formats
which shall be adopted by the Commission. Member States shall require all
economic operators involved to provide competent authorities with reliable data
on their sector.
Regarding an information system for users of packaging, Member States
shall take measures to ensure that users of packaging, including in particular
consumers, obtain the necessary information about:
The return, collection, and recovery systems available to them
Their role in contributing to reuse, recovery, and recycling of packaging
and packaging waste
The meaning of markings on packaging existing on the market
In pursuance of the objectives and measures referred to in this Directive,
Member States shall include in the waste management plans a specific chapter on
the management of packaging and packaging waste. Acting on the basis of the
relevant provisions of the Treaty, the Council shall adopt economic instruments
to promote the implementation of the objectives set by this Directive. In the
absence of such measures, the Member States may, in accordance with the
principles governing Community environmental policy, inter alia, the polluter
pays principle, and the obligations arising out of the Treaty, adopt measures to
implement those objectives.
At least, this Directive specifies essential requirements on the composition
and the reusable and recoverable, including recyclable nature of packaging.
Packaging shall be so manufactured that the packaging volume and weight
be limited to the minimum adequate amount to maintain the necessary level of
safety, hygiene, and acceptance for the packed product and for the consumer.
Furthermore, they shall be designed, produced, and commercialized in such a
Copyright 2002 by Marcel Dekker, Inc. All Rights Reserved.
way as to permit reuse or recovery, including recycling, and to minimize im-
pact on the environment when packaging waste or residues from packaging
waste management operations are disposed of. The manufacturing has to avoid
the presence of noxious and other hazardous substances and materials as constit-
uents of the packaging material or of any of the packaging components or
minimized with regard to their presence in emissions, ash, or leachate when
packaging or residues from management operations or packaging waste are
incinerated or landfilled.
The physical properties and characteristics of the packaging shall enable a
number of trips or rotations in normally predictable conditions of use and offer
the possibility of processing the used packaging in order to meet health and safety
requirements for the workforce. At least, the properties should fulfil the require-
ments specific to recoverable packaging when the packaging is no longer reused
and thus becomes waste.
Furthermore, packaging must be manufactured in such a way as to enable
the recycling of a certain percentage by weight of the materials used in the
manufacture of marketable products, in compliance with current standards in
the Community. The establishment of this percentage may vary, depending on the
type of material of which the packaging is composed. Packaging waste processed
for the purpose of energy recovery shall have a minimum inferior calorific value
to allow optimization of energy recovery. Packaging waste processed for the
purpose of composting shall be of such a biodegradable nature that it should not
hinder the separate collection and the composting process or activity into which
it is introduced, whereas biodegradable packaging waste shall be of such a nature
that it is capable of undergoing physical, chemical, thermal, or biological decom-
position such that most of the finished compost ultimately decomposes into
carbon dioxide, biomass, and water.
2.2 Council Directive on Landfill of Waste
The aim of the Directive on landfill of waste is, by way of stringent operational
and technical requirements on the waste and landfills, to provide for measures,
procedures, and guidance to prevent or reduce as far as possible negative effects
on the environment, in particular the pollution of surface water, groundwater, soil,
and air, and on the global environment, including the greenhouse effect, as well
as any resulting risk to human health, from landfilling of waste, during the whole
life cycle of the landfill.
In principle, each landfill shall be classified in one of the following classes:
Landfill for hazardous waste
Landfill for nonhazardous waste
Landfill for inert waste
Copyright 2002 by Marcel Dekker, Inc. All Rights Reserved.
Member States shall set up a national strategy for the implementation of
the reduction of biodegradable waste going to landfills. This strategy should
include measures to achieve the following targets by means of, in particular,
recycling, composting, biogas production, or materials/energy recovery. It ensures
that long-term biodegradable municipal waste going to landfills must be reduced
to 35% of the total amount (by weight) of biodegradable municipal waste
produced in 1995. Furthermore, the Directive shall take measures in order that
liquid waste, waste which, in the conditions of landfill, is explosive, corrosive,
oxidizing, highly flammable, or flammable, as well as hospital and other clini-
cal wastes arising from medical or veterinary establishments, are not accepted in
a landfill.
The landfill permit shall state at least the class of the landfill and the list of
defined types and the total quantity of waste which are authorized to be deposited
in the landfill.
Member States shall take measures to ensure that all of the costs involved
in the setting up and operation of a landfill site, including as far as possible the
cost of the financial security and the estimated costs of the closure and after-care
of the site for a period of at least 30 years shall be covered by the price to be
charged by the operator for the disposal of any type of waste in that site.
Regarding existing landfill sites, it should be ensured that landfills which have
been granted a permit may not continue to operate unless the landfill sites will
fulfil the standard of state of the art landfill sites within eight years.
The directive sets up general requirements for all classes of landfills. The
landfill can be authorized only if the characteristics of the site indicate that the
landfill does not pose a serious environmental risk.
The location of a landfill must take into consideration the existence of
groundwater, coastal water, or nature protection zones in the area, the geological
and hydrogeological conditions in the area, as well as the risk of flooding,
subsidence, landslides, or avalanches on the site. Therefore the water control and
leachate management must control water from precipitations entering into the
landfill body, prevent surface water and/or groundwater from entering into the
landfilled waste, and collect contaminated water and leachate.
Where the geological barrier does not naturally meet the conditions of
permeability and thickness, it has to be completed artificially and reinforced by
other means giving equivalent protection. An artificially established geological
barrier should be no less than 0.5 m thick.
Recommended parameters for a check study are ph, TOC, phenols, heavy
metals, fluoride, AS, and oil/hydrocarbons. In order to reduce global warming,
the methane-containing landfill gas shall be collected from all landfills receiving
biodegradable waste and the landfill gas must be treated and used. If the gas
collected cannot be used to produce energy, it must be flared.
Copyright 2002 by Marcel Dekker, Inc. All Rights Reserved.
2.3 European Parliament and Council Directive on
Incineration of Waste
Having regard to the Treaty establishing the European Community and a proposal
of the Commission, the Council of the European Union and the European
Parliament adopted a new directive on the incineration of waste in July 1999.
In accordance with the principle of subsidiary, it was considered that the
objective of reducing emissions from incineration and co-incineration plants
cannot be achieved effectively by Member States acting individually. Un-
concerted action offers no guarantee of achieving the desired objective, and
regarding the need to reduce emissions across the Community, it is more effective
to take action at the level of the Community. This Directive confines itself to
minimum requirements for incineration and co-incineration plants.
The Directive is a consequence of the fifth Environment Action Program:
Towards Sustainability—a European Community program of policy and action in
relation to the environment and sustainable development which sets as an
objective “no exceedance ever of critical loads and levels” of certain pollutants
such as nitrogen oxides (NO
x
), sulfur dioxide (SO
2
), heavy metals, and dioxins,
while in terms of air quality the objective is that “all people should be effectively
protected against recognized health risks from air pollution.” That program
further sets as an objective a “90% reduction of dioxin emissions of identified
sources by 2005 (1985 level)” and “at least 70% reduction from all pathways of
cadmium (Cd), mercury (Hg), and lead (Pb) emissions in 1995.”
The purpose of the incineration plants established and operated in accor-
dance with this Directive is to reduce the pollution-related risks of waste through
a process of thermal treatment, especially oxidation, to reduce the quantity and
volume of the waste and to produce residues that can be recycled or disposed of
safely. The co-incineration of waste in plants not primarily intended to incinerate
waste should not be allowed to cause higher emissions of polluting substances in
that part of the exhaust gas volume resulting from such co-incineration and should
therefore be subject to appropriate limitations.
The aim of this Directive is to prevent or, where that is not practicable, to
reduce as far as possible negative effects on the environment, in particular the
pollution of air, soil, surface water, and groundwater, and the resulting risks to
human health, from the incineration and co-incineration of waste and, to that end,
to set up and maintain appropriate operating conditions and emission limit values
for waste incineration and co-incineration plants within the Community.
Incineration plants shall be operated in order to achieve a level of inciner-
ation such that the total organic carbon (TOC) of the slag and bottom ashes is less
than 3% or their loss upon ignition is less than 5% of the dry weight of the
material. If necessary, appropriate techniques of waste pretreatment shall be used.
All incineration plants shall be designed, equipped, built, and operated in such a
Copyright 2002 by Marcel Dekker, Inc. All Rights Reserved.
way that the gas resulting from the process is raised, after the last injection of
combustion air, in a controlled and homogeneous fashion and even under the most
unfavorable conditions, to a temperature of at least 850˚C, as measured near the
inner wall of the combustion chamber, for at least 2 s. If hazardous wastes with
a content of more than 1% of halogenated organic substances, expressed as
chlorine, are incinerated, the temperature has to be raised to at least 1100˚C.
Any heat generated by the incineration or co-incineration process shall be
recovered as far as possible.
The directive determines following air emission limit values.
2.3.1 Air Emission Limit Values
Daily average values:
Total dust 10 mg/m
3
Gaseous and vaporous organic substances, expressed as
total organic carbon
10 mg/m
3
Hydrogen chloride (HCl) 10 mg/m
3
Hydrogen fluoride (HF) 1 mg/m
3
Sulfur dioxide (SO
2
) 50 mg/m
3
Nitrogen monoxide (NO) and nitrogen dioxide (NO
2
),
expressed as nitrogen dioxide for existing incineration
plants with a capacity exceeding 3 tonnes per hour or
new incineration plants
200 mg/m
3
Nitrogen monoxide (NO) and nitrogen dioxide (NO
2
),
expressed as nitrogen dioxide for existing incineration
plants with a capacity of 3 tonnes per hour or less
400 mg/m
3
Until 1 January 2007, the emission limit value for NO
x
does not apply to plants
incinerating hazardous waste only.
Half-hourly average values:
Total dust 30 mg/m
3
Gaseous and vaporous organic substances, expressed as
total or organic carbon
20 mg/m
3
Hydrogen chloride (HCl) 60 mg/m
3
Hydrogen fluoride (HF) 4 mg/m
3
Sulfur dioxide (SO
2
) 200 mg/m
3
Nitrogen monoxide (NO) and nitrogen dioxide (NO
2
),
expressed as nitrogen dioxide for existing incineration
plants with a capacity exceeding 3 tonnes per hour or
new incineration plants
400 mg/m
3
Copyright 2002 by Marcel Dekker, Inc. All Rights Reserved.
Until 1 January 2007, the emission limit value for NO
x
does not apply to plants
incinerating hazardous waste only.
All average values over the sample period of a minimum of 30 mins and a
maximum of 8 h.
Cadmium and its compounds, expressed
as cadmium (Cd)
Total Total
Thallium and its compounds, expressed as
thallium (Tl)
0.05 mg/m
3
0.1 mg/m
3
Mercury and its compounds, expressed as
mercury (Hg)
0.05 mg/m
3
0.1 mg/m
3
Antimony and its compounds, expressed
as antimony (Sb)
Arsenic and its compounds, expressed as
arsenic (As)
Lead and its compounds, expressed as
lead (Pb)
Chromium and its compounds, expressed
as chromium (Cr)
Total Total
Cobalt and its compounds, expressed as
cobalt (Co)
0.5 mg/m
3
1 mg/m
3
Copper and its compounds, expressed as
copper (Cu)
Manganese and its compounds, expressed
as manganese (Mn)
Nickel and its compounds, expressed as
nickel (Ni)
Vanadium and its compounds, expressed
as vanadium (V)
These average values also cover gaseous and the vapor forms of the relevant
heavy-metal emissions as well as their compounds. Until 1 January 2007 these
average values shall apply to existing plants for which the permit to operate
has been granted before 31 December 1996, and which incinerate hazardous
waste only.
Average values shall be measured over a sample period of a minimum of 6
h and a maximum of 8 h. The emission limit value refers to the total concentration
of dioxins and furans calculated using the concept of toxic equivalence in
accordance with Annex I:
Dioxins and furans 0.1 ng/m
3
Copyright 2002 by Marcel Dekker, Inc. All Rights Reserved.
The following emission limit values of carbon monoxide (CO) concentra-
tions shall not be exceeded in the combustion gases (excluding the start-up and
shut-down phases):
50 mg/m
3
of combustion gas determined as daily average value
150 mg/m
3
of combustion gas of at least 95% of all measurements deter-
mined as 10-min average values or 100 mg/m
3
of combustion gas of all
measurements determined as half-hourly average values taken in any
24-h period.
Exemptions may be authorized by the competent authority for incineration
plants using fluidized bed technology, provided that the authorization foresees an
emission limit value for carbon monoxide (CO) of not more than 100 mg/m
3
as
a hourly average value.
2.3.2 Determination of Emission Limit Values for the
Co-incineration of Waste
The limit value for each relevant pollutant and carbon monoxide in the exhaust
gas resulting from the co-incineration of waste shall be calculated as follows:
V
waste
⋅ C
waste
+ V
proc
⋅ C
proc
V
waste
+ V
proc
= C
where
V
waste
is exhaust gas volume resulting from the incineration of waste only,
determined from the waste with the lowest calorific value specified in
the permit and standardized at the conditions given by this Directive.
C
waste
is emission limit value set in Annex V for plants intended to
incinerate wastes only (at least the emission limit values for the pollu-
tants and carbon monoxide).
V
proc
is exhaust gas volume resulting from the plant process, including the
combustion of the authorized fuels normally used in the plant (wastes
excluded), determined on the basis of oxygen contents at which the
emissions must be standardized as laid down in Community or national
regulations. In the absence of regulations for this kind of plant, the real
oxygen content in the exhaust gas without being thinned by addition of
air unnecessary for the process must be used. The standardization at the
other conditions is given in this Directive.
C
proc
is emission limit value as laid down in the tables of this Annex for
certain industrial sectors or in case of the absence of such a table or such
value, emission limit values of the relevant pollutants and carbon mon-
oxide in the flue gas of plants which comply with the national laws,
regulations, and administrative provisions for such plants while burning
Copyright 2002 by Marcel Dekker, Inc. All Rights Reserved.
the normally authorized fuels (wastes excluded). In the absence of these
measures the emission limit values laid down in the permit are used. In
the absence of such permit values the real mass concentrations are used.
C is total emission limit value as laid down in the tables of this Annex for
certain industrial sectors and certain pollutants or in case of the absence
of such a table or such values total emission limit values for CO and the
relevant pollutants replacing the emission limit values as laid down in
specific Articles of this Directive. The total oxygen content to replace the
oxygen content for the standardization is calculated an the basis of the
content above respecting the partial volumes.
2.3.3 Special Provisions for Large Combustion Plants
C
proc
for solid fuels expressed in mg/Nm
3
(O
2
content 6%):
Pollutant 50–100 MWth 100–300 MWth >300 MWth
SO
2
General case 850 850–200 (linear
decrease
from 100 to
300 MWth)
200
Indigenous fuels or rate of
desulfurization
or rate of
desulfurization
≥ 90% or rate of
desulfurization
≥ 92%
≥ 95%
NO
x
400 300 200
Dust 50 30 30
Until 1 January 2007 and without prejudice to other Community legislation, the
emission limit value for NO
x
does not apply to plants co-incinerating hazardous
waste only.
C
proc
for biomass expressed in mg/Nm
3
(O
2
content 6%):
Pollutant 50–100 MWth 100–300 MWth >300 MWth
SO
2
200 200 200
NO
x
350 300 300
Dust 50 30 30
Copyright 2002 by Marcel Dekker, Inc. All Rights Reserved.
Until 1 January 2007 and without prejudice to other Community legislation, the
emission limit value for NO
x
does not apply to plants co-incinerating hazardous
waste only.
C
proc
for liquid fuels expressed in mg/Nm
3
(O
2
content 3%):
Pollutant 50–100 MWth 100–300 MWth >300 MWth
SO
2
850 850 to 200 (linear
decrease from 100 to
300 MWth)
200
NO
x
400 300 200
Dust 50 30 30
Until 1 January 2007 and without prejudice to other Community legislation, the
emission limit value for NO
x
does not apply to plants co-incinerating hazardous
waste only.
2.3.4 C: Total Emission Limit Values
C expressed in mg/Nm
3
(O
2
content 6%). All average values over the sample
period of a minimum of 30 min and a maximum of 8 h:
Pollutant C
Cd + Tl 0.05
Hg 0.05
Sb + As + Pb + Cr + Co + Cu + Mn + Ni + V 0.5
C expressed in ng/Nm
3
(O
2
content 6%). All average values measured over the
sample period of a minimum of 6 h and a maximum of 8 h:
Pollutant C
Dioxins and furans 0.1
C for solid fuels expressed in mg/Nm
3
(O
2
content 6%); C for biomass (as
defined in Council Directive 88/609/EEC as amended) expressed in mg/Nm
3
(O
2
content 6%); C for liquid fuels expressed in mg/Nm
3
(O
2
content 3%):
Copyright 2002 by Marcel Dekker, Inc. All Rights Reserved.
Pollutant C
HCl 10
HF 1
3 CONCLUSION
The Council of Europe and the European Parliament legislate the general frame-
work of environment. The European Treaty binds the Member States to put
Community laws into national legislation. Regarding the precision of the guide-
lines, the elaboration of the directives will differ more or less in each Member
State. Furthermore, different time scales may exist to take into account the
different standards of environmental legislation in the Member States as well as
their specific situations. Nevertheless, the Community legislation will be harmo-
nized in the future, and separate treatment more and more abolished. Although
the principle of subsidiary guarantees the diversity of the European Union, a
common EU legislative gains more importance determined by the tempo of the
European integration.
Current European environmental legislation has already reached a very high
standard in environmental protection. Potential new member states for the Euro-
pean Union will be constrained to adopt stronger environmental legislation.
REFERENCES
Further information is available at />Copyright 2002 by Marcel Dekker, Inc. All Rights Reserved.
7
Energy Conservation
K. A. Strevett, C. Evenson, and L. Wolf
University of Oklahoma, Norman, Oklahoma
1 INTRODUCTION
A large proportion of our current pollution problems is the result of energy
technologies that rely on combustion of carbon-based fuels. Included in these
problems are emissions of greenhouse gases, acid rain precursors (oxides of sulfur
and nitrogen), and carbon monoxide; formation of photochemical oxidants;
releases to the biosphere of raw and refined petroleum products; and mining-
related pollution. Obviously, then, decreasing our consumption of carbon-based
energy will result in decreases in the amounts of these pollutants entering the
biosphere.
Global warming poses the threat of an environmental impact that is global
and, at least on a time scale of centuries, irreversible. Over the very long term of
two to three centuries, temperatures could rise by as much as 10 to 18˚C. While
it is impossible at this point to predict accurately all the effects of global warming,
its consequences are potentially so threatening to human and ecosystem health
that humans have an ethical obligation to do something about it (1).
It is obvious that strategies for reducing consumption of energy derived
from combustion of carbon-based fuels are among the most important means of
preventing global pollution. After a look at energy demands, this chapter dis-
cusses several such energy conservation strategies, the fuels currently being used
Copyright 2002 by Marcel Dekker, Inc. All Rights Reserved.
to supply these demands, and a survey of the environmental impacts of some of
the pollutants produced by these fuels.
2 ENERGY SUPPLIES AND DEMANDS
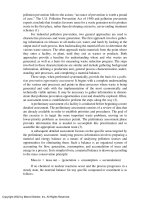
Coal, oil, and natural gas supply about 95% of global energy. Coal dominates
energy markets, accounting for about 44% of fossil energy consumption. Oil
accounts for about 32% of fossil fuel supply, while natural gas contributes 24%
(Figure 1).
Coal is the most abundant fossil fuel worldwide, with current reserves
expected to last more than 200 years. “Conventional” oil production is expected
to peak between 2010 and 2020, resulting in a switch to “unconventional”*
sources and a possible increase in price (2). The total ultimately recoverable
natural gas resources in the world are estimated to amount to about 80% as much
energy as the recoverable reserves of crude oil. At current usage rates, gas
reserves represent approximately a 60-year supply (3).
Although developed countries account for less than 20% of the world’s
population, these countries use more than two-thirds of the commercial energy
supply, consuming 78% of the natural gas, 65% of the oil, and about 50% of
the coal produced each year (Figure 2). The United States and Canada, for
example, account for only about 5% of the world’s population, but consume
about one-quarter of the available energy (3). Carlsmith et al. (1990, as cited in
Ref. 4) estimated that 36% of U.S. energy consumption is in commercial and
residential buildings; industry accounts for another 36% and transportation for the
remaining 28%.
*Oil is considered unconventional if it is not produced from underground hydrocarbon reservoirs by
means of production wells, and/or it requires additional processing to produce synthetic crude. It
includes such sources as oil shales, oil sands-based synthetic crudes and derivative products, and liquid
supplies derived from coal, biomass, or gas (2).
Coal
44%
Natural
Gas
24%
Oil
32%
FIGURE 1 Percent contribution of coal, oil, and natural gas to global energy
markets.
Copyright 2002 by Marcel Dekker, Inc. All Rights Reserved.
In November 1998, the World Energy Outlook (2) predicted 65% growth
in world energy demand and 70% growth in CO
2
emissions between 1995 and
2020, without policy changes. The Outlook estimates that fossil fuels will meet
95% of additional global energy between 1995 and 2020 and that two-thirds of
the increase in energy demand and energy-related CO
2
emissions over this period
could occur in China and other developing countries. The market share of gas is
expected to increase, while that of oil will decline slightly and the share of coal
will remain stable. By 2020, global electricity generation is predicted to have
increased by nearly 88% over 1995 rates. While electricity generation from
energy sources other than carbon-based fuels and hydropower is growing fast, it
is expected to represent less than 1% of world electricity generation by 2020
without policy changes.
3 NONRENEWABLE ENERGY SOURCES
3.1 Coal
Coal is fossilized plant material preserved by burial in sediments and altered by
geological forces that compact and condense it into a carbon-rich fuel. Its
advantage lies in its abundance of supply. The environmental effects of burning
all the remaining coal, however, could be catastrophic. Coal is the worst offender
among fossil fuels in terms of CO
2
per unit of energy generated. The supply of
coal is enough to permit atmospheric carbon buildup of severalfold (4). In
addition, the burning of coal is a primary source of acid rain precursors. Pollution
associated with the mining of coal is discussed later.
Industrialized countries generate between 20% and 30% of their energy
from coal; in the case of China, the figure is nearly 75% (5). In the United States,
the relative contribution of coal declined from a peak of about 75% of total energy
Developed Underdeveloped
Coal
50%
50%
Oil
65%
35%
Natural Gas
78%
22%
FIGURE 2 Comparison of coal, oil, and natural gas consumption in developed
and less developed countries.
Copyright 2002 by Marcel Dekker, Inc. All Rights Reserved.
supply in 1910 to about 17% in 1973 and increased again to about 23% in 1989.
In 1989, about 86% of domestic coal consumption was accounted for in electric
power production (6).
3.2 Petroleum
Petroleum, like coal, is derived from organic molecules created by living organ-
isms millions of years ago and buried in sediments where high pressures and
temperatures concentrated and transformed them into energy-rich compounds.
Petroleum has represented a relatively inexpensive source of fuel for transporta-
tion and provides the chemical industry with feedstocks, e.g., for the production
of plastics. However, its use results in emissions of carbon dioxide, carbon
monoxide, and acid rain precursors, and in the formation of photochemical
oxidants. In addition, aquatic and terrestrial systems may become polluted by
unintentional releases of raw and refined petroleum.
3.3 Natural Gas
Natural gas is a combustible mixture of methane (CH
4
) and other hydrocarbons
formed during the anaerobic decomposition of organic matter. It is the least
polluting of the fossil fuels, releasing only a little more than half as much CO
2
as
coal. Important disadvantages of natural gas are its limited supply, difficulty of
storage in large quantities, and difficulty of transport across oceans. It can be
transported across land via pipelines; however, leaks of methane from these pipelines
represent a significant contribution to global warming. Furthermore, such pipeline
networks are prohibitively expensive for developing countries. As a result, much of
the natural gas produced in conjunction with oil pumping is simply burned (flared
off), representing a terrible waste of a valuable resource (3).
4 SOURCES AND ENVIRONMENTAL IMPACTS
OF POLLUTANTS
The production and/or consumption of carbon-derived energy result in release to
the biosphere of a variety of pollutants. These include gaseous pollutants [carbon
dioxide, acid rain precursors (nitrogen oxides and sulfur dioxide), and carbon
monoxide], photochemical oxidants, unintentional releases of raw and refined
petroleum, mining-related pollution (i.e., acid mine drainage), methane, and
thermal pollution.
4.1 Gaseous Pollutants
4.1.1 Carbon Dioxide
Carbon dioxide is responsible for 55% of global warming. The two primary
anthropogenic sources of atmospheric CO
2
are fossil fuel burning (~77%) and
Copyright 2002 by Marcel Dekker, Inc. All Rights Reserved.
deforestation (~23%). Cline (4) has estimated that if human sources of atmo-
spheric carbon were immediately reduced by about 43%, warming could be held
to about 2.5˚C.
Atmospheric CO
2
concentration was more or less stable near 280 ppm for
thousands of years until about 1850, and has increased significantly since then
(Figure 3) (Schimel et al., 1995, as cited in Ref. 7). Since the beginning of the
industrial era, about 40% of all CO
2
released through the burning of fossil fuel
has been absorbed by sinks; the remainder has remained in the atmosphere (1).
The human-caused increase in atmospheric CO
2
already represents nearly a 30%
change relative to the preindustrial era (7); annual global emissions of CO
2
have
increased 10 times this century (8). At the current rate of increase in concentra-
tions of CO
2
and other heat-trapping gases in the atmosphere, greenhouse gas
concentrations will be equivalent to double the preindustrial CO
2
concentration
by 2050 (National Academy of Sciences, 1992, as cited in Ref. 1). Ultimately,
this could increase the average global temperature by about 1–5˚C, with a likely
figure of 2.5˚C. According to Cline (4), we are already committed to about 1.7˚C
of warming from the existing accumulation of greenhouse gases, and warming
could increase by 10˚C or more if nothing is done to alter likely fossil fuel
consumption patterns. The historic record suggests that the average global surface
temperature has already risen approximately 0.3–0.6˚C since the nineteenth
century (1).
Natural gas releases slightly less than half the amount of CO
2
released
during the combustion of coal, with petroleum in between. Coal and natural gas
each accounts for about 27% of U.S. fossil fuel supply, but coal accounts for about
275
300
325
350
375
1700 1750 1800 1850 1900 1950 2000
Atm. CO
2
Conc.
(ppm)
FIGURE 3 Historical increase in global CO
2
emissions. (Sources: Refs. 35–37.)
Copyright 2002 by Marcel Dekker, Inc. All Rights Reserved.
one-third of U.S. CO
2
emissions. In the United States, electric utilities account
for about one-third of all CO
2
releases, with transportation activities adding
approximately an additional third. Globally, oil consumption accounts for nearly
half of total CO
2
emissions and much of its air pollution (6).
4.1.2 Nitrogen Oxides
Nitrogen oxides (NO
x
) are responsible for about 35% of acid rain, and are a
precursor of O
3
pollution (Figure 4). Of all U.S. air pollutants, oxides of nitrogen
have been the most difficult to control. They are formed when ambient diatomic
nitrogen (N
2
) is heated to temperatures > 1200˚F, and their dominant sources are
the internal combustion engine and power plants (Figure 5) (1). The 900 million
tons of coal burned annually in the United States are responsible for about
one-third of all this country’s NO
x
emissions (3).
2NO + O
2
→ 2NO
2
2NO
2
+ H
2
O → HNO
2
+ HNO
3
There are various ways of reducing nitrogen oxide emissions including
combustion control and the use of catalysts (9). Our best option for reducing this
pollutant, however, is through reduced burning of fossil fuels and forests.
4.1.3 Sulfur Dioxide
Sulfur dioxide (SO
2
) is responsible for about 60% of acid rain (Figure 4). At least
two-thirds of the sulfur oxides in the United States are emitted from coal-fired
power plants. Much of the coal burned in the United States has a high sulfur
content—2% or more. Most of the remaining SO
2
emissions are accounted for by
industrial fuel combustion and industrial processes such as petroleum refining,
sulfuric acid manufacturing, and smelting of nonferrous metals (Figure 5) (10).
4.1.4 Carbon Monoxide
Carbon monoxide (CO) is the result of incomplete combustion. CO inhibits
respiration in animals by binding irreversibly to hemoglobin. About half the CO
released to the atmosphere each year is the result of human activities. In the
United States, two-thirds of the CO emissions are created by internal combustion
engines in transportation (3).
4.2 Photochemical Oxidants
Photochemical oxidants are products of secondary atmospheric reactions driven
by solar energy—e.g., splitting of an O
2
or NO
2
molecule, freeing an oxygen
atom which reacts with another O
2
to form ozone (O
3
). O
3
is the result of
atmospheric chemistry involving two precursors, nonmethane hydrocarbons
(HCs) and NO
x
, which react in the presence of heat and sunlight (Figure 6) (11).
Copyright 2002 by Marcel Dekker, Inc. All Rights Reserved.
SO
2
NO
x
Acid Rain
Atmospheric mixing
yields sulfuric and
nitric acids
Dry deposition of
acidic compounds
Vehicular emissions
Burning of fossil fuels
yields SO
2
and NO
x
FIGURE 4 NO
x
and SO
2
contributions to acid rain formation.
Copyright 2002 by Marcel Dekker, Inc. All Rights Reserved.
This ground-level O
3
is a pollutant that can have harmful effects on human health,
while O
3
present in the upper atmosphere protects the earth from harmful
ultraviolet radiation. Figure 6 demonstrates the dynamic interactions between
HCs and NO
x
, which are produced from combustion, and atmospheric oxygen.
In addition to forming O
3
, NO
x
can also remove ground-level O
3
. This removal
is often temporary, however, as O
3
is re-formed through other reactions.
Ground-level O
3
is a respiratory irritant that causes health concerns at very
low concentrations because its very low solubility in water means it tends not to
be removed by the mucous in the upper respiratory tract and penetrates deeper
into the lungs. There is evidence that exposure to O
3
accelerates the aging of lung
tissue and increases susceptibility to respiratory pathogens. Human exposure to
O
3
can produce shortness of breath and, over time, permanent lung damage (12).
Costs of the health effects of O
3
in the United States are estimated to be about
$50 billion per year. In addition, O
3
causes more damage to plants than any other
pollutant (1). O
3
concentrations rise with temperature and are therefore expected
to be exacerbated by global warming. If cloud cover decreases as a result of global
SO
2
Emissions
Other
Combustion
3%
Industrial
Combustion
12%
Ind/Mfg
Processes
13%
Transport.
4%
Utilities
68%
NO
x
Emissions
Ind/Mfg
Processes
5%
Other
1%
Other
Combustion
4%
Transport.
42%
Industrial
Combustion
16%
Utilities
32%
FIGURE 5 Percent contribution to SO
2
and NO
x
emissions in the United
States of various industries. (Source: Ref. 34.)
Copyright 2002 by Marcel Dekker, Inc. All Rights Reserved.
warming, thus permitting increased penetration of sunlight, O
3
concentrations
will be further increased.
4.3 Raw and Refined Petroleum Spills and Leaks
Crude oil spills such as that of the Exxon Valdez are probably the most widely
known examples of this type of energy-related pollution. In addition, it has been
estimated that about 11 million gallons of gasoline are lost each year by leaking
underground storage tanks (3).
4.4 Mining-Related Pollution
Acid mine drainage is one of the most common and damaging problems in the
aquatic environment. Many waters flowing from coal mines and draining from
the waste piles that result from coal processing and washing have low microbial
H
OH
H
2
O
O
2
O
2
HO
NO
O
NO
2
hv
λ=0.39µ
m
O
2
OO
3
O
2
O
2
H
O
3
O
O
2
hv
λ=0.39µ
m
NO
2
NO
OH
FIGURE 6 The release of hydrocarbons and NO during combustion results in
the conversion of NO to NO
2
. Increased formation of NO
2
increases the
production of O
3
.
Copyright 2002 by Marcel Dekker, Inc. All Rights Reserved.
densities due to the highly acidic nature of these waters. Acidic mine water results
from the presence of sulfuric acid produced in a series of microbially mediated
reactions that begin with the oxidation of pyrite, FeS
2
(13). Often, mining
operations result in surface waters infiltrating into the subsurface voids, especially
after the mine is exhausted and pumping ceases. In some areas of Appalachia,
large underground impoundments of water have filtered into coal mines. These
waters have become very acidic and, when they are returned to the surface via
pumping or by subsurface flows, their low pH value devastates the aquatic
systems they infiltrate (14).
Another impact of underground mining is the waste materials that are a
by-product of any mining operation. Gaining access to the vein or seam of coal,
as well as transporting the coal to the surface, requires large amounts of waste
materials to be removed to the surface. These waste materials, or tailings, are
often piled up in large mounds in close proximity to the mine. The composition
of many tailings can contain toxic minerals such as mercury, lead, or iron sulfide.
Water percolating through these waste materials often produces water quality
problems downstream from the tailings similar to those associated with subsur-
face water flows from within the mines. In addition to the sterile conditions on
tailings mounds themselves, rain water running off the tailings often is so acidic
as to kill both the vegetation in the immediately affected lands and the aquatic
life in streams and rivers receiving these waters. Many lands and streams within
the Appalachian coalfield areas of western Pennsylvania, West Virginia, eastern
Kentucky, and eastern Ohio are devastated by the acidic waters resulting from
coal mining operations. The enactment of environmental legislation limits the
damage associated with active mining operations, but the land degradation
associated with past mining has left a filthy legacy of degraded landscapes (14).
Surface mining is usually favored over underground mining for primarily
economic reasons. It is virtually impossible to prevent land degradation when
surface mining occurs. First, in some operations, huge depressions result. Second,
the overburden (extracted soil, subsoil, and unconsolidated earth and rocks) must
be stored and then replaced systematically in their original order after the mineral
is removed. Even under optimal conditions, which rarely occur, restoration
usually results in a landscape that is less productive than it was prior to mining.
Subsurface groundwater flow is always disturbed, and revegetation is often slow.
Restoration is further complicated when toxic materials are leached from the
overburden during its storage. These conditions often occur in coal mining
operations, which have disturbed about 2.3 million acres in the United States (14).
The area affected by mining can be three to five times more widespread
than the area actually exploited (15). Even when increased acidity is not consid-
ered, mining-related soil erosion alone can impact natural waters significantly.
Added nutrients may increase aquatic productivity, resulting in eutrophication.
Lower levels of dissolved oxygen associated with eutrophication may render the
Copyright 2002 by Marcel Dekker, Inc. All Rights Reserved.
water uninhabitable by other aquatic organisms. On the other hand, suspended
sediments may reduce light penetration, reducing productivity and therefore
available fish food. Sediments may also interfere with salmon and trout spawning
and reduce survival of their eggs. Young fish may be more susceptible to
predation when sediments fill or cover hiding places (14). Species that stalk their
prey visually may be unable to survive in murky water.
4.5 Methane
Methane is responsible for about 20% of the greenhouse effect, and concentra-
tions have already risen to more than double preindustrial estimations. Con-
centrations continue to rise at about 0.9% annually (4). The majority of
anthropogenic methane is the result of non-energy-related human activities such
as ruminant livestock and cultivation of rice (from which about half the world’s
population derive about 70% of their calories), and decomposition of organic
matter in landfills. However, leaks in natural gas pipelines contribute about 21%
of anthropogenic methane, and the burning of coal adds an additional 6%. Other
energy-related sources of methane include coal mines, natural gas leaks, gas
associated with oil production, and the creation of new wetlands when forests are
flooded following construction of hydroelectric dams.
4.6 Thermal Pollution
When coal is burned to generate electricity at a power plant, some of the coal’s
energy content is lost to coolant water, which is then discharged into rivers or
lakes. Since an inverse relationship exists between water’s temperature and
its oxygen-holding capacity, the water’s dissolved oxygen concentration can
be diminished to a point below which some aquatic organisms may be able
to survive.
5 POLLUTION PREVENTION THROUGH DECREASED
FOSSIL FUEL CONSUMPTION
Carbon dioxide can be considered an inevitable product of fossil fuel combustion;
therefore, CO
2
emissions can be reduced only through reduced consumption of
fossil fuels. It is important to note that emissions of every other pollutant
discussed in Section 4 will be reduced as an additional benefit of reducing fossil
fuel consumption and thereby CO
2
emissions.
5.1 Imposition of a Tax on Traditional Energy Sources
Internal costs are the expenses, monetary or otherwise, that are borne by those
who actually use a resource. External costs are the expenses, monetary or
Copyright 2002 by Marcel Dekker, Inc. All Rights Reserved.
otherwise, borne by someone other than the individuals or groups who use a
resource (3). As an example, according to Tenenbaum (27), a 1990 study at Pace
University concluded that the true cost of an unscrubbed coal plant was 11.6 cents
per kilowatt hour (kWh), double the 5.8 cents that utilities were charging.
Cline (4) has produced an extensive analysis of the economic effects of
global warming. One strategy for reducing dependence on fossil energy sources
is the imposition on these sources of a tax large enough to “internalize” the costs
associated with fossil fuels, such as sea-level rise (estimated by Cline to amount
to about $7 billion annually in the United States*), agricultural losses ($18
billion), curtailed water supply due to reduced runoff ($7 billion), forest loss (>$3
billion, considering only lumber value), increased electricity demand for addi-
tional cooling ($11 billion), exacerbation of urban O
3
problems ($4 billion),
increased mortality from heat waves ($6 billion, valued at lifetime earning
potential), losses of leisure activities associated with winter sports (ski industry
$1.5 billion), increased hurricane ($750 million) and forest fire damage, and
species loss. Cline estimates total damage from CO
2
-equivalent doubling the
amount to about $61 billion,
†
or about 1.1% of the Gross Domestic Product
(GDP). Intangible losses such as species loss and decline in human quality of life
could raise the total to about 2% of GDP. If CO
2
doubling results in a temperature
increase of 4.5˚C rather than 2.5˚C, the corresponding damage could be as high
as 4% of GDP, with even greater losses in some other countries such as low-lying
island nations.
Some of the revenue derived from the tax could be channeled toward
improvements in public transportation, development and/or subsidization of more
environmentally benign energy sources, and research directed toward efficiency
improvements. Cline (4) suggests that some of the revenue be channeled to de-
veloping countries “to secure their participation in international abatement. . . .
The importance of including developing countries in international measures for
restraining and reducing emissions, and the political and equity considerations
that seriously limit the amount of growth these countries can be expected to
sacrifice to help avoid global warming, strongly point to the need to channel some
of the revenue from a carbon tax from industrial countries to assist developing
countries that are prepared to take measures to reduce deforestation and configure
future energy development along lines that minimize carbon emissions.”
*Figures are in 1990 dollars and are based on a doubling of CO
2
-equivalent resulting in an
approximate temperature increase of 2.5˚C; concentrations of more than double preindustrial levels
obviously would result in even higher costs.
†In contrast, Tenenbaum (27) cites a 1991 report that says the external costs of energy currently range
from $100 billion to $300 billion in the United States.
Copyright 2002 by Marcel Dekker, Inc. All Rights Reserved.