Waste Water Evaluation and Management Part 10 ppt
Bạn đang xem bản rút gọn của tài liệu. Xem và tải ngay bản đầy đủ của tài liệu tại đây (1.36 MB, 30 trang )
Effects of Wastewater Treatment Plant on
Water Column and Sediment Quality in Izmir Bay (Eastearn Aegean Sea)
259
All variables were described as four major components at ST 3 which explained for 61.2% of
total variance. 25.2 % of total variance is generally explained by temperature, phosphate,
oxygen and phaeopigment Nitrate is seen to be responsible for 14.9 % of it whereas its 11.8%
is basically governed by salinity, chlorophyll a and nitrite. On the other hand 9.3 % of total
variation is mostly controlled by silicate and ammonium (Table 5).
ST 3
Component Component Component Component
1 2 3 4
Phaopigment
0,309441
-0,115255 -0,118439 0,00891844
Temperature
0,478778
0,368824 -0,00879898 0,140916
Salinity -0,024596 0,365174
-0,519479
0,253368
pH
0,33159
0,186109 0,321044 -0,0842017
PO
4
0,437231
-0,22811 0,0675536 0,134745
NO
3
0,200952
-0,554785
-0,129602 0,162289
NO
2
0,0991039 -0,401237
-0,46215
0,29997
NH
4
0,285814 -0,197389 0,0871168
-0,468515
SiO
4
0,244234 -0,0379852 -0,22798
-0,566497
DO
-0,383154
-0,345061 0,258506 -0,0662661
Chl -a 0,186924 -0,0491215
0,501633
0,479047
Table 5. Component Weights of ST 3
Table 6 shows minimum and maximum values of nutrients and Chl a in some previous
studies which were carried out in the different parts of the Izmir bay. Izmir Wastewater
Treatment Plant Construction was completed in the 2002. It works on the principle of
nitrogen and phosphorus treatment technology with activated sludge. Previous studies
indicated that the concentration of TNO
x
-N has been reduced during after wastewater
activated sludge technology plant except sudden discharge, while reactive phosphate
concentrations were increased in the Bay. In the Middle and Inner Parts of the Bay
Chlorophyll a concentration has been gradually reduced after treatment.
In conclusion, we are of the opinion that it would be of great use to develop and plan further
similar studies periodically and for the long run considering that they could shed light on
precautions to be taken in terms of both environmental and public health.
The changes in the state variables of ecological model for İzmir Bay before and after the
sewage treatment has been given by Büyükışık et al., 1997 (Fig.2 and 3). They reported that
average light intensities in water column would be recovered in a year if the treatment plant
begins to work. Indeed, after one year from starting of sewage treatment (2003), the
observation in recovery of the average light intensities in water column consistent with the
model outputs in case of treatment.
But some changes in temporal variations of phytoplankton biomass has been observed
(Fig.4). Some exceptional blooms has taken place in mid-winter, early summer and autumn.
Model does not includes the kinetic parameters of Ditylum brightwellii (in winter) and
Rhizosolenia setigera (in summer).
These two species are relatively large sized phytoplankton and they contributed greatly to
the total phytoplankton carbon and POC values.
Specially some members of genus Rhizosolenia can change their cellular density, sink
deeper, uptake and storage the nutrients and go on their growth.
Waste Water - Evaluation and Management
260
O
N
d
o
i
r
e
P
s
n
o
i
t
a
c
o
L
3
(μM) NO
2
(μM) NH
4
(μM) Si(μM) RP(μM) Chl a(μg l
-1
) Reference
Inner part of Izmir Bay
1993-1994
BDL-3,04
*
BDL-4,65
*
0,12-468
*
- 0,36-49 BDL-189 Bizsel, Uslu,2000
Middle part of Izmir Bay 1993-1994 BDL-3,49 BDL-3,57 BDL-44 - 0,06-3,79 0,5-62 Bizsel, Uslu,2000
Outer part of Izmir Bay 1993-1994 BDL-4,91 BDL-0,16
BDL-11,11 - BDL-6,42 BDL-2,95 Bizsel, Uslu,2000
Inner part of Izmir Bay 1993-1994 BDL -3,11 BDL -4,65 BDL -468 - 0,18-49 BDL -189
***
Bizsel, Uslu,2000
Candarl
ş
Bay (Aegean Sea) 1994-1995 0,001-0,31 BDL-0,1 0,42-2,
38 27,74-63,19 BDL-0,48 BDL-1,13 Aksu et.al. 2010
Middle-Inner part of Izmir Bay 1996-1998 0,13-27 0,
01-18 0,10-21 0,50-39 0,01-10 0,10-26 Kucuksezgin,
et. al. 2006
Middle-Inner part of Izmir Bay 2000 0,15-18 0,02-12 0,13-34 0,43-20 0,13-3,8
0,46-18 Kucuksezgin, et. al.
2006
Middle-Inner part of Izmir Bay 2001 0,29-16 0,02-4,3 0,11-50 1,2-18 0,14-2,9 0,38-7,8 Kucuksezgin, et. al.
2006
Middle-Inner part of Izmir Bay 2002 0,26-6,7 0,01-
6,1 0,10-6,7 1,0-26 0,14-4,4 0,13-3,7 Colak-Sabancş, Koray, 2001
Gerence Bay (Aegean Sea) 2002 0,04-2,19 BDL-2,51 BDL-3,53 - BDL-2,82 BDL-0,320 Aydşn Gençay, Büyükşşşk, 2006
Middle-Inner part of Izmir Bay 2003 0,12-8,6 0,01-
1,0 0,12-2,4 2,6-32 0,32-4,5 0,24-2,6 Colak-Sabancş, Koray, 2001
Inner part of Izmir Bay 2007-2008 1,54-11,77 0,00-3,51 0,23-22,28 1,99-41,94 0,00-
5,96 5,03-30,26 Kukrer, 2009
4
9
,
0
4
-LD
B
9
9
,
82-
L
DB
5
3
,
12-
LD
B
30
0
2
y
d
utS
s
i
h
T
0,16-54,12 BDL-31,43 BDL-66,13 This Study
* Min-Max;
** Average value;
*** Data from (32);
BDL: Below Detection Limits
Table 6. Minimum and maximum concentrations of nutrient and chlorophyll-a in Izmir Bay
and Aegean Sea from different studies
Effects of Wastewater Treatment Plant on
Water Column and Sediment Quality in Izmir Bay (Eastearn Aegean Sea)
261
Fig. 2. Temporal changes of the average water column light intensities obtained from model
in 1993 (Black curve, Büyükışık et al 1997) and from chl-a values in 2003 (gray lines, Sunlu
et.al, 2007). The black curve at top represents the temporal changes in incoming sub-surface
light intensities (Büyükışık et al 1997).
Fig. 3. Temporal changes of the average light intensities obtained from model in case of 90%
nutrient treatment (black curve, Büyükışık et al 1997) and from chl-a values in 2003(gray
lines, Sunlu et al, 2007). The black curve at top represents the temporal changes in incoming
sub-surface light intensities (Büyükışık et al 1997).
Waste Water - Evaluation and Management
262
Fig. 4. Temporal changes of the phytoplankton biomass obtained from model in case of 90%
efficiently treatment (light gray curve, Büyükışık et al 1997). The dark gray curve represents
the model run outs in 1993 (moving average, Büyükışık et al 1997). Black column in graph
represents the measurements in 2003 from biomass calculates two microscopic examinations
(Sunlu et al, 2007).
3.2 Sediment
Values measured at stations ranged between; 0.09–9.32 μg/L for phaeopigment, 0.05–1.91
mg/L for particulate organic carbon in sea waters, 11.88–100.29 μg/g for chlorophyll
degradation products and 1.12–5.39% for organic carbon in sediment samples. In
conclusion, it was found that grazing activity explained carbon variations in sediment at
station 2, but at station 1 and station 3 carbon variations in sediment were not related to
autochthonous biological processes.
3.2.1 Organic carbon in sediment
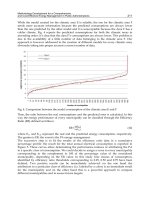
Organic carbon values at station 1 ranged from 2.63 to 3.39%. Average concentration was
3.03%. Minimum, maximum and average organic carbon values at station 2 were 1.73, 5.39
and 4.33% respectively. Organic carbon values at station 3 ranged from 1.12 to 2.41%.
Average concentration was 1.58% (Fig. 5). Previous carbon contents in the sediment samples
from the different regions of Aegean Sea were given in Table 7.
3.2.2 Chlorophyll degradation products in sediment (CDP)
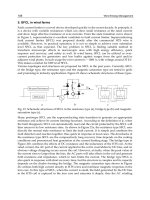
Chlorophyll degradation products in sediment at station 1 ranged from 50.79 to 90.66 μg/g
and average value was found 62.62 μg/g. At station 2 average CDP value was 81.39 μg/g.
Minimum and maximum values were measured as 41.58–100.29 μg/g respectively. CDP
Effects of Wastewater Treatment Plant on
Water Column and Sediment Quality in Izmir Bay (Eastearn Aegean Sea)
263
ORGANIC CARBON %
STATIONS
123
Box-and-Whisker Plot
0
1
2
3
4
5
6
Fig. 5. Box and whisker plot of Organic carbon (%) values at all sampling stations.
concentrations at station 3 ranged from 11.88 to 52.12 μg/g. Annual mean was 34.44
μg/g(Fig. 6). When each three region was discussed separately, at the Station 2, algal
sedimentation and/or mesozooplankton grazing explain variations of carbon in the the
sediment samples (r=0.7879 p=0.0023). According to statictical analyses of C sed/CDP for
each region, variations of CDP in sediment seems independent from carbon in sediment
variations for station 1 and station 3 in sequence (r=0.339, r=0.206). Melez, Manda and Arap
Rivers discharge their waters rich in organic mater around station 1 (Turkman 1981). At
station 3, during the year CDP concentrations were at the lowest value and it can be
explained by background carbon levels that mask carbon variations which is caused by
algae (< %2). Besides, the output of the wastewater treatment plant is close to the station 3
and it constitutes crucial silicate source. Diatoms consist of skeleton with silica are known as
having five times lower carbon content than Dinoflagellates (Hitchcock 1982 in Smayda
1997). That situation can explain that during the year phytoplankton community has lower
carbon content. Even if export production to sediment increases relatively low productivity
and low carbon content in water column can cause a similar situation in diatom dominated
marine environments. By using overall data in Inner and Middle Izmir Bay, chlorophyll
degradation products in sediment versus carbon values were plotted. A good linear
relationship between CDP and carbon was obtained (r2=0.771, p=0.000):
[Carbon]
sed
=0.2077+0.0466*[CDP]
sed
A general equation was found for predicting the Izmir Inner Bay’s CDP and organic carbon
values in sediment. It was found that there are no significant differences in sediment carbon
values depending on time but spatial variations related to sampling stations are more
evident. When spatial scale is widened, CDP variations explained 77% of carbon variations
in the sediment for overall data. Approximately 23% of these variations were originated
from allocthonous sources.
At station 3, it is possible that grazing on diatoms and/or mixotrophy in dinoflagellates are
dominant on certain onths of the year. Consequently, it is not possible to explain variations
of the carbon in sediment with the pigment contents of sediment. Station 2 has highest
Waste Water - Evaluation and Management
264
carbon and CDP values and also has a relationship between CDP and organic carbon
content. This situation can be explained by the fact that station 2 is relatively away from
external sources and has high biological activity (Sunlu et al. 2007). At station 1, however,
relation is weak despite higher carbon and CDP values than at station 3. Contribution of
external carbon sources as rivers may play important role on this weak correlation.
CDP (µg/g)
123
Box-and-Whisker Plot
0
20
40
60
80
100
120
STATIONS
Fig. 6. Box and whisker plot of CDP ( µg/g dry sediment) values at all sampling stations.
Locations
Carbon in Sediment
(%)
Reference
Middle part of Izmir Bay 0.87-1.60 Yaramaz et. al. 1992
Inner part of Izmir Bay 0.57-3.42 Yaramaz et. al. 1991
Izmir Bay 11.4 Anonymous, 1992
Izmir Bay 2.0-7.0 Anonymous, 1997
Gulluk Bay (Southern Aegean
Sea)
0.1-4.5 Egemen et. al. 1999
Gulluk Bay (Southern Aegean
Sea)
1.07-2.13 Atılgan, 1997
Urla (Middle part of Izmir Bay) 1.25-2.1 Sunlu et. al. 1999
Pariakos Bay (Greece) 0.15-11.01
Varnavas and Ferentionos,
1982
Evoikos Bay (Greece) 1.2
Scoullos and Dassennakis,
1982
Evoikos Bay (Greece) 0.66-2.4 Angelidis et. al. 1980
Southern Turkish Aegean Sea 1.3-13.1 Aydın and Sunlu, 2005
Northern Turkish Aegean Sea 0.35-15.63 Sunlu et. al. 2005
Middle part of Izmir Bay 1.12-5.39 This Study
Table 7. Previous carbon contents in the sediment samples from the different regions of
Aegean Sea.
Effects of Wastewater Treatment Plant on
Water Column and Sediment Quality in Izmir Bay (Eastearn Aegean Sea)
265
4. Conclusion
When our mean results were compared with those obtained before Izmir wastewater
treatment plant was operating, concentrations of chlorophyll a and nitrogen forms declined
while it was not the case for orthophosphate.
The fact that the processes affecting Reactive Phosphate (RP) and TIN occur at different
times indicates important differentiations in the temporal variations of these two nutrients
in the Inner Bay. From the distribution of the nutrients and their percentages, important
evidence regarding the process have been gathered. These processes:
• Inflow with the creeks is especially evident during rainfall and there is a big increase in
Si and Nitrogen forms.
• Rapid decreases of freshwater inflows from rainfall based on current global warming
tend to restrict Si and N inflows. Water outflow treated from treatment plant is another
source of nutrient with N/P ratios being about <=2. RP induced by water from
treatment plant thus contributes to RP reserves in Inner Bay.
• The winds, although increasing fresh water inflow and water column, frequently carry
the deep water to the surface. This shows that the Inner Bay is often subject to a deep-
water-based nutrient enrichment.
The phytoplankton blooms caused by the inflow of nutrients to the Inner Bay in turn result
in the intake of nutrients by the phytoplanktons (especially diatoms) which are then
exported to the deep waters and constitute the fuel for future phytoplankton blooms. Thus,
the horizontal exportation of the nutrients out of the Inner Bay remains limited. It is only
due to the winds that the wastewaters flow outwards from time to time.
Because total renewal of Inner Bay water by the current system takes about ten days,
nutrient load provided by various sources in the area is most important reason for
overgrowth of phytoplanktons observed in the Izmir Bay.
Silicate is essential for the diatoms to compete effectively with dynophylagellates and plays
an important role in the increase in species in the bay and this nutrient, coming with the
rainfall from the shore in non-point sources and point sources (i.e. creek, river), is of great
importance for the Inner Bay.
We believe that unless the nutrient levels in the rivers are decreased, the Bay will continue
its current state for a long time. Although a decrease has been observed in the nitrogen
nutrients after the start of the wastewater treatment plant, former studies have shown that
the phosphate concentrations have not changed and that the plant has been ineffective
regarding this subject. The effective treatment of phosphate will be an important precaution
against the new strategy that the phytoplankton might take up against the decreasing TIN.
The reason for this was that 2– 10 years elapsed between the two studies and the treatment
facility begun to work in full capacity in 2002. On the other hand; carbon contents in the
sediment samples of our study are considerably lower compared with the values obtained
in a large scale previous research carried out by different regions around Aegean Sea.
General sediment texture of Izmir Bay was studied by Duman et al. (2004). Average
sediment particle size was reported to be 4–8 ф and sediment texture to be sandy-silt. In
Izmir Bay sorting coefficient indicates very poorly sorted deposits (SD=2–3). Prevailing
wind direction in inner part of Izmir Bay was noted as Western and it has been reported that
deep flow was toward to East and surface flow toward to West. Most of organic material
remains in the silt near the pollution source and the correlation between grain size fractions
and organic carbon was found to be highest in silt (Duman et al. 2004). One sediment
component, vermiculite was found in the inner part of Izmir Bay at a rate of 3–11% and its
Waste Water - Evaluation and Management
266
main source was from Melez River (near station 1). Caolinit was found at a rate of 8–12%
with neogen sediments coming from the rocks around the Bay (Aksu et al. 1998). Percentage
of organic carbon was reported to be between 0.40 and 5.39 by Duman et al., from Izmir Bay
(Duman et al. 2004). Range for these values was found to be between 1.12 and 5.39% in our
study. These values were higher than previous report (Duman et al. 2004). The reason for
this was that 2– 10 years elapsed between the two studies and the treatment facility begun to
work in full capacity in 2002. On the other hand; carbon contents in the sediment samples of
our study are considerably lower compared with the values obtained in a large scale
previous research carried out by different regions around Aegean Sea (Table 7). It can be
said that high carbon levels observed in inner part of Izmir Bay were from raw sewage and
industrial outfalls carried by Melez River at station 1. But at station 2 and 3 high carbon
levels were due to organic material formed by secondary pollution. The biggest contribution
to the sediment is provided byexport production which was especially effective at station 2.
A general equation was found for predicting the Izmir Inner Bay’s CDP and organic carbon
values in sediment. There are no significant differences in sediment carbon values
depending on time but spatial variations (related to sampling stations) are more evident . In
conclusion, it was found that carbon variations in sediment at station 2 (Karşıyaka, Offshore
of the Yatch Club) can be explained by grazing activity, but at station 1 (Melez, Izmir
Harbour) and station 3 (Cigli, Offshore of the Wastewater Treatment Plant) carbon
variations in sediment could be related not only with autochthonous biological processes
but also with physical processes (e.g. sweeping out of plant material by advection from the
Bay). Especially wastewater treatment improves the water quality, but sediment does not
respond to this treatment as fast as water column. Improvement in the quality of bottom
water and sediment is the evidence of the recovery of the whole ecosystem of the Izmir Bay.
In conclusion, it was found that carbon variations in sediment at station 2 (Karşıyaka, Offshore
of the Yatch Club) can be explained by grazing activity, but at station 1 (Melez, Izmir Harbour)
and station 3 (Cigli, Offshore of the Wastewater Treatment Plant) carbon variations in
sediment could be related not only with autochthonous biological processes but also with
physical processes (e.g. sweeping out of plant material by advection from the Bay).
Especially wastewater treatment improves the water quality, but sediment does not respond
to this treatment as fast as water column. Improvement in the quality of bottom water and
sediment is the evidence of the recovery of the whole ecosystem of the Izmir Bay.
5. Acknowledgments
The authors would like to thank TUBITAK (Turkish Scientific and Technical Research
Council) Project no: 102Y116, Izmir Municipality Gulf Control Staff and Science and
Technology Research Centre of Ege University (EBILTEM) for their efforts to join of this
project and their scientific and financial supports.
6. References
Aksu, A. E., Yatar, D., & Uslu, O. (1998). Assessment of marine pollution in Izmir Bay; heavy
metal and organic compound concentrations in surficial sediments. Turkish Journal
of Engineering and Environmental Science, 22, 387–415.
Aksu, M., Kaymakçı Basaran, A. & Egemen,Ö. (2010). Long-term monitoring of the impact
of a capture-based bluefin tuna aquaculture on water column nutreint levels in the
Effects of Wastewater Treatment Plant on
Water Column and Sediment Quality in Izmir Bay (Eastearn Aegean Sea)
267
Eastern Aegean Sea, Environ Monit Assess, 171: 681-688, DOI 10.1007/s10661-010-
1313-y.
Angeldis, M., Grimanis, A. D., Zafiropoulos, D., & Vassilaki- Grimani, M. (1980). Trace
elements in sediments of Evoikos Gulf, Greece. Ves Journe’es Etud. Poll.Cagliari,
CIESM, 413–418.
Anon (1992). Environmental impact report of alternative dumping areas of Izmir Harbour and
approaching channeldredged material, (in Turkish), Dokuz Eylul Universitesi Deniz
Bilimleri Enst. s, 14–15. Anon (1997). Izmir Bay Marine Research 1994–1998 (1997
Report), (in Turkish), D. E. U. Den. Bil.Tek.Enst.Proje No:DBTE-098.
Anon (1997). Izmir Bay Marine Research 1994–1998 (1997 Report), (in Turkish), D. E. U.
Den.Bil.Tek.Enst.Proje No:DBTE-098.
Atılgan, İ. (1997). Comparative investigations of carbon, organic matter (loss on ignition) and some
heavy metal (Cu, Zn) levels of sediments of Gulluk and Homa Lagoon, (in Turkish) (Yüksek
Lisans Tezi, M.Sc.) E. U. Fen Bilimleri Enst. Su Urunleri Anabilim Dalı, pp. 1–15.
Aydın, A. & Sunlu, U. (2005). Investigation of carbon and organic matter (loss on ignition)
concentrations in the sediments of South Aegean Sea, (in Turkish), E.U. Journal of
Fisheries and Aquatic Sciences volume; 21, issue;3–4 pp. 229–234.
Bizsel, N. & Uslu, O., 2000, Phosphate, Nitrogen and Iron Enrichment in The Polluted Izmir
Bay, Agean Sea Mar Environ Res 49 (4): 397-397,
Büyükışık, B., Ş. Gökpınar & H. Parlak. (1997). Ecological modelling of İzmir Bay. Journal of
Fisheries and Aquatic Sciences, 14(1-2):71-91.
Colak-Sabancı, F. & T. Koray, 2001, The effect of pollution on the vertical and horizontal
distribution of microplankton of the bay of Izmir (Aegean Sea). (in Turkish). Journal
of Fisheries and Aquatic Sciences, 18(1-2) :187-202.)
Duman, M., Avci, M., Duman, S., Demirkurt, E., & Duzbastilar, M. K. (2004). Surficial
sediment distribution and net sediment transport pattern in Izmir Bay, Western
Turkey. Continental Shelf Research, 24, 965–981.
Egemen, O., Gokpinar, S., Onen, M., Buyukisik, B., Hossucu, B., Sunlu, U., et al. (1999).
Gulluk Lagoon ecosystem (Aegean Sea/Turkiye), (in Turkish). Turkish Journal of
Agriculture and Forestry suplement issue, 3, 927–947.
Environment for Europeans (2005). Keeping our seas alive. Magazine of the Directorate-
General for the environment. No;21, pp.3–4. Brussels.
Gaudette, H. E., Flight, W. R., Toner, L., & Folger, W. (1974). An inexpensive titration
method for the determination of organic carbon in recent sediments. Journal of
Sedimentory Petrology, 44, 249–253.
Hilal Aydın Gençay & Baha Büyükışık, 2006, The studies on phytoplankton population
Dynamics at DEM Harbour (Çandarlı
Bay, Aegean Sea),
E.U. Journal of Fisheries &
Aquatic Sciences, Volume 23, Issue (1-2): 43–53
Hitchcock, G. L. (1982). A comparative study of the sizedependent organic composition of
marine diatoms and dinoflagellates. Journal of plankton research, 4, 363–377
Kaymakci, A., Sunlu, U., & Egemen, O. (2000). Assessment of nutrient pollution caused by
land- based activities in Izmir Bay, Turkiye. Meeting on Interdependency between
Agriculture, Urbanization: Conflicts on Sustainable Use of Soil, Water, Tunisia: pp. 41–49.
Kontas, A., Kucuksezgin, F., Altay, O., & Uluturhan, E., 2004, Monitoring of eutrophication
and nutrient limitation in the Izmir Bay (Turkey) before and after Wastewater
Treatment Plant. Environment International, 29(8), 1057–1062.
Koray, T., Buyukisik, B., Parlak, H. & Gokpınar, Ş.,1992, Unicellular organisms effecting sea
water quality in the bay of Izmir: red tides and other blooming, Doğa Tr. J. of Biology
16, 135-157 p.
Waste Water - Evaluation and Management
268
Kucuksezgin, F.; Kontas, A.; Altay, O.; Uluturhan, E. & Darılmaz, E., 2006, Assessment of
marine pollution in Izmir Bay: Nütrient, heavy metal and total hydrocarbon
concentrations. Environment International, 32(1), 41-51.
Kukrer, S., (2009). Investigating the effects of creeks to eutrophication in İzmir Bay on cleaning
process. Ege University,PhD thesis, 162 p.
Kükrer, S. & Aydın, H. 2006.Investigation of temporal changes of phytoplankton in
Karşıyaka Yacht Port (İzmir iner bay). E.U. Journal of Fisheries & Aquatic Sciences
2006 Volume 23, Issue (1-2): 139–144. (in Turkish).
Lorenzen, C. J. (1971). Chlorophyll-degradation products in sediments of Black Sea.
WoodsHole Oceanographic Institution Contribution No; 2828, pp. 426–428.
Morris, I., 1980, The Physiological Ecology Of Phytoplankton.(Studies İn Ecology; Vol 7)
University of California Press. P. 621
Özkan, E.Y., Kocataş, A. & Büyükışık, B., 2008, Nutrient dynamics between sediment and
overlying water in the iner part of Izmir Bay, Eastern Aegean, Environmental
Monitoring Assess 143, 313-325 p.
Parsons, T. R., Matia, Y., & Lalli, C. M. (1984). A manual of chemical and biological methods for
seawater analysis p. 173. New York: Pergamon Press.
Scoullos, M., & Dassenakis, M. (1982). Trace metal levels in sea water and sediments of
Evoikos Gulf. Greece. Ives Journe’es Etud. Poll. Cannes, CIESM, pp. 425–429.
Smayda, T. J. (1997). Harmful algal blooms: Their ecophysiology and general relevance to
phytoplankton blooms in the sea. Limnology and oceanography, 42(5, part 2), 1137–1153.
Strickland, J. D. H., & Parsons, T. R. (1972). A practical handbook of seawater analysis. Fisheries
Research Board of Canada. Bull. 167. Ottowa, 310 p.
Sunlu, U., Aydın, A., & Egrihanci (Ozcetin) N. E. (2005). Investigation of carbon and organic
matter (%) concentrations in the sediments of North Aegean Sea, (in Turkish), E.U.
Journal of Fisheries & Aquatic Sciences 22,(3–4), 263–268.
Sunlu, U., Buyukisik, H. B., Koray, T., Brockel, K., Sunlu, F. S. & Sever, T. M. et al. (2007). The
effects of Izmir Big Channel waste water treatment project to the lower trophic level
of Izmir Bay (Aegean Sea, Turkey). The Scientific and Technical Research Council of
Turkey (TUBITAK-CAYDAG) Project No;102Y116 Final Report. 253p. (in Turkish).
Sunlu, U., Egemen, O., Kaymakci, A., & Tüzen (1999). Investigation of impact of fish rearing
at net cages on sediment in Urla Pier, (in Turkish), X. National Fisheries
Symposium., 22–24 september l999. Adana.
Turkman, A. (1981). Evaluation of results of the analyses of the secondary rivers discharging
to Izmir Bay, (in Turkish), Devolopment of Soil And Water Resources Conference,
2, 723–750.
Varnavas, S. P., & Ferentionos, G. (1982). Heavy Metal distribution in the surface sediments
of Pataraikos Bay, Greece, Vies Journes’es Etud. Poll.Cannes, CIESM., pp. 405–409.
Wood, R., (1975). Hydrobotanical Methods, Univ.Park Press, London:173.
Yaramaz, O., Modogan, H., Onen, M., Sunlu, U., & Alpbaz, A. (1991). Investigation of some
heavy metals (Fe,Mn, Ni) and organic matter (%C) concentrations in the sediments
of the Izmir Bay, (in Turkish), X. National Fisheries Symposium.12–14 Kasim 1991,
Izmir, s: 406–413.
Yaramaz, Ö., Önen, M., Sunlu, U., & Alpbaz., A. (1992). Comparative investigations of some
heavy metal (Pb,Cd, Zn,Cu) levels in the sediments of Izmir Bay, (in Turkish), First
International environmental protection symposium proceding, vol 2. In Zafer
AYVAZ (ed.), s.15–19, Ege University Izmir-TURKIYE.
13
Effects of Domestic Waste Water on Water
Quality of Three Reservoirs Supplying Drinking
Water in Kaduna State - Northern Nigeria
Yahuza Tanimu, Sunday Paul Bako and John Ameh Adakole
Department of Biological Sciences,
Ahmadu Bello University,
Nigeria
1. Introduction
Waste water management in Nigeria does not receive the attention it deserves. Domestic
waste water is discharged into streams and reservoirs that supply drinking water without
any treatment (Tiseer et al., 2008). Chemical substances from agricultural activities
(fertilizers, pesticides and herbicides) in the catchment of reservoirs may introduce nutrients
and heavy metals at concentrations higher than that which the environment can handle
(WHO, 2006). Nigeria has a number of environmental regulatory laws which include: the
National Environmental Standards and Regulations Enforcement Agency (Establishment)
Act of 2007 (The NESREA Act), Nigerian Radioactive Waste Management Regulations 2006,
Environmental Impact Assessment Act of 1992 (EIA Act), Harmful Wastes (Special Criminal
Provisions etc.) Act of 1988 (Harmful Wastes Act), the National Oil Spill Detection and
Response Agency (Establishment) Act 2006 (the NOSDRA Act) and Nigerian Radioactive
Waste Management Regulations 2006. However, the enforcement of these regulations has
not been effective (Onaruwa and Fakayode, 2002 and Adegoroye, 2008) and thus pollution
of both rural and urban water sources commonly occurs. In rural areas, natural sources of
drinking water, such as streams, wells and other reservoirs are usually polluted by organic
substances from upstream users who use water for Agricultural activities and other
domestic purposes. In urban areas, population pressure, industrial activities and
agricultural activities place pollution stress on reservoirs of water (Adakole et al., 2002,
Fakayode, 2005 Kimura, 2005, Tiseer et al., 2008). The water in these reservoirs is sometimes
taken directly without any form of treatment.
Contamination of sources of water by waste alters water quality (the physical, chemical and
biological characteristics).When the physical and chemical conditions of ecosystems are
changed beyond their normal ranges, changes may be expected to occur in individual
organisms, populations and communities of the ecosystem (Lenat et al., 1980, Akin-Oriola,
2003, Kadiri, 2006). Assemblages of cyanobacteria are good indicators of eutrophic water
bodies (Reynolds, 1998). Some species of cyanobacteria could contain cyanotoxins in their
cells but do not release these into the water, and as such are harmful only when consumed
while others release toxins directly into the water (Chorus and Batram, 1999 and WHO,
2006). They can also alter taste and odor problems, cause water discoloration, or form large
Waste Water - Evaluation and Management
270
mats that can intefere with boating, swimming, and fishing (Borgh, 2004). Cyanobacteria
present a range of characteristics that give them clear competitive growth advantage over
planktonic algae under certain environmental conditions. Such include; a requirement of
low light intensity and little energy to maintain cell structure and function (Mur et al., 1999);
possession of gas vacuoles within their cells as a buoyancy regulation mechanism to avoid
light damage in high-light environments, such as in tropic lakes or to access light in turbid
or low-clarity water (Haider et al., 2003). Cyanobacteria can also store phosphorus (luxury
uptake), as a useful adaptation that allows continued growth under conditions of
fluctuating nutrient concentrations. They are also not grazed by zooplankton, since they are
not the preferred food for these aquatic organisms (Chorus and Batram, 1999).
Data on levels of aquatic pollution and its implication to human health is generally lacking
for most aquatic ecosystems in Nigeria. This study was therefore designed to evaluate the
impact of waste water on three reservoirs receiving varying degrees of waste water.
2. Materials and methods
2.1 Study area
The three reservoirs studied were Gimbawa reservoir in Ikara Local Govt. (Long.10
0
6’N and
Lat.8
0
35’E), Saminaka reservoir in Lere Local Govt. (10
o
70’N and 8
o
75’E) and Zaria reservoir,
Zaria Local Government (7
0
38’N and 11
0
11’E) of Kaduna State. Kaduna State is located in
the northern guinea savannah vegetative zone of Nigeria and has a tropical continental
climate, with distinct wet and dry seasons. Three sampling stations were studied in each
reservoir based on the diffrent activities in the catchment from May 2008 to April 2009.
2.2 Phytoplankton collection:
Phytoplankton was collected using a conical shape plankton net of 20 cm diameter with a 50
ml collection vial attached to it (Perry, 2003). Samples were collected at three sampling
points in each reservoir to reflect the various activities in the catchment. Phytoplankton was
identified by consulting texts by Presscott (1977) and Perry (2003).
2.3 Physico-chemical parameters
Physico-chemical parameters of water were analyzed once a month from May 2008 to April
2009. Surface water temperature was measured in situ using a mercury thermometer. pH
and Electrical Conductivity were measured using HANNA instrument (pH/Electrical
Conductivity/Temperature meter model 210). Total Hardness, Dissolved oxygen (DO),
Biological Oxygen Demand (BOD), Nitrate-Nitrogen (NO
3
-N) and Phosphate-phosphorus
(PO
4
-P) were determined by methods described by APHA (1998).
2.4 Metal analysis
Metal concentration in the water samples was determined by Atomic Absorption
Spectrophometry (AAS). Water samples were digested by Nitric acid (HNO
3
) digestion (as
described by APHA, 1998).
3. Statistical analysis
Analysis Of Variance (ANOVA) was used to compare the means of physicochemical
parameters; heavy metals concentration and abundance of phytoplankton from the different
Effects of Domestic Waste Water on Water Quality of Three Reservoirs
Supplying Drinking Water in Kaduna State- Northern Nigeria
271
reservoirs. Pearson’s correlation coefficient was used to determine the relationship between
physicochemical parameteres; physicochemical parametres and phytoplakton. Shannon-
Wiener diversity index was used to determine phytoplankton diversity while Simpson’s
Index was used to determine evenness of phytoplankton distribution.
4. Results
Mean monthly Air Temperature varied from 27.67 to 34.17
0
C with mean ± standard error of
31.76±0.62
0
C (Table1), for Gimbawa reservoir, whereas in Saminaka reservoir it ranged
between 25
0
C and 36.67
0
C with mean ± SE of 30.96±0.97
0
C. In Zaria reservoir, air
temperature ranged from 26 to 35.33
0
C mean ± SE of 29.67±0.68
0
C(Table 1). This observed
difference was however not statistically significant.
The three reservoirs had mean ± SE of Surface water temperature was 26.16±1.00
0
C
(Gimbawa), 26.19±1.07
0
C (Saminaka) and 26.08±0.63
0
C (Zaria) (Table 1). The differences were
however, not statistically significant between months, seasons and reservoirs (P > 0.05).
Gimbawa Saminaka
Zaria
Min Max Mean ± SE Min Max
Mean ± SE
Min Max Mean ± SE
Air
Temperature
(
0
C)
27.67 34.67 31.76 ± 0.62 25 36.67 30.96 ± 0.97 26 35.33 29.67 ± 0.68
Water
Temperature
(
0
C)
20.33 31.67 26.16 ± 1.00 20 31 26.19 ± 1.07 20.67 28 26.08 ± 0.63
Secchi disc
Transparency
(cm)
13.67 69.67 17.67 ± 6.06 8.17 19.33 7.29 ± 2.19 13.67 47 21.48 ± 4.46
pH
6.87 8.76 7.54 ± 0.15 6.46 8.21 7.34 ± 0.15 6.42 7.9 7.31 ± 0.14
Electrical
Conductivity
( µS/cm)
45.1 573.33 120.50 ± 41.95 12.33 496 128.07 ±40.00 31.67 518 97.20 ±38.59
Dissolved
Oxygen
(Mg/L)
6.87 8.76 6.71 ± 0.39 3.52 9.1 6.16 ± 0.53 3.73 10.22 6.44 ± 0.58
BOD
(Mg/L)
0.16 4.37 2.17 ± 0.41 0.37 5.57 2.60 ± 0.5 0.06 3.54 1.68 ± 0.38
Alkalinity
(Mg/L)
2.87 6.7 5.05 ± 0.32 2.43 14.8 6.77 ± 1.16 2.5 5.8 4.29 ± 0.31
Hardness
(Mg/L)
0.5 3.93 1.26 ± 0.26 0.43 4.53 1.46 ± 0.30 0.6 5.1
N0
3
-N
(Mg/L)
0.03 0.19 0.12 ± 0.01 0.02 0.16 0.09 ± 0.01 0.01 0.55 0.13 ± 0.05
P0
4
-P
(Mg/L)
0.06 0.62 0.29 ± 0.06 0.06 0.76 0.39 ±0.08 0.03 0.8 0.39 ±0.08
SE = Standard Error, BOD = Biochemical Oxygen Demand, N0
3
-N = Nitrate-Nitrogen, P0
4
-P =
Phosphate-phosphorus
Table 1. Physico-chemical characteristics of Gimbawa, Saminaka and Zaria reservoirs
Waste Water - Evaluation and Management
272
Secchi Disc Transparency values in Gimbawa reservoir had the highest value of 69.67cm
and lowest of 13.67cm. In Saminaka reservoir, the values ranged from 4.36 to 19.33cm, while
in the Zaria reservoir it ranged from 13.67 to 47cm. The mean ± Standard Error of the
reservoirs are Gimbawa: 17.67±6.06cm, Saminaka: 7.29±2.19cm and Zaria: 21.48±4.46cm
(Table 1). This observed difference was statistically significant between reservoirs (P < 0.05)
and between seasons (P < 0.05).
pH values in Gimbawa reservoir varied from 6.87 to 8.76. In Saminaka reservoir, the highest
pH value was 8.21 and lowest was 6.46.While in Zaria reservoir, the highest pH value was
7.9 and lowest of 6.42. The mean±SE observed in the reservoirs were: Gimbawa, 7.54±0.15;
Saminaka, 7.44±0.15 and Zaria, 7.31±0.14 (Table 1). The observed differences were not
significant between reservoirs (P > 0.05) but significant between months (P < 0.05) and
seasons (P < 0.01).
The mean±SE Electrical of Conductivity (EC) for Gimbawa, Saminaka and Zaria reservoirs
observed were 120.50± 41.95μS/cm, 128.07± 40.00μS/cm and 97.20± 38.59μS/cm
respectively (Table 1). The variation of EC was significant only between months (P < 0.05).
Dissolved Oxygen (DO) varied between 8.58mg/L and 3.9 mg/L in Gimbawa reservoir,.
Saminaka reservoir had values ranging between 9.1mg/L to 3.52ml/L while in Zaria
reservoir had range of values for DO from 3.73 mg/L to 10.22 mg/L. The mean±SE of
Gimbawa, Saminaka and Zaria reservoirs observed were 6.71± 0.39 mg/L, 6.16± 0.53mg/L
and 6.44 ± 0.58 respectively (Table 1). The variation of DO was significant between months
and seasons (P < 0.05).
Biochemical Oxygen Demand (BOD) values in Gimbawa reservoir ranged from 4.37mg/L to
0.16mg/L, In Saminaka reservoir the values range from 0.37 to 5.57mg/L whereas in Zaria
reservoir the values ranged from 0.06mg/L to 3.54mg/L. The mean±SE of Gimbawa,
Saminaka and Zaria reservoirs observed were 2.17± 0.41 mg/L, 2.60± 0.50mg/L and 1.68 ±
0.38mg/L respectively (Table 1). The variation of BOD was significant between months and
seasons (P < 0.01).
The mean ± SE of Alkalinity for Gimbawa, Saminaka and Zaria reservoirs observed were
5.05± 0.32 mg/L, 4.29± 0.31mg/L and 6.77 ± 1.16mg/L respectively (Table 1). The variation
of Alkalinity was significant between months, reservoirs (P < 0.05) and between seasons (P <
0.01).
The mean ± SE of Hardness for Gimbawa, Saminaka and Zaria reservoirs observed were
1.26± 0.26 mg/L, 1.46± 0.30mg/L and 1.49 ± 0.36mg/L respectively (Table 1). These
variations however, were only significant between months (P < 0.05) and not between
months and seasons (P > 0.05).
Nitrate-nitrogen concentration for Gimbawa reservoir had a highest value of 0.19 mg/L and
lowest of 0.03mg/L. Saminaka reservoir had a highest value of 0.16 mg/L and lowest of
0.02mg/L. Zaria reservoir had its highest value of 0.55 mg/L and lowest of 0.01 mg/L. The
mean ± SE Nitrate-nitrogen concentration for Gimbawa, Saminaka and Zaria reservoirs
observed were of 0.01 mg/L, 0.09± 0.05mg/L and 0.13 ± 0.05mg/L respectively (Table 1).
These variations however, were not statistically significant between reservoirs, months and
seasons (P > 0.05).
For phosphate-phosphorus concentration, Gimbawa had its highest value of 0.62mg/L and
lowest of 0.18mg/L. Saminaka reservoir had the highest concentration of 0.76mg/L and
lowest of 0.04mg/L. Zaria reservoir had its highest value of 0.8mg/L and lowest of 0.04mg/L.
The mean±SE of Gimbawa, Saminaka and Zaria reservoirs observed were 0.29± 0.06 mg/L,
0.39 ± 0.08mg/L and 0.39 ± 0.08mg/L respectively (Table 1).These variations however, were
only significant between months (P < 0.01) but not between reservoirs and seasons (P > 0.05).
Effects of Domestic Waste Water on Water Quality of Three Reservoirs
Supplying Drinking Water in Kaduna State- Northern Nigeria
273
4.1 Metal ions
The lowest concentrations of Cu, Zn, Mn, Fe and Cr were below detectable limits in the
three reservoirs. The highest concentration of Cu, Zn and Cr was recorded in Zaria reservoir
(0.39, 0.50 and 1.10 mg/L respectively). Gimbawa reservoir had the highest concentration of
Mn (1.01mg/L) and Fe (1.14mg/L). The mean ± SE of these metals in Gimbawa, Saminaka
and Zaria respectively are Cu: 0.03 ± 0.03mg/L, 0.03 ± 0.02mg/L and 0.04 ± 0.03mg/L; Zn:
0.03± 0.03 mg/L, 0.02± 0.01 mg/L and 0.04 ± 0.04 mg/L; Mn : 0.08 ± 0.08, 0.09 ± 0.06mg/L
and 0.06 ± 0.06 mg/L mg/L; Fe: 0.28± 0.1 mg/L, 0.89± 0.43 mg/L and 0.51± 0.28 mg/L and
Cr: 0.43± 0.07 mg/L, 0.36± 0.06 mg/L and 0.34 ± 0.08.
Concentrations of Nickel in the three reservoirs showed the highest concentrations of 1.06,
1.0 and 1.17 mg/L; and lowest concentrations of 0.17, 0.26 and 0.17 mg/L for Gimbawa,
Saminaka and Zaria reservoirs respectively (Table 2). The mean ± Standard Error for the
reservoirs were 0.64± 0.08 mg/L, 0.62± 0.06 mg/L and 0.69± 0.10 mg/L for Gimbawa,
Saminaka and Zaria reservoirs respectively (Table 2). These differences were however not
significant between reservoirs, months and seasons (P > 0.05).
Gimbawa Saminaka Zaria MPL
Min Max Mean
± SE
Min Max Mean ±
SE
Min Max Mean ±
SE
Copper
(mg/L)
ND 0.34 0.03 ±
0.03
ND 0.25 0.03 ±
0.02
ND 0.39 0.04 ±
0.03
2mg/L*
Zinc
(mg/L)
ND 0.3 0.03 ±
0.03
ND 0.17 0.02±
0.01
ND 0.5 0.04 ±
0.04
3mg/L*
Manganese
(mg/L)
ND 1.01 0.08
±0.08
ND 0.58 0.09 ±
0.06
ND 0.72 0.06 ±
0.06
0.5mg/L*
Cadmium
(mg/L)
0.06 0.22 0.14±
0.01
0.06 1.87 0.16 ±
0.02
0.06 0.25 0.11 ±
0.02
0.003mg/L*
Iron
(mg/L)
ND 1.14 0.28 ±
0.1
ND 5.5 0.89 ±
0.43
ND 3.55 0.51 ±
0.28
0.3mg/L*
Nickel
(mg/L)
0.17 1.06 0.64 ±
0.08
0.26 1 0.62 ±
0.06
0.17 1.17 0.69 ±
0.10
0.02mg/L*
Chromium
(mg/L)
ND 0.96 0.43 ±
0.07
ND 0.67 0.36±
0.06
ND 1.1 0.34 ±
0.08
0.05mg/L*
Calcium
(mg/L)
2.33 41.67 7.70 ±
3.10
1 20 6.4 ±
1.93
1 40 5.6 ±
3.14
200mg/L*
Magnesium
(mg/L)
1.6 4.7 3.01 ±
0.24
0.9 8.3 3.19±
0.74
0.8 5.1 2.59 ±
0.31
0.02mg/L**
Potassium
(mg/L)
2.6 8.5 4.80 ±
0.56
2.4 9.4 4.8 ±
0.55
2.8 6 4.2 ±
0.26
200mg/L*
Sodium
(mg/L)
8.9 14.5 12.19 ±
0.53
6.4 27.3 11.49 ±
1.75
6.8 15.9 9.84 ±
0.74
200mg/L*
ND= not detectable, Min= minimum, Max= maximum, SE= Standard Error *WHO, 2006 ** Standard
Organisation of Nigeria, 2007, MPL = maximum permissible limit
Table 2. Mean Values of Metal ions Observed in Gimbawa, Saminaka and Zaria reservoirs
Waste Water - Evaluation and Management
274
The highest concentrations of 1.01, 0.58 and 0.5 mg/L of Manganese were observed in
Gimbawa, Saminaka and Zaria reservoirs, the lowest concentrations of Manganese were
below detectable limits in the three reservoirs. The mean ± SE concentration of Manganese
was 0.08 ± 0.08mg/L,0.09±0.06 mg/L and 0.11±0.06 mg/L in Gimbawa, Saminaka and Zaria
reservoirs respectively (Table 2).
The concentrations of Cadmium in the three reservoirs showed highest values of 0.22, 0.25
and 0.19 mg/L in Gimbawa, Saminaka and Zaria reservoirs respectively. The three
reservoirs had lowest concentrations of 0.06 mg/L during the study period. The mean ±
Standard Error for the reservoirs were 0.14± 0.01 mg/L, 0.16± 0.02 mg/L and 0.11± 0.02
mg/L for Gimbawa, Saminaka and Zaria reservoirs respectively (Table 2). These differences
were however not significant between reservoirs, months and seasons (P > 0.05).
Magnesium concentration in the three reservoirs showed a highest concentration of
4.7mg/L, 8.3mg/L and 5.1mg/L and lowest of 1.6, 0.9 and 0.8 for Gimbawa, Saminaka and
Zaria reservoirs respectively. The mean ± SE for the reservoirs were 7.70± 3.10 mg/L, 6.4±
1.93 mg/L and 5.6± 3.14 mg/L for Gimbawa, Saminaka and Zaria reservoirs respectively
(Table 2). These differences were however not significant between reservoirs and months (P
> 0.05) but significant between seasons (P < 0.05).
The highest Sodium concentrations observed were 14.5, 27.3 and 15.9 mg/L and lowest of
8.9, 6.4, and 6.8 mg/l in Gimbawa, Saminaka and Zaria reservoirs respectively. The mean ±
SE for the reservoirs were 12.19± 0.53 mg/L, 11.49± 1.75 mg/L and 9.84± 0.74 mg/L for
Gimbawa, Saminaka and Zaria reservoirs respectively (Table 2). These differences were
however not significant between reservoirs and months (P > 0.05) but significant between
seasons (P < 0.05), with significant interaction between reservoirs and seasons (P < 0.01).
Gimbawa, Saminaka and Zaria reservoirs had the highest concentration of Potassium of 8.5,
9.4 and 6 mg/L and lowest of 2.6, 2.4 and 2.8 mg/L respectively. The mean ± Standard Error
for the reservoirs were 4.80± 0.56 mg/L, 4.80± 0.53 mg/L and 4.2± 0.26 mg/L for Gimbawa,
Saminaka and Zaria reservoirs respectively (Table 2). These differences were however not
significant between reservoirs, months and seasons (P > 0.05).
The three reservoirs had the highest Iron concentrations of 1.14 mg/L (Gimbawa), 5.4 mg/L
(Saminaka) and 3.55mg/L (Zaria). The lowest concentrations of Iron were below detectable
limits in the three reservoirs. The mean ± Standard Error for the reservoirs were 0.28± 0.1
mg/L, 0.89± 0.43 mg/L and 0.51± 0.28 mg/L for Gimbawa, Saminaka and Zaria reservoirs
respectively (Table 2). These differences were however not significant between reservoirs,
months and seasons (P > 0.05).
4.2 Cyanobacteria
Gimbawa reservoir had its highest number of cyanobacteria cells/L in the month of
December (112) and lowest in the month June and August (0 cells/L). Saminaka reservoir
had its highest number in the month of March (292 cells/L) and lowest in the months of
June and January
(4cells/L). Zaria reservoir had its highest abundance in October (88cells/L) and lowest in
the month of May (32 cells/L) (Table 3).
Number of taxa (8), number of individuals (308), Shannon Index (1.59) and Simpson index
(0.76) was observed in Gimbawa reservoir during the dry season was higher than that
observed in the wet season (4, 152, 1.11 and 0.62 respectively). Dominance was higher in the
wet season (0.38) than dry season (0.24).
Effects of Domestic Waste Water on Water Quality of Three Reservoirs
Supplying Drinking Water in Kaduna State- Northern Nigeria
275
Reservoir May Jun Jul Aug Sep Oct Nov Dec Jan Feb Mar Apr Total
Gimbawa
16 0 28 0 68 12 60 112 12 40 40 44 432
Saminaka
24 12 40 32 60 40 48 52 4 68 292 220 892
Zaria
32 68 36 36 88 188 120 76 68 76 48 4 840
Table 3. Monthly Abundance (cells/L) of Cyanobacteria in Gimbawa, Saminaka and Zaria
reservoirs
In Saminaka reservoir the trend was similar, number of individuals (464), Shannon Index
(0.97) and Simpson index (0.56) observed during the dry season was higher than that
observed in the wet season (236, 0.81 and 0.41 respectively), dominance was higher in the
wet season (0.38) than dry season (0.24). The only exception was that the number of taxa
observed in both seasons was equal (5).
Diversity Index Gimbawa Saminaka Zaria
Wet Dry Wet Dry Wet Dry
Taxa_S
4 8 5 5 4 6
Individuals
152 308 236 464 448 392
Dominance_D
0.38 0.24 0.59 0.44 0.53 0.31
Shannon_H
1.11 1.59 0.81 0.97 0.88 1.38
Simpson_1-D
0.62 0.76 0.41 0.56 0.47 0.69
Table 4. Seasonal Diversity Indices of Cyanobacteria in Gimbawa, Saminaka and Zaria
reservoirs
In Zaria reservoir, the dry season a higher number of taxa (6), Shannon index (1.4) and
Simpson index ( 0.69) were observed than the wet season ( 4, 0.88 and 0.47 respectively).
While dominance (0.53) and number of individuals (448) observed in the wet season were
higher than that observed in the dry season (0.31 and 392 respectively) (Table 4).
4.3 Relationship between physico-chemical characteristics and phytoplankton
In Gimbawa reservoir significant positive correlation was observed between Mg and
Sacconema sp (r = 0.43) and Trichodesmium sp (r = 0.43) and between Fe and Arthrospira sp
(0.43) and Borzia sp (0.43) (Table 5). pH and Electrical Conductivity showed significant
positive correlation with Arthrospira sp (0.75 and 0.98 respectively); Borzia sp (0.75 and 0.98
Waste Water - Evaluation and Management
276
respectively) and Merismopedia sp (0.51 and 0.64 respectively); BOD with Merismopedia sp
(0.55) (Table 6).
In Saminaka reservoir, significant positive correlation was observed between Chromium with
Oscillatoria sp (r = 0.40); Nickel with Gleocystis sp (r = 0.63), Microcystis sp (0.67) and
Trichodesmium sp (0.45); Cadmium with Gleocystis sp (r = 0.82), Microcystis sp (0.88) and Iron
with Microcystis sp (0.66). Significant negative correlation was observed between Potassium
and Spirulina sp (-0.45); Sodium with Oscillatoria sp (-0.48) and Sacconema sp (-0.64); Chromium
with Merismopedia sp (-0.49) (Table 5). Microcystis sp was observed to show significant positive
correlation with DO (0.42), BOD (0.49), Alkalinity (0.64), NO
3
-N (0.45). It showed significant
negative correlation with Transparency (-0.40) and PO
4
-P (-0.54). Oscillatoria sp showed
significant positive correlation with Air Temperature (0.53), DO (0.50) and Alkalinity (0.50).
Spirulina sp showed significant positive correlation with BOD (0.52) (Table 6).
K Na Mg Cr Ni Cd Fe
Gimbawa
Arthrospira sp 0.13 -0.12 0.04 -0.13 0.07 0.36 0.43*
Borzia sp 0.13 -0.12 0.04 -0.13 0.07 0.36 0.43*
Merismopedia sp -0.09 0.11 -0.09 0.15 -0.06 0.1 0.24
Oscillatoria sp -0.35 0.23 -0.15 0.18 -0.3 -0.22 0.04
Sacconema sp 0.01 -0.12 0.43* 0.1 -0.08 0.12 -0.11
Spirulina sp 0.34 -0.18 -0.06 -0.39 0.14 0.26 0.17
Spondylosium sp -0.36 -0.3 -0.04 -0.3 0.29 0.25 -0.23
Trichodesmium sp 0.01 -0.12 0.43* 0.1 -0.08 0.12 -0.11
Saminaka
Gleocystis sp -0.19 0.02 0.08 0.24 0.63** 0.82** 0.76
Merismopedia sp 0.11 0.55* 0.33 -0.49* 0.07 0.04 0.12
Microcystis sp -0.24 -0.17 0.10 0.13 0.67** 0.88** 0.66**
Nostoc sp 0.12 0.26 0.02 -0.18 0.05 -0.05 -0.02
Oscillatoria sp -0.11 -0.48* -0.31 0.40* 0.19 -0.22 0.29
Rivularia sp -0.04 0.20 -0.18 -0.31 -0.27 -0.25 0.02
Saccconema sp 0.35 -0.64* 0.34 0.01 -0.32 -0.19 -0.21
Spirulina sp -0.45* -0.33 -0.08 -0.12 -0.31 -0.10 -0.26
Spondilosium sp 0.13 0.28 0.06 -0.01 0.28 0.30 -0.16
Trichodesmium sp 0.27 0.09 -0.04 -0.01 0.45* 0.08 -0.01
Zaria
Merismopedia sp
-0.38 -0.02 -0.14 -0.20 -0.18 -0.31 -0.16
Nostoc sp
0.12 0.26 0.02 -0.18 0.05 -0.05 -0.02
Oscillatoria sp
-0.11 -0.48** -0.31 0.40* 0.19 -0.22 0.29
Sacconema sp
-0.49* 0.03 -0.15 -0.18 0.05 -0.01 -0.21
Spirulina sp
-0.45* -0.33 -0.08 -0.12 -0.31 -0.10 -0.26
Spondilosium sp
0.13 0.28 0.06 -0.01 0.28 0.30 -0.16
Trichodesmium sp
0.27 0.09 -0.04 -0.01 0.45 0.08 -0.01
*Significant P < 0.05, ** Significant P < 0.05
Table 5. Correlation Coefficient (r) between Cyanobacteria and Metal Ion Concentration in
Gimbawa, Saminaka and Zaria reservoirs
Effects of Domestic Waste Water on Water Quality of Three Reservoirs
Supplying Drinking Water in Kaduna State- Northern Nigeria
277
In Zaria reservoir, Significant negative correlation was observed between Potassium and
Sacconema sp (r = -0.49), Spirulina sp (r = -0.45); Sodium with Oscillatoria sp (r = -0.48).
Chromium showed significant positive correlation with Oscillatoria sp (0.40) (Table 5).
Species
Air
Temp
Water
Temp
Transp pH EC DO BOD Alkalinity Hardness N0
3
-N P0
4
-P
Gimbawa
Arthrospira
sp
0.08 0.32 -0.26 0.75* 0.98** 0.25 0.25 0.27 -0.11 -0.04 0.22
Borzia
sp
0.08 0.32 -0.26 0.75* 0.98** 0.25 0.25 0.27 -0.11 -0.04 0.22
Merismopedia
sp
0.31 0.33 0.02 0.51* 0.64** 0.32 0.55** 0.04 0.00 -0.07 0.23
Saminaka
Microcystis
sp
0.13 0.08 -0.40* 0.37 0.34 0.42* 0.49* 0.64** 0.03 0.45* -0.54**
Oscillatoria
sp
0.53** 0.18 0.35 0.29 0.12 0.50** 0.27 0.50** -0.15 0.14 0.15
Spirulina
sp
0.14 0.39 -0.06 0.22 0.05 0.08 0.52** 0.28 -0.12 0.26 -0.01
Zaria
Nostoc
sp
-0.50** -0.80** 0.62** 0.36 -0.15 0.11 0.02 0.14 0.00 -0.01 -0.39
Spirulina
sp
0.14 0.24 -0.22 -0.29 -0.20 0.00 0.01 -0.15 -0.28 -0.09 0.48*
Spondilosium
sp
0.76** 0.23 -0.02 0.20 -0.06 0.59** 0.44* 0.45* -0.22 0.02 0.19
*Significant P < 0.05, **Significant P < 0.05
Table 6. Correlation Coefficient between Cyanobacteria and Physico-chemical Parameters in
Gimbawa, Saminaka and Zaria reservoirs
5. Discussion
The statistically significant monthly variation of mean Air Temperature in the three
reservoirs could be attributed to the low temperatures experienced between the months of
November and February as a result of the harmattan wind (Ezra and Nwankwo, 2001).
The significantly higher Transparency of the water in Gimbawa reservoir may be
attributed to the low human pressure in its catchment as it is location in the outskirts of a
major human settlement. Thus, receiving low amount of silt and nutrients that stimulate
algal and cyanobacterial growth. Silt and plankton abundance have been implicated in
Transparency fluctuations (Davies et al, 2009). The circum-neutral mean pH of water in
the reservoirs may be attributed to the relatively high alkalinity values of the reservoirs,
which is effective as a buffer to fluctuations of pH that might be caused by introduction of
waste water, photosynthesis and other metabolic processes. The wide fluctuations of EC
(SE in the range of 38.59 to 41.95) an significantly monthly variations in the three
Waste Water - Evaluation and Management
278
reservoirs may be attributed to concentration of Electrical Conducting ions due to
evaporation during the extensive (six) months of dry season. Similar results were
obtained by Chia and Bako (2008). DO concentration was found within the limit of 5-9
mg/l, drinking water (UNESCO/WHO/UNEP, 1996). The mean BOD values of Gimbawa
and Saminaka were slightly above the 2 mg/l. BOD above 2 mg/l is associated with waste
water contamination (UNESCO/WHO/UNEP, 1996). The mean hardness values (< 1.5
mg/l) may be due to the uptake of the ions (calcium and magnesium) responsible for
harness of water by aquatic organisms. Calcium and Magnesium are essential for aquatic
organisms such as algae, cyanobacteria, aquatic macrophytes as well as other reptiles. The
Mean NO
3
-N (1.2 and 1.3 mg/l in Gimbawa and Zaria reservoirs) and PO
4
-P (0.29 in
Gimbawa reservoir and 0.39 in Saminaka and Zaria reservoirs) were found to be above
expected concentration range of natural unpolluted waters of 0.1mg/l and 0.001mg/l
respectively, and are capable of stimulating cyanobacterial bloom
(UNESCO/WHO/UNEP, 1996).
Metal ions such as Manganese, Iron, Cadmium, Nickel, Chromium, Magnesium showed
concentrations higher than the maximum permissible limit for WHO (2006) and SON (2007),
other metals like Copper, Zinc, Sodium and Potassium were found to be below the
maximum permissible limit. The implication of high concentrations of metal ions in
drinking water include: Manganese causes neurological disorder and at concentrations
exceeding 0.1mg/L it causes undesirable taste in beverages, stains laundry and may lead to
the accumulation of deposit in water distribution system. Iron at levels above 0.3mg/L
stains laundry and plumbing fixtures (WHO, 2006). Cadmium is toxic to the kidney,
Chromium is carcinogenic, and Magnesium affects consumer acceptability of drinking water
(SON, 2007). Zinc imparts an undesirable astringent taste to water at threshold
concentration of 4mg/L, water containing Zinc at excess of 3-5mg/L may appear apalacent
and develop greasy film on boiling (WHO, 2006). With the exception of Magnesium, all the
others are heavy metals capable of accumulating in increasing concentration as they move
up the food chain (Chindah et al, 2004).
The dynamics of the concentration of these metals may be attributed to inflow of waste
water from residential areas (as they are components of many household products such as
pesticides, fungicides, paints, batteries and plumbing facilities), remobilization from
sediment due to fluctuations of pH, inflow of agro-chemicals such as fertilizers, pesticides
and herbicides from farms in the catchment of the reservoirs, chemicals from washing of
automobiles. Changes in pH affects the solubility of metal ions, lowering of pH may
remobilize insoluble metal complexes adsorbed on clay and silica in the sediments into the
water column, for example at pH 6.7, Zinc is available to form complexes with organic
matter while at pH > 7 Zinc begin to hydrolyze and form stable Zn(OH)
2
at pH 8. It is
important to note that there is a difference between the presence of a metal and its
bioavailability. A metal may be present in a form that is not available for utilization by algae
and other organisms (Kalis, 2006).
The variation in abundance of Cyanobacteria (Saminaka > Zaria > Gimbawa) in the
reservoirs during the study period may be attributed to the variation in N: P ratio
(Gimbawa, 0.41; Saminaka, 0.23 and Zaria, 0.33) of the water bodies. Lower N: P ratio
promotes cyanobacteria abundance (Tisser et al., 2008). They take advantage of their ability
Effects of Domestic Waste Water on Water Quality of Three Reservoirs
Supplying Drinking Water in Kaduna State- Northern Nigeria
279
to fix nitrogen into the aquatic environment, thus enabling them to out-compete other
divisions (Chorus and Batram, 1999). High phosphate concentration may result from
detergents from sewage, washing of cars, clothes and from fertilization of farms in the
catchment of the reservoirs (Reynolds, 1998). High abundance of Cyanobacteria in drinking
water may be a serious problem in drinking water as they produce toxins which are harmful
to fish, livestock, other aquatic organisms and ultimately man (WHO, 2006). The presence of
a bloom of species Microcystis, a toxin producing genus in the Saminaka reservoir is
worrisome.
The differences in number of taxa and number of individuals between seasons may be due
differences in temperatures and pH as different species obtain nutrition at different pH and
temperatures. Wilm and Dorris (1966) have suggested a relationship between species
diversity and pollution status of aquatic system and classified as follows; > 1 = Clean water,
1-3 = moderately-polluted < 1 = Heavily- polluted. Based on this classification, Gimbawa
reservoir was moderately polluted in both seasons, Saminaka reservoir heavily polluted in
both seasons while the Zaria reservoir was heavily polluted in the wet season and
moderately polluted in the dry season. A similar classification was also used by Shehata et.
al. (2009). Simpson index gives the evenness of species distribution; the higher evenness in
species distribution in the dry season may be an indication that the water quality was better
to support the growth of most of the species observed.
Significant positive correlation between cyanobacteria and metal ions may be an indication
of the possibility of using as indicators of the levels of these metals in a water body. These
metals are either essential (Fe, Cu, Zn, Na, Ca, Mn, Co and K) or beneficial (Ni and As) in
phytoplankton physiological processes (Paerles-Vela, et al., 2006). Significant negative
correlation between metal ions and cyanobacteria may be an indication of toxicity of these
metals at high concentrations level exceeding the requirement for nutrition or increased
utilization of metals in periods of high abundance. Some of the metals that show significant
negative correlation with cyanobacteria abundance are either essential (Fe, Cu, Zn, Na, Ca,
Mn, Co and K) or beneficial (Ni and As) in cyanobacteria physiological processes (Daffus,
2002). Significant negative correlation between metal ions and cyanobacteria may be an
indication of toxicity of these metals at high concentrations level exceeding the requirement
for nutrition or increased utilization of metals in periods of high abundance ((Paerles-Vela,
et al., 2006).
Significant positive correlation between cyanobacteria with pH and alkalinity may be due to
the fact that some essential elements are bioavailable at certain required pH, on the other
hand, the bioavailability of certain elements at toxic concentrations as affected by pH may
cause a significant negative correlation between pH and alkalinity with cyanobacterial
abundance. A significant positive correlation between nutrient (N and P) load and
cyanobacteria abundance may be due to the fact that increased nutrient concentrations leads
to a resultant increase in cyanobacteria abundance and a significant negative correlation
may due to the reason that increased cyanobacteria abundance may lead to increased
utilization of such nutrients by cyanobacteria (Rabalais, 2002). The significant relationship(s)
between cyanobacteria abundance and DO, BOD, EC, Hardness, Temperature and
Transparency is an indication of the inter-dependance between these important water
quality characteristics and the Biota (Shehata et al., 2009).
Waste Water - Evaluation and Management
280
6. Conclusion
The introduction of waste water into these reservoirs greatly impairs the water quality of
these reservoirs. The consequence is seen as the elevated concentration of heavy metals such
as Cadmium, Iron, Nickel and Chromium above WHO permissible limit in drinking water.
Waste water is also implicated in the increased nutrient (N and P) levels. These nutrients
were found to be below concentrations to cause any harm directly to consumers but
indirectly by their ability to stimulate cyanobacterial growth. Shannon-Weiner diversity
index showed that the water quality of the three reservoirs follows this order Gimbawa >
Zaria > Saminaka.
7. References
Adakole J.A, Balogun J.K. and Lawal, F.A. (2002). Water Quality Impacts Assessment
Associated with an Urban Stream in Zaria, Nigeria. NISEB Journal 2(3): 195-203.
Adegoroye, A. (2008). The Challenges of Environmental Enforcement in Africa: The
Nigerian Experience. Proceedings of the Third International Conference of Environmental
Enforcement , Pp 43 – 52.
Akin-Oriola, G.A. (2003). On the Phytoplankton of Awba reservoir, Ibadan, Nigeria. Revista
de Biol. 51: 1-15.
APHA (1998). Standard Methods for the Analysis of Water and Wastewater. American
Public Health Association, New York.1287pp.
Borgh, M.V. (2004).
http:// h20.enr.state.nc.us/esb/EU.html
Chia, A.M and Bako, S.P. (2008). Seasonal Variation of Cyanobacteria in Relation to
Physicochemical Parameters of some Fresh Water Ecosystems in the Nigerian
Guinea Savanna. Proceedings of Taal 2007: 12
th
World Lake Conference, Published by
Ministry of Environment and Forests, India and International Lake Environment
Committee Foundation (ILEC). Pp.1383-1387.
Chindah, A.C., Braide, A.S. and Sibendu, O.C. (2004). Distribution of Hydrocarbons and
Heavy Metals in Sediment and Cinstaceen (Shrimps-Pannens Notialis) from the
Bonny/New Calabar River Eastuary. A JEAM-RAGEE, 9:1-17.
Chorus, I. and Bartram, J. (1999). Toxic Cyanobacteria in Water: a Guide to Public Health
Consequence, Monitoring and Management. World Health Organization, London,
pp.15-40.
Daffus, J.H. (2002). “Heavy Metals” – A Meaningless Term? Pure Appl. Chem., 74(5):793-807.
Davies, O.A., Abowel, J.F.N. and Tawari, C.C. (2009). Phytoplankton Community of Elechi
Creek, Niger Delta Nigeria – A Nutrient-Polluted Tropical Creek. American Journal
of Applied Science 6(6):1143-1152.
Ezra, A.G. and Nwankwo (2001). Composition of Phytoplankton Algae in Gubi Reservoir,
Bauchi, Nigeria. Journal of Aquatic Science 16(2)115-118.
Fakayode, S.O. (2005). Impact Assessment of Industrial effluent on Water Quality of the
Receiving Alaro River in Ibadan, NIgeria, AJEAM-RAGEE: 10:1-13.
Haider, S., Naithani V., Viswanathan, P.N. and Kakkar P. (2003). Cyanobacterial Toxins: A
Growing Environmental Concern. Chemosphere, 52:1-21.
Effects of Domestic Waste Water on Water Quality of Three Reservoirs
Supplying Drinking Water in Kaduna State- Northern Nigeria
281
Kadiri, M.O. (2006). Phytoplankton Flora and Physicochemical attributes of some waters in
the Eastern Niger-Delta area of Nigeria. Nigerian Journal of Botany, 19(2): 188-200.
Kalis, E.J.J. (2006). Chemical speciation and bioavailability of heavy metals in soil and
surface water. Ph.D. thesis Wageningen University, Wageningen, the Netherlands.
Pp 142.
Kimura, H. (2005). The Japanese New Law for Preservation of Lake Water Quality. In Order
of Proceeding World Lake Conference, Nairobi, Kenya. Pp13.
Lenat, O.E., Smock, L.A. and Penrose, O.L.(1980). Use of Benthic macroinvertebrates as
indicators of environmental effect. Douglas L.W. (Ed) Pub. Lexington Books,
Toronto, 99.
Mur, L.R., Skurlberg, O.M. and Utkilen, H. (1999). Cyanobacteria in the Environment. In:
Sperling, E.V. and Gomes, L.N.L. (2008). Cyanotoxin Generation in Tropical Water
Supply reservoir. Proceedings of Taal 2007: 12
th
World Lake Conference, Published by
Ministry of Environment and Forests, India and International Lake Environment
Committee Foundation (ILEC. pp) 451-455.
Onrauwa, P.C and Fakayode, S.O. (2002). Heavy Metals Contamination of Soil and
Bioaccumulation in Annex Evacs (Panicun maxima) Around Ikaja Industrial Estate,
Lagos, Nigeria. Environmental Geology, 43:45-150.
Perales-Vela, H.V., Pena-Castro, J.M. and Canizares-Villanueva (2006). Heavy Metal
detoxification in eukaryotic microalgae. Chemosphere 64: 1-10.
Perry, R. ( 2003). A Guide to the marine plankton of southern California.
Prescott, G.W. (1977). The Fresh water Algae. WMC Brown Company Publishers Dubugue,
IOWA. P 12.
Rabalais, N.N. (2002). Nitrogen in Aquatic Ecosystems. BioOne, 31: 102-112.
Reynolds C.S (1998). What Factors Influence the Species Composition in Lakes of Different
Trophic Status? Hydrobiology, (369/370):11-26.
Shehata, S.A., Badr, S.A., Ali, G.H., Ghazy, M.M., Moawad, A.K., and Wahba, S.Z. (2009).
Assessment of Nile Water Quality via Phytoplankton changes and Toxicity
Bioassay Test. Journal of Applied Sciences, 5(12): 2083-2095.
SON (2007). Nigerian Standard for Drinking Water Quality. Published by the Standard
Organisation of Nigeria, Abuja, Nigeria. Pp 30.
Tiseer, F. A., Tanimu, Y. and Chia, A. M. (2008). Seasonal occurrence of algae and physico-
chemical parameters of Samaru stream, Zaria, Nigeria. Asian journal of Earth Science
1(1):31 – 37.
UNESCO, WHO,UNEP (1996).Water quality assessment- A guide to the use of biota,
sediments and water in environmental mornitoring. E and FN Spon. Cambridge, Great
Britain, 609 pp.
Wilm, J.L. and Dorris, T.C.(1966). Species Diversity of Benthic Macroinvertebrates.In: A
Stream Receiving Domestic and Oil Refinery Effluents. In: Islam, S.M.
Phytoplankton diversity index with reference to mucalinda serovar Bodh-Gaya.
Order of proceedings of Taal 2007: 12
th
World Lack Conference. Published by Ministry of
Environment and Forests, India and International Lake Environment Committee
Foundation (ILEC). pp 462-463.
Waste Water - Evaluation and Management
282
World Health Organisation(2006). Guidelines for drinking water Quality. (2ed) (addendum to
vol.1). Recomendations. WHO Press, Geneva Switzerland. Pp 595.
14
Water Quality of Streams Receiving
Municipal Waste Water in Port Harcourt,
Niger Delta, Nigeria
Alex C. Chindah
1
, Solomon A. Braide
1
, and Charles C. Obunwo
2
1
Institute of Pollution Studies
2
Chemistry Department
Rivers State University of Science and Technology, PMB 5080, Port Harcourt,
Nigeria
1. Introduction
The Niger Delta environment was relatively a pristine area some 100 years ago and consists
of several ecological zones mainly lowland forest, freshwater swamp forest, prominent in
the northern limit while the mangrove and barrier island zones dominate the southern
stretch (RPI, 1985, NDES, 2000 and NDDC, 2004). Settlements were of small population and
largely in pockets around these ecological zones. The people are agrarian and indulge
mostly in farming, fishing and exploitation of timber and non timber forest products. With
the relative small nature of the populations in the settlements their wastes generated and
discharged into the environment had little or no significant impact on the environment
(Onuoha, et. al., 1991).
With the absence of pipe borne water they depended on the stream system for the potable
water use, recreation, washing, bathing and fishing (Amadi et. al., 1997).
The advent of civilization has attracted human population to the major urban centres for
white collar jobs and more also the crude oil found in commercial quantity in the region has
accelerated the pace of development in terms of human population, urban growth,
industrial activities, infrastructural development, intensive farming and other economic
activities (NDDC,2004, Petrarova et. al., 2009, Onderka et. al., 2010).
The growth of human population and rapid industrialization led to increasing use of urban
waters as sewers, compromising their other uses. The discharge of industrial effluents has
led inevitably, to alterations in the quality and ecology of receiving water bodies (Sheikh,
and Irshad. 1980 and Wahid et. al., 1999). This results into new challenges to water resource
managers and aquatic ecologists. Several attempts have been made to regulate/control the
quality of effluents that are discharged from waste generating industries into the water
systems with little effort on urban discharges. Today, most urban areas of the developing
world remain inadequately served by sewage treatment infrastructure (NDDC,2004).
Untreated wastes pose serious threats to associated environment including human health
risks. Commonly cited effects of industrial effluents on the receiving waters are high
turbidity, reduced transparency, increased suspended solids and oxygen depletion (Rafiu et.
al., 2007 ). The area study covers over 94.72 km
2
with a population of about 1.9 million.