Waste Water Evaluation and Management Part 16 pot
Bạn đang xem bản rút gọn của tài liệu. Xem và tải ngay bản đầy đủ của tài liệu tại đây (1.55 MB, 30 trang )
Waste Water:Treatment Options andits Associated Benefits
439
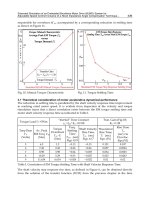
Fig. 2. 136L Capacity Metallic Prototype Biodigester
Experimental studies
The wastes were generally mixed with water in the ratio of 2:1 except in the cases where the
wastewaters were used alone as control. In such instances, the waste waters were used as
they were without further dilution since the constituents were mainly water (93-95%). The
digesters were charged up to ¾ level leaving ¼ head space for gas collection. They were
stirred thoroughly and on a daily basis throughout the retention period to ensure
homogenous blend of the wastes and dispersion of microbes in the entire mixture. Gas
production measured as dm
3
/kg slurry or L/Total mass of slurry were obtained by
downward displacement of water by the gas.
Analyses of wastes
Physicochemical properties of the wastes such as ash, moisture, crude fibre contents, crude
fat, crude nitrogen and protein contents, carbon, energy, total and volatile solids were
generally determined for all the wastes using recognized laboratory procedures. These
properties inherent in the wastes determine and explain the behavior of the wastes during
anaerobic digestion. Biochemical analyses such as pH, ambient and influent temperatures
were also monitored on the waste slurries as the digestion of the waste progressed.
Microbial analysis was also carried out to determine the microbial total viable counts (TVC)
for the waste slurries at different periods during the digestion; at the point of charging the
digester, at the point of flammability, at the peak of gas production and at the end of the
retention period. In some cases flammable gas composition from the different wastes were
also analyzed.
6. Results and discussion
The various results obtained during each of the studies are as itemized below:
1. Anaerobic batch co-digestion of cassava waste water and Swine dung
The cassava waste water alone had the highest yield of biogas production (130 dm
3
/Total
mass of slurry) even though the gas produced was not flammable throughout the retention
Waste Water - Evaluation and Management
440
period and therefore does not meet the desired need for cooking and lighting but would
however be okay for the purposes of ordinary treatment of the waste water. The non
flammability of the gas produced was attributed to the acidic nature of the waste. The
microbes that convert wastes to biogas are pH sensitive and survive optimally within the
pH range of 6.5-7.5 (Runion, 2009). It was observed that the fresh cassava waste water kills
plants in the farm. However when subjected to anaerobic digestion for a period of 30 days it
can then be used in the farms as a good organic fertilizer for agriculture. The CW and SD
(cassava waste water and swine dung blend) had a lower yield of 120L/total mass slurry;
however it commenced flammability on the 10
th
day. The swine alone had a yield of 123
L/Total mass slurry and commenced flammability on the 6
th
day. The results showed that the
animal waste had a positive effect on the cassava waste water since the CW on its own did not
produce flammable gas. There was also attendant reduction in the foul odour of the waste
after the digestion showing that the anaerobic digestion killed most of the pathogens
responsible for the foul odour. Fig 3 shows the daily biogas production for the period, while
Table 1 shows the lag period, cumulative and mean volume of gas productions. The lag period
is the period from charging of the digester to onset of gas flammability (Ofoefule et al., 2010).
Fig. 3. Daily biogas production
PARAMETERS CW SD CW : SD
Lag period (days). Nil 5 9
Cumulative gas yield (L/ total mass of slurry). 130.25 122.55 119.90
Mean gas yield (L/ total mass of slurry). 4.20±1.32 3.95±2.01 3.87±1.80
Table 1. Lag period, Cumulative and mean volume of gas production of the pure wastes and
blend
2. Effect of Abattoir cow liquor waste on biogas yield of some Agro-Industrial wastes.
The results in this study showed that the cow liquor waste and cassava waste water blend
(CLW: CW) did not flame throughout the retention period as a result of the acidic nature of
the combined waste (pH=3.3). The carbonated soft drink sludge that commenced flammable
biogas production on the 9
th
day stopped after one and half weeks as a result of the drop in
pH from 5.68 to 5.20. The reduction in pH killed the microbes responsible for converting the
Waste Water:Treatment Options andits Associated Benefits
441
waste to biogas. However the CLW: BS (cow liquor waste: brewery spent grain) had the
shortest onset of gas flammability and highest cumulative gas yield of 613.2 L/TMS (Table
2). Fig 4 shows the daily biogas production (Uzodinma and Ofoefule, 2008).
Parameters BS CS CW CLW : BS CLW: CW CLW: CS
Lag period (days) 20 8 Nil 6 9 8
Cumulative gas yield (L/TMS) 183.6 177.50 Nil 613.2 394.2 87.4
Mean Volume of gas yield
(L/TMS)
7.34 7.10 Nil 24.53 8.23 2.54
Table 2. Lag periods, cumulative and mean volume of gas yield for single organic wastes
and CLW blends
0
5
10
15
20
25
30
35
40
13579
11 13 15 17 19 21 23
25
Retention Time (Days)
Volume
of gas
production
(L/TMS)
BS
CS
CLW: BS
CLW: CW
CLW: CS
Fig. 4. Daily biogas yield
3. Preliminary studies on biogas production from blends of palm oil sludge with some
Agro-based wastes.
The palm oil sludge (POS) in this study could not produce quantifiable gas within the 25
days retention period used for the experiment. However when combined with brewery
spent grain (SG), carbonated soft drink sludge (SL) and cassava waste water (CW),
reasonable quantities of biogas were produced which flamed after some lag periods as
shown in Table 3. The POS: CW had the highest yield of biogas followed by the POS: SG
while the least yield came from the POS:SL. The better yield of POS: CW over the others
could be accounted for by the fact that the CW and others were allowed to be partially
decomposed for a period of two months to increase their pH level, since in their fresh state
they were found to be acidic. This resulted in the cassava waste water giving a better yield
of biogas. Analysis of their flammable gas composition showed that POS: CW and POS: SL
gave higher methane contents than POS: SG (Table 4). Fig. 5 shows the Daily biogas
production (Uzodinma et al., 2007a).
Parameters POS:SG POSL:CW POS:SL
Lag period (days) 10 8 15
Cumulative gas yield (L) 312 394.2 87.4
Mean volume of gas yield (L) 12.5 15.8 3.5
Table 3. lag periods, cumulative and mean volume of gas yield for POS blends
Waste Water - Evaluation and Management
442
Waste blends CO
2
CO H
2
S CH
4
POS:SG 25.3 5.0 2.5 67.2
POS:CW 20.9 1.6 1.3 76.2
POS:SL 20.1 1.2 2.2 76.5
Table 4. Analysis of flammable gas composition for POS blends (%)
0.0
5.0
10.0
15.0
20.0
25.0
135791113151719212325
Days
Volume
of biogas
yield
(L/TMS)
POS:SG
POS;CW
POS:SL
Fig. 5. Daily biogas yield for POS blends
4. Energy generation from microbial conversion of Treated cassava waste water from
garri processing industry.
In this study, cassava waste water (CW) was treated with some other wastes to improve its
pH level before digesting it. The waste used included; palm oil sludge (POS), powdered rice
husk (RH) and pig dung (PD). The results showed that not only was the pH increased, the
physicochemical properties also improved, which translated to higher biogas yields. The
CW: RH gave the highest yield while the CW: PD followed with the shortest lag period of 4
days (Table 5). The higher yield of CW: RH was attributed to the fact that the rice husk was
pre-decayed for about 1 month, and as a result had accumulated some microbes that aided
in the faster digestion. The shortest lag period of CW: PD was explained by the fact that
swine dung is a rumen animal, having the natural flora that are responsible for biogas
production in its gut, aiding the fastest onset of gas flammability. Fig. 6 shows the Daily
biogas production (Uzodinma et al., 2007b).
Parameters CW:POS CW:RH CW:PD
Lag period (Days 8 6 4
Cumulative volume of gas Production (L/TMS) 394.20 481.30 432.00
Mean volume of gas production (L/TMS) 15.77 19.30 17.30
Table 5. Lag Period, Cumulative and Mean volume of biogas production
Waste Water:Treatment Options andits Associated Benefits
443
Fig. 6. Daily biogas production
Socio-Economic Benefits of Waste Water Treatment
Apart from reduction in environmental pollution from the treatment of waste waters, new
demands for agricultural products arising from increased biomass usage would impact on
the social-economic life of the populace especially when anaerobic digestion process of
waste water treatment option is undertaken. Social issues such as employment generation,
and poverty reduction especially for the developing countries would be addressed through
this technology as a result of expanded economic activities across the real sector of the
economy encompassing agriculture, manufacturing and exports. These would enhance
people’s ability to develop economic activities designated to reduce poverty particularly for
the rural communities. Conversion of these biodegradable waste waters (both domestic and
industrial) into biogas would result in cleaner air as well as efficient waste management
system, improving the sanitary conditions of the urban environment. This will lead to socio-
economic benefits with regard to health, income and security of the eco-system threatened
by adverse climatic alterations (Ofoefule et al., 2009).
5. Conclusion
The results of these studies have shown that the waste waters/ slurries which are pollutants
in the areas where they are processed can be sources of useful energy and organic fertilizers
by subjecting them to anaerobic digestion for biogas production. The studies further
revealed that most of these waste waters on their own are not capable of effective and
efficient biogas production since they are mostly found to be acidic in their fresh states.
They therefore need to be co-digested with other better producing wastes like animal wastes
to enhance their flammable biogas production capabilities. The anaerobic digestion process
of these waste waters is expected to be a source of waste management and pollution control.
6. References
Allison- Onyechere L.N., U. Ngodi and M.N. Ezike 2007. Anaerobic biotechnology for
sustainable waste treatment. A review. J. Res. Bioscience. 3(1): 40-43.
Amuda, O.S and Ibrahim A.O .2006. Industrial waste water system using natural material as
adsorbent.Africa Journal of Biotech Vol. (16), pp.1487-1487.
Waste Water - Evaluation and Management
444
Anon, 1980. Survival of enteroviruses in rapid-infiltration basins during the land application
of wastewater, Annl. Environ. Microbiol. 40:192-200, 1980.
Anon, 1995. "Environmental Estrogens: Consequences to Human Health and Wildlife". IEH
assessment. Medical Research Council, Institute for Environment and Health.
Anon. 2005. “Environmental Hazards of the Textile Industry,” Environmental Update #24,
published by the Hazardous Substance Research Centers/ South & Southwest
Outreach Program, June 2006; Business Week, June 5, 2005.
Anon. 2010. File:///D:/waste%20water/water%20 treatment%20method.htm, Buzzle.com,
intelligent-life on web.
Avnimelech Y., Diab, S. and Kochba, M. 1993. Development and evaluation o a biofilter for
turbid and nitrogen rich irrigation water. Wat. Res. 27: 785-790.
Bansode, R.R,Losso J.N, Marshall W.E, Rao, R.M and Portier R.J 2004. Pecan shell-based
granulated activated carbon for treatment of chemical oxygen demand (COD), in
municipal wastewater. Bioresource Technol. 94: 129-135.
Bhat, P.R., Chanakya, H.N. and Ravindranath, N.H., 2001. Biogas plant dissemination. J.
Energy Sustainable Dev. 1: 39 – 41.
Chynoweth, D.P and Owens. M 1991. Biochemical methane potential of municipal solid
waste components. Water Science Technology, 27:1-14.
Galambos II, Molina, J.M, Jaray, P., Vatai, G, Bekassy-Molner E. 2004. High organic content
industrial wastewater treatment by membrane filtration. Desalination, 162:117-120.
Lettinga, G., Van Velsen, A.F.M., Hobme, W. de Zeeuw, J. and klapwijk, A. 1980. Use of the
upflow sludge blanket (USB) reactor concept for biological waste water treatment
especially for anaerobic treatment. Biotech and bioeng. 22:699-734.
Mara, D. and Horan, N., 2003. Water and Wastewater Microbiology, Academic Press.
Mehmet F.S and Hassan Z.S. 2002. Ozone treatment for textile effect and dyes: effect of
applied ozone dose, pH and dye concentration. Journal of Chemical technology
and Biotechnology, 77: 842-850.
Naik, A. 2010. Wastewater Treatment Methods. Accessed from
9
th
of July 2010.
Namboodri C.G, Perkins W.S and Walsh, W.K. 1994. Decolonizing dyes with chlorine and
ozone: Part II, American dyestuff Report, 83: 17-26.
Nasim, A.K, Shaliza,I and Piarapakaran,S. 2004. Elimination of heavy metals from
wastewater using agricultural wastes as adsorbents. Malaysian Journal of Science,
23:43-51.
Nomanbhay, S.M, Palanisamy, K. 2005. Removal of heavy metals from industrial
wastewater using chitosen coated oil palm shell charcoal. Electronic Journal of
Biotechnology, 8:43-53.
Oboh, G. 2005. Isolation and characterization of amylase from fermented cassava (Manihot
esculenta Crantz) waste water. African journal of biotechnology. Vol 4 (10), pp
1117-1123. ISSN 1684-5315.
Ofoefule, A.U., Chima, P.U., Nnabuchi, M.N. and Uzodinma, E.O. 2010. Anaerobic batch co-
digestion of cassava waste water and Swine dung. Nig. J. Solar Energy 20:128 – 132
Waste Water:Treatment Options andits Associated Benefits
445
Ofoefule, A.U., Ibeto C.N., Uzoma, C.C., Oparaku, O.U. 2009. Biomass Technology: A key
driver for improving climate change and socio-economic life in Nigeria. Int. J.
Environ. Sci. 5 (1): 54- 58.
Okafor N. 1998. An integrated bio-system for the disposal of cassava wastes. Proceedings of
the internet conference on integrated bio-systems, edited by Eng-Leong, F and
Tarcisio, D.S. Pp.1-5.
Okieimen, F.E, Ogbeifun, D.E, Navala,G.N, Kumash, C.A. 1985. Binding of copper,
Cadmum and Lead by modified cellulosic materials. Bull., Environ. Contam.
Toxicol.34: 860-870.
Oparaku, N.F, Mgbenka, B.O and Ibeto, C.N. 2011. Wastewater disinfection utilizing
ultraviolet light. Journal of Environmental Science and Technology,4(1):73-78.
DOI:10.3923/jest.2011.73.78.
Peres, J.A, Beltran de Heredia, J, Dominguez, J.R. 2004. Integrated Fenton’s reagent-
coagulation/flocculation process for treatment of cork processing wastewaters. J.
.Haz. Mat. 107 (3):115-121.
Preetha, B., Viruthagiri, T. 2005. Biosorption of Zinc (II) By Rhizopus equilibrium and kinetic
modeling. African J.Biotechnol. 4(6): 506-508.
Rajeswari, K.R. 2000. Ozonation treatment of textile dyes wastewater using plasma ozonizer,
PhD thesis, University of Malaysia, Malaysia.
Runion R. 2009. All about Waste water treatment.
Runion R. 2010. Wastewater - Contamination Sources.
Stanislaw L. and Monica G. 1999. Optimization of oxidant dose for combined chemical and
biological treatment of textile waste water. Water Research 33, 2511-2516.
Tam,M and Antal M. 1999. Preparation of activated carbons from macademia nut shell and
coconut shell by air activation. Ind.Eng.Chem Research, 38:4268-4276.
Uzodinma E.O. and Ofoefule, A.U. 2008. Effect of abattoir cow liquor waste on biogas yield
of some Agro-industrial wastes. Sci. Res & Essay 3 (10): 473-476.
Uzodinma E.O. Eze, J.I. and Onwuka, N.D. 2007b. Energy generation from microbial
conversion of treated cassava (manifot utilissima) waste water from garri
processing industry. J. Res in Bio Sci 3(1):61-66.
Uzodinma E.O., Ofoefule, A.U., Eze, J.I. and Onwuka, N.D. 2007a. Preliminary studies from
blends of palm oil sludge with some Agro-based wastes. Nig. J. Solar. Energy 18:
116-120.
Van Haandel, A.C. and Lettinga, G. 1994. Anaerobic sewage treatment. A practical guide for
regions with a hot climate. John Wiley and Sons, Ltd. Chichester ISBN 0-471-95121-
8.
Verstraete, W. deBeer, D., Pena, M., Lettinga, G. and ens, P. 1996. Anaerobic bioprocessing
of organic waste. Accepted for Publication in World J. Microbio and Biotech.
Verstraete, W. and Top, E. 1992. Holistic environmental technology. In: Microbial control of
pollution. CJ. Fry, G. Gadd, R. Herbert and I. Watson-Crack eds), Cambridge Univ.
Press.pp 1-18.
Wolfgang, M. and Axel, H. 2005. An introduction to anaerobic digestion. Seminar presented
at the Biowaste. Digesting the alternative seminar UK.
Waste Water - Evaluation and Management
446
Xuejun.C, Zhein,S, Xiaolong,Z Yaobo, F and Wenhua,W. 2005. Advanced treatments of
textile wastewater for re-use using electrochemical oxidation and membrane
filtration. Water SA,Vol. 3(1):127-132.
23
Agricultural Dairy Wastewaters
Owen Fenton, Mark G. Healy, Raymond B. Brennan, Ana Joao Serrenho,
Stan T.J. Lalor, Daire O hUallacháin and Karl G. Richards
Teagasc, Environmental Research Centre, Wexford
National University of Ireland, Galway
Rep. of Ireland
1. Introduction
In Ireland, farming is an important national industry that involves approximately 270,000
people, 6.191 million cattle, 4.257 million sheep, 1.678 million pigs and 10.7 million poultry
(CSO, 2006). Agriculture utilizes 64% of Ireland’s land area (Fingleton and Cushion, 1999),
of which 91% is devoted to grass, silage and hay, and rough grazing (DAFF, 2003). Grass-
based rearing of cattle and sheep dominates the industry (EPA, 2004). Livestock production
is associated with external inputs of nutrients. Phosphorus (P) surpluses accumulate in the
soil (Culleton et al., 2000) and contribute to P loss to surface and groundwater (Tunney,
1990; Regan et al., 2010). Elevated soil P status has been identified as one of the dominant P
pressures in Ireland (Tunney et al., 2000). Schulte et al. (2010) showed that it may take many
years for elevated soil P concentrations to be reduced to agronomically and environmentally
optimum levels. The extent of these delays was predominantly related to the relative annual
P-balance (P balance relative to total P reserves). While the onset of reductions in excessive
soil P levels may be observed within five years, this reduction is a slow process and may
take years to decades to be completed.
Agricultural wastes and in particular dairy slurry and dirty water are discussed in this
chapter. However, while the term ‘waste’ is commonly used for these materials, it is an
unfortunate label, as it suggests that the materials have no further use and are merely a
nuisance by-product of farming systems that must be managed. However, given the high
nutrient contents of these materials, it is far more appropriate for them to be considered as
organic fertilizers, and as such being a valuable commodity for the farmer. With higher and
more volatile chemical fertilizer prices in recent years, the fertilizer replacement value in
economic terms of these materials is increasing. Therefore, the management of agricultural
‘wastes’ in a manner that maximises the nutrient recovery and fertilizer value to crops
should be a priority within any management plan for these materials.
Nutrient contents and various research areas regarding management, remediation and
control of such nutrients to prevent losses to the environment are discussed. The Surface
Water Directive, 75/440/EEC (EEC, 1975), the Groundwater Directive, 80/68/EEC (EEC,
1980), the Drinking Water Directive, 98/83/EC (EC, 1998), the Nitrates Directive,
91/676/EEC (EEC, 1991(a)) and the Urban Wastewater Directive, 91/271/EEC (EEC,
1991(b)), combined with recent proceedings taken against the Irish State by the EU
Commission alleging non-implementation of some aspects of the directives, has focused
Waste Water - Evaluation and Management
448
considerable attention on the environmentally-safe disposal of agricultural wastewaters in
Ireland. To address these directives, the WFD (2000/60/EC, 2000) came into force on 22
nd
December, 2000 and was transposed into Irish legislation by the European Communities
(Water Policy) Regulations 2003 on the 22
nd
December, 2003. Eight “River Basin Districts”
(RBD) were established in Ireland, north and south, with the aim of achieving “good status”
in all surface and groundwater by 2015. The WFD will bring about major changes in the
regulation and management of Europe's water resources. Major changes include:
• A requirement for the preparation of integrated catchment management plans, with
remits extending over point and non-point pollution, water abstraction and land use;
• The introduction of an EU-wide target of "good ecological status" for all surface and
groundwater, except where exemptions for "heavily-modified" water bodies are
granted. Programmes of measures (POM) must be put in place to protect groundwater
and surface water while being efficient and cost-effective. POM to achieve at least
“good ecological status” must be implemented by the agricultural sector by 2012. In
Ireland the Nitrates Directive is the main POM in place. At present, a strategy exists
within Europe to restore the “good ecological status” of surface and groundwater. It
focuses on reducing nutrient pressures to prevent further nutrient loss to surface and
groundwater. However, intensification of agriculture poses a challenge to the
sustainable management of soils, water resources, and biodiversity. N losses from
agricultural areas can contribute to ground- and surface water pollution (Stark and
Richards, 2008; Humphreys et al., 2008).
Results from a Water4all project suggest that regulation alone will not achieve sufficient
reduction in water quality as nitrate builds up in soils and the long residence time of
groundwater in aquifers needs a more immediate solution (Water4all, 2005; Hiscock et al.,
2007). Therefore, remediation (nitrogen - N) and control (phosphorus – P) technologies must
be an integral part of the process for point and diffuse pollution from historic or future
incidental nutrient losses. Solutions developed must be integrated efforts within a
catchment or river basin.
Good Agricultural Practice Regulations under The Nitrates Directive (European Council,
1991) is currently the main mitigation measure in place within the agricultural sector to
achieve the goals of the WFD. These regulations came into effect in the Republic of Ireland
in 2006 under Statutory Instrument (S.I) 788 of 2005, and subsequently under S.I 378 of 2006,
S.I 101 of 2009 and S.I 610 of 2010. The Nitrates Directive sets limits on stocking rates on
farms in terms of the quantity of N from livestock manure that can be applied mechanically
or directly deposited by grazing livestock on agricultural land. A limit of 170 kg N ha
-1
year
-
1
from livestock manure was set. However, the EU Nitrates Committee approved Ireland’s
application for a derogation of this limit to allow grassland-based (mostly dairy) farmers to
operate at up to 250 kg N ha
-1
year
-1
from livestock manures, with the understanding that
this derogation will not impinge on meeting the requirements of the Nitrates Directive. The
current average stocking density on dairy farms is 1.81 livestock units (LU) ha
-1
.
The “Good Agricultural Practice for the Protection of Waters” regulation, S.I 778 of 2005
(Anon, 2005), came into effect on February 1
st
2006. The most recent revision of the
regulation was published in 2010 (Anon, 2010). It constrains the use of P and N fertilizers,
ploughing periods and supports derogation on livestock intensity. In particular it regulates
farmyard and nutrient management, but also examines prevention of water pollution from
fertilizers and certain activities. The linkage between source and pathway can be broken if
pollutants remain within farm boundaries and are not discharging to drainage channels,
Agricultural Dairy Wastewaters
449
subsurface drainage systems, or entering streams or open waterways within farm
boundaries. These regulations also place restrictions on land spreading of agricultural
wastes. This strategy looks at present loss and future loss prevention. There are no
guidelines in place for the remediation or control of contaminated discharges to surface
and/or groundwater or future discharges due to incidental losses. Traditionally,
agricultural wastes are managed by land spreading. Following land spreading, the recharge
rate, the time of year of application, the hydraulic conductivity of the soil, the depth of soil
to the water table and/or bedrock, and the concentration of nutrients and suspended
sediment in the wastewater (dirty water and any discharge containing nutrients) are some
of the defining parameters that determine nitrate movement through the soil to the
watertable. The maximum instantaneous rate of application is 5 mm per hour and the
quantity applied should not exceed 50 m
3
per hectare per application (ADAS, 1985; 1994;
DAFF, 1996) and these recommendations are present within best farm management
practices. Infiltration depth of irrigated water and rainfall may be estimated when the
annual effective drainage, number of effective drainage days, effective porosity, annual
precipitation, and the hydraulic load of the irrigator are known (Fenton et al., 2009(b)). This
data may then be combined with watertable data to examine if excess nutrients recharge to
groundwater within a specific time frame.
2. Agricultural dairy wastes
2.1 Types of dairy wastes and nutrient content
In a grassland system, the N recovery rate of dairy slurry is highly variable due to variations
in slurry composition, application methods, spreading rates, soil and climatic conditions
and slurry N mineralisation rates (Schröder, 2005). In Ireland, approximately 80% of
manures produced in winter are managed as slurries containing 70 g kg
-1
dry matter, 3.6 g
kg
-1
total N (TN) and 0.6 g kg
-1
total P (TP) (Lalor et al., 2010(a)). About 50% of the TN is in
ammoniacal form and has the potential to be volatilised as ammonia during storage and
following land spreading. Estimated organic managed waste generation for Ireland is
presented in Table 1.
Waste Category Waste Generation
Tonnes wet weight %
Cattle manure and slurry 36,443,603 60.6
Water (dairy only) 18,377,550 30.5
Pig slurry 2,431,819 4.0
Silage effluent 1,139,231 1.9
Poultry litter 172,435 0.3
Sheep manure 1,336,336 2.2
Spent mushroom compost 274,050 0.5
Total 60,170,025
Table 1. Estimated agricultural organic managed waste generation in 2001 (EPA, 2004a).
Great variation in the nutrient content of dairy slurry exists depending on feed type, age of
sample when tested, age of the animal and how the effluent is stored and managed (Smith
and Chambers, 1993). Seasonal differences in nutrient contents also exist (Demanet et al.,
1999). Tables of published slurry nutrient contents in Europe exist (see MAFF, 2000). Such
Waste Water - Evaluation and Management
450
values are similar to South American dairy slurry concentrations found by Salazar et al.
(2007). Some dairy slurry concentrations for undigested and digested samples are presented
in Table 2. These tend to be similar to other nutrient contents across Europe found by Villar
et al. (1979); Scotford et al. (1998(ab)) and Provolo and Martínez-Suller (2007). In Ireland,
dirty water is generated from dairy parlour water and machine washings, precipitation and
water from concreted holding yards (Photo 1). Average dirty water production per cow is 49
L
-1
day
-1
. Although dilute, dirty water has sufficient nutrients to give rise to eutrophication if
lost to a waterbody through runoff or excess infiltration. Implementation of current
legislation requires separation of faecal matter and water, thus diminishing the nutrient
content of dirty water for land application (Photo 1). As the nutrient content is reduced and
storage and water charges are high, an alternative solution to dirty water management is
remediation and re-use for washing yards (Fenton et al., 2009). A number of papers have
reported the chemical composition of dirty water from dairy farms (ADAS, 1994; Cumby,
1999; Ryan, 2006; Fenton et al., 2009(a);Minogue et al., 2010). Table 3 presents a range of
nutrient contents available in dirty water from a number of studies. Minogue et al. (2010)
and Cumby (1999) report higher mean TN nutrient figures for 20 farms in England and
Wales of 580±487 mg TN L
-1
. Martínez-Suller et al. (2010(b)) reviewed the composition of
dirty water in the literature including others not mentioned in Table 3.
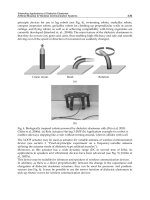
Photo 1. Dirty water generation: wash down high volume low pressure hose and drainage
channel for speeding up washing after milking (Source: www.teagasc.ie)
Prediction of the nutrient content of agricultural waste waters would help farmers to more
accurately calculate the nutrient fertiliser replacement value of the landspread materials and
the additional fertiliser requirements for their crops. Martínez-Suller et al. (2010(a)) suggest
that dry matter content or electrical conductivity are rapid, cheap methods to estimate the
nutrient content of waste waters and manures.
2.2 Faecal microorganisms
Agricultural wastes not only pose a threat to waterbodies, a second major concern is the
presence of pathogenic and/or antibiotic resistant bacteria in animal wastes (Sapkota et al.,
2007) and the threat to human health. If properly handled and treated, manure is an
effective and safe fertiliser. However, if untreated or improperly treated, manure may
become a source of pathogens that may contaminate soil, food-stuffs, and water bodies
(Vanotti et al., 2007). Animal manures are known to contain pathogenic bacteria, viruses and
parasites (Pell, 1997). The contamination of surface waters with pathogenic micro-organisms
transported from fields to which livestock slurries and manure have been applied is a
serious environmental concern as it may lead to humans being exposed to such micro-
organisms via drinking water (Skerrett and Holland, 2000); bathing waters (Baudart et al.,
2000); and water used for the irrigation of ready to eat foods (Tyrel, 1999). A recent study
Agricultural Dairy Wastewaters
451
e
ru
naM
y
du
t
S
Type
hN de
t
s
e
gidnU /
de
t
seg
i
D
4
-N Organic N NO
3
-N TN TP
L gm
-1
mg L
-1
mg L
-1
mg L
-1
mg L
-1
303 0121 1< 409 603 d
et
s
egidn
U
y
r
i
a
D 1002
,e
ik
l
i
W
d
n
a
y
r
b
luM
042 1732 1< 157 0261 )A
SU ,dnaly
ra
M
(
dets
e
g
i
D
7.42 522 1< 74 871 )AS
U
,adirolF
(
de
ts
e
g
iD
02 ot 1 - - - 08 ot 5 dets
e
g
i
D
y
r
iaD 2002 ,.la
te orraziP
7.942 6543 2322
)
atosenniM( dets
e
g
iD
yriaD 9002 ,.l
a
te g
n
aW
662
50
33
2
871
)a
tos
e
n
ni
M
(
d
e
ts
e
gi
d
nU yriaD
Kebede-Westhead et al.,
2004
Dairy Digested manure effluent (Florida, USA) 233 <1 412 64.5
Brennan et al., 2010(abc) Dairy Undigested (West Ireland) May 1759(123) 4433 (271) 1138 (76)
)39( 4411 )524(1684 yluJ
)dnal
erI
tseW(
d
etsegid
n
U yriaD
)7
3(
118 )47
2
(289
3 rebm
e
ceD )d
nal
erI tse
W(
detseg
id
n
U
y
r
i
aD
Martínez -Suller et al., 2010 Dairy Undigested (South East Ireland) 3430(1400) 560(250)
n
o
it
a
i
v
ed
dr
adnat
s
)(
Table 2. Dairy slurry nutrient content from various studies.
Waste Water - Evaluation and Management
452
Study Number of farms Period of study
BOD
5
K NH
4
-N P TP TN
Minogue et al., 2010 60-Ireland Monthly for 1 year
Mean 2246 568 212 37 80 587
Min 0 3 0 0 2 0
Max 19085 7232 2933 1240 795 6030
SD 2112 513 206 53 68 536
Martínez-Suller et al.,
2010(b)
1-Ireland 13 weeks (January – May)
Mean 3084 415 32 8.5 44 351
Min 1570 213 0 0.7 21 128
Max 8400 977 106 24.9 103 987
SD 1739 169 25 6.49 22 231
Serrenho et al., 2010 1-Ireland
Fenton et al., 2009(a) 1-Ireland 3 months (August - October)
Mean - - - 14.0(9.2) 20.1 (6.9) 170(33.2)
5002 ,.la te hgniS
3000 111 479
Dunne et al., 2005(ab) 1-Ireland Winter
2828 42
gnirpS
2703 53
remmuS
2682 36
nmutuA
2303 6
Ryan et al., 2005 1-Ireland
Min - - - - - 43
Max - - - - - 126
Rodgers et al., 2003 1-Ireland
2208
0
00
2
,.
l
a
t
e nonn
aC
1440
Cumby et al., 1999 20- England and Wales Summer
9670 150 58 - 49 95
nm
u
t
uA
7450 85 48 - 34 70
Richards, 1999 1-Ireland
84.4 188
Misselbrook et al., 1995 1-England
350 42 <100 450
Ryan, 1991 1-Ireland
2077 210 92 17 23 159
Table 3. Dairy dirty water nutrient results from various studies in U.K. and Ireland.
Based on new data and Martínez-Suller et al., 2010(b). All units in mg L
-1
Agricultural Dairy Wastewaters
453
(Venglovsky et al., 2009) has shown that animal manure contributes significantly to
pathogen loading of soil and consequently runoff to waterways. Furthermore, a recent
report by the EPA in Ireland (Lucey, 2009) highlighted land-spreading of manure or slurry
as one of the main sources of microbial pathogens in groundwater. Additionally, a report by
the Food Safety Authority of Ireland (FSAI, 2008) stated that ‘there is potential for the
transfer of pathogens to food and water as a result of land-spreading of organic agricultural
material’.
Research from New Zealand, shows that dirty water contains faecal micro-organisms, which
originate from dairy cattle excreta. Researchers such as Aislabie et al. (2001); McLeod et al.
(2003) and Donnison and Ross (2003) have shown transfer of bacterial indicators, faecal
coliforms and Campylobacter jejuni through soil. The Pathogen Transmission Routes Research
Programme in New Zealand showed that significant faeces contamination arose through the
deposition of faeces by grazing animals with access to waterways. Fencing and
implementation of buffer strips were recommended as mitigation measures to prevent such
losses (Collins et al., 2007). Presence of faecal indicator organisms is used to identify waters
impacted by faecal matter from mammals. Indicators of faecal contamination such as E. coli
are widely used as they are faecally specific and believed to not survive for more than 4
months post excretion (Jamieson et al., 2002). Recent research has shown that E. coli can
survive for long periods of time in temperate soils (Brennan et al., 2010) and contribute to
high detections in drainage waters from agricultural soils. E. coli were particularly
associated with poorly drained soils due to the greater persistence of preferential flow
channels and anaerobic micro-sites where they might survive. Thus the presence of E. coli in
waters may not indicate recent contamination by faecal matter but could be due to historical
pathogen deposition. Many treatment systems may be used to treat livestock waste and
remove or decrease viral, bacterial and eukaryotic pathogens. Examples include bio-gas
producing anaerobic digestion, composting, aeration, storage under a variety of redox
conditions, and anoxic lagoons, all of which have been reviewed by Topp et al. (2009).
2.3 Current management practices for agricultural waste waters
The Nitrates Directive and rising costs are now forcing better use of nutrients in slurry.
Research in the U.K. (Misselbrook et al., 1996; 2002; Smith and Chambers, 1993; Smith et al.,
2000) includes improving N recovery from slurry by examining the effect of spreading
method and timing, and reducing ammonia (NH
3
) losses from slurry by evaluating splash-
plate versus alternative techniques such as trailing shoe or trailing hose slurry application
methods. The average abatement of these methods varies and differs when grassland or
arable application are considered (Smith and Misselbrook, 2000; Misselbrook et al., 2002).
Present research in Ireland follows similar patterns (Ryan, 2005). Ammonia emissions with
respect to trailing shoe versus splash-plate and subsequent N uptake by the sward are being
investigated in Irish grasslands (Lalor and Schulte, 2008). Farm management strategies
aimed at prevention of nutrient loss to water have recently been reviewed by Schulte (2006).
The Nitrates Directive regulations impose limits to N and P inputs onto livestock and tillage
farms. Cattle and dairy farming systems are required to make more efficient use of
nutrients. International experience suggests that significant gains in nutrient efficiency can
be made by increasing the utilisation of N in slurry. Lalor (2010(b)) suggested N-utilisation
efficiencies from slurry as low as 5% under existing practices, whereas international
literature suggests that there is scope to raise efficiencies to 40-80%. Despite the relatively
low utilisation in practice, the Nitrates regulations set a nitrogen fertilizer replacement value
Waste Water - Evaluation and Management
454
(NFRV) target of 40%, presenting a considerable challenge for the grassland sector. In
addition, the ceiling to nutrient inputs imposed under the Nitrates Directives made it
difficult for many livestock farmers to continue to accept pig slurry as a fertilizer onto their
farm. In Ireland, as a result, the potential for the traditional practice of spreading slurry on
grasslands has been reduced significantly. Returning pig slurry to arable land allows a more
closed nutrient cycle to operate, since cereal grains constitute a significant proportion of the
diet of pigs. However, this creates a major logistic challenge where arable land and pig
farms are not closely located (Lalor et al., 2010(b)).
In an Irish study, cattle slurry application on grassland shows that the NFRV in the year of
application is affected by application method and timing. Cattle slurry applied (using
traditional methods) with splashplate had an NFRV of 21% in April and 12 % in June.
Application using trailing shoe (a modern alternative which places slurry in thin bands
along the soil surface) increased the NFRV to 30% in April and 22% in June. Changing
application timing from summer to spring with existing splashplate machinery is the most
cost effective strategy for improving NFRV. Approximately 4% of the total slurry N applied
was recovered in the second year after application. For repeated applications over a number
of years, models indicate that the maximum cumulative residual recovery would be 12-14%
of the annual slurry N application rate. It would take approximately 10 years of repeated
slurry applications for the residual N release to reach this maximum level (Lalor et al.,
2010(b)). In Ireland, research by Lalor et al. (2010(b)) showed that the NFRV target of 40%
set in the Nitrates regulations can only be achieved when the residual N release is included,
and when best practice strategy of trailing shoe application in April was adopted. Spring
application of slurry is often restricted by soil trafficability, particularly on poorly drained
soils. The trailing shoe application method can provide more flexibility for spring
application as grass contamination is reduced compared to splashplate.
In Ireland, besides land application methods (splashplate or trailing shoe (Photo 3)), dirty
water irrigation using centre pivotal irrigation systems is common (Photo 2). The
recommended irrigation rates should not exceed 5 mm hr
-1
. Strict guidelines for their safe
use are in place. Application timing of dirty water should take soil moisture status and soil
physical properties into account (Houlbrooke et al., 2004). Two pond systems are used in
many countries reducing the biological oxygen demand and suspended solids contents. A
limitation here is that the nutrients remain unchanged and need to be landspread with
potential environmental consequences. An upgraded “advanced pond system” has been
Photo 2. Rotational centre pivot sprinkler system used for dairy dirty water irrigation
(Source: www.teagasc.ie)
Agricultural Dairy Wastewaters
455
Photo 3. Slurry tanker with trailing shoe application system (Source: Teagasc)
designed by Craggs et al. (2004) and could be an alternative on dairy farms. Houlbrooke et
al. (2006) showed that individual irrigation systems with low intermittent irrigation rates
(0.4 to 4 mm hr
-1
) could be used without nutrient losses. To facilitate this low irrigation rate,
increased storage is needed on a farm. Adapted low irrigation lines have now also been
investigated, the position of which may be changed through use of a quad-bike system.
Bolan and Swain (2004) reviewed issues and innovations in land application of farm wastes
in New Zealand and showed that research must focus on improved systems to convert
manure based wastes into a valuable but also environmentally benign product.
An alternative manure management system in some countries is anaerobic digestion.
Manures are an excellent source of organic material for anaerobic digestion and the
production of bio-gas. Co-digestion of agricultural wastes with sewage sludges can further
improve the methane production in anaerobic digesters (Ward et al., 2008).
2.4 Environmental Impact of agricultural waste waters
Agricultural waste waters can contain N, P, K, S, C, pathogenic micro-organisms and a
range of other micro nutrients. Nutrients returned to agricultural soils through land-
spreading are important for nutrient efficiency on farms and for reducing reliance on
inorganic fertilisers. Land application should be at rates that supply nutrients for crop
growth and at the time when these nutrients are required. Addition of excessive nutrients at
times of reduced crop demand can increase the potential for losses of nutrients such as N
and P, which contribute to surface water eutrophication and can lead to pollution of
drinking waters. In addition, land application to wet soils can lead to increased emissions of
greenhouse gases such as nitrous oxide (N
2
O).
Landspreading of dairy slurry and wastewaters has been associated with ammonia
volatilisation to the atmosphere. Application of ammoniacal nitrogen (NH
4
+
) to soils in
wastewater increases the soil solution NH
4
+
concentrations, which is in equilibrium with
free ammonia (NH
3
) which is also in equilibrium with the concentrations in the atmosphere
(See Equation 1).
Soil Solution: NH
4
+
+ OH
-
NH
3
+ H
2
O
Atmosphere: NH
3
Waste Water - Evaluation and Management
456
Ammonia volatilisation from soil lowers the pH of soil directly under the waste water.
Further soil pH reduction can also occur when the volatilised NH
3
is re-deposited and
nitrified. Agriculture is the main emitter of NH
3
to the atmosphere accounting for ~80% of
total global emissions (Stark and Richards, 2008) and is expected to reach 109 Tg N yr
-1
by
2050. Once in the atmosphere, NH
3
can readily combine with NO
3
and SO
4
2-
in acid cloud
droplets to form particulates and can be transported over long distances before being
deposited again to soil or water. Atmospheric N deposition has increased over recent decades
and ranges from 5 to 80 kg ha
-1
yr
-1
with a global average of 17 kg ha
-1
yr
-1
have been observed.
Deposited NH
3
can then lead to acidification of soil and eutrophication of waters, which led to
the UN establishing the Convention on Long-range Transboundary Air Pollution including
NH
3
and the EU set limits for NH
3
from European countries. Emissions of NH
3
from
agricultural slurry and waste waters can be reduced through utilisation of low emission
storage facilities where stores are covered to reduce contact with the atmosphere. Emissions
can also be reduced from the field through the use of low emissions spreading methods such
as band spreading and injection (See section 2.3). Land application of dilute waste wasters has
lower NH
3
emissions compared to more solid waste due to a reduction in the NH
4
+
content
and the infiltration of the liquid waste into soil, reducing atmospheric contact. Thus dilute
effluents have lower NH
3
emissions, but potentially greater N
2
O and NO
3
-
emissions.
Application of animal slurries and wastewaters to soils promotes denitrification through the
supply of readily available N and C for microbial respiration and also by promoting
anaerobic conditions in the soil through partial sealing of soil pores and the consumption of
oxygen through C oxidation. Storage of manures leads to the build up of volatile fatty acids
which are readily degradable forms of C. Microbial denitrification associated with
landspreading of organic wastes can be an important source of the potent greenhouse gas,
N
2
O. Emissions of N
2
O from slurry spreading are mainly related to the application method,
and the soil temperature combined with soil moisture at the time of application. Methods
for reducing N
2
O emissions associated with waste waters include limiting the hydraulic
loading to ensure soils remain aerobic; adjusting application timing to when soils are not
anaerobic; adjusting application method/rate; inclusion of nitrification inhibitors to slow the
rate of NO
3
-
formation; manipulation of the C/N ratio; digestion or storage to reduce labile
C content and inclusion of materials with high cation exchange capacity e.g. zeolite. A
schematic of soil N transformations is presented in Figure 1.
There have been numerous reports of water pollution occurring after landspreading of
wastewaters to soils. Richards et al. (2004) reported nitrate leaching losses ranging from 95
to 323 kg N ha
-1
when wastewaters were over-applied to free draining soils. Houlbrouke et
al (2004) reported between 2 and 20% of N and P applied in agricultural wastewaters
leached through soils and the concentrations leaching were above ecological limits for good
water quality.
Repeated application of wastewaters to soil can lead to an increase in the organic fractions of
N, P, K and organic carbon due to changes in soil organic matter. In New Zealand, Barkle et
al. (2000) reported significant increases in soil total N and organic C. At low temperatures
increasing soil C content due to dirty water application can lead to greater N immobilisation
due to changes in the soil C/N ratio (Ghani et al., 2005). Increasing soil nutrient status above
the agronomic optimum has been shown to increase the risk of nutrient loss to water
(Sharpley and Tunney, 2000). Other soil properties can be influenced by land application
such as increasing soil pH, changes in soil hydraulic conductivity due to clogging, plugging
and macropore/aggregate collapse. Often the actual effect of landspreading on soil physical
Agricultural Dairy Wastewaters
457
properties is difficult to quantify due to variability in soil physical properties, short term
observation and experimental approaches within a background of seasonal variation in
properties (Hawke and Summers, 2006) Agricultural waste waters can contain high
concentrations of pathogen micro-organisms such as Campylobacter, Listeria,
Cryptosporidium and Salmonella spp. Loss of high concentrations of faecal pathogens to
water can result in the waters being unfit for human consumption and failing to meet water
quality standards for bathing water quality. Pathogen transfer to water can occur when
waste waters are applied to water-logged soils where water flow over soil leads to high
pathogen losses to rivers and associated bathing waters (Kay et al., 2007). Reducing the
volume and area contaminated by waste waters on farms can reduce emission of pathogens
to water by 10% (Kay et al., 2007).
A=Mineralisation
B=Anammox (NH
4
+NO
2
N
2
+2H
2
O)
C=Volatilisation
D=Aerobic Denitrification
E=Anaerobic Denitrification
F=Leaching
G=Dissimilatory Nitrate Reduction to Ammonium
H=Immobilisation
Soil Organic Matter
Labile N
Stable N
F
DON
SLURRY/WASTEWATER
NH
3
N
2
NH
3
A
H
B
C
F
NH
4
+
NO
2
-
NO
3
-
G
Soil Mineral Nitrogen
E
D
NO
2
-
N
2
O
N
2
NO
3
-
LEACHING
Fig. 1. Soil N transformations of slurry/wastewater derived nitrogen inputs.
3. Novel remediation techniques currently being researched
Fenton et al. (2008) reviewed agricultural wastewater remediation and control technologies
suitable for Ireland. Several options such as use of chemical amendments, subsurface carbon
emplacement and wetlands were some of the options proposed for further research.
3.1 Amendments to dairy slurry and dirty water
Dairy dirty water is a bio-product of dairy farming. The usual method for disposal of this
product is land-spreading (Healy et al., 2007). This can increase the P concentration on the
soil surface and the pollution related with the natural run-off during rain events. Not many
studies have been made regarding this subject.
Waste Water - Evaluation and Management
458
Due to the properties of the dairy dirty water, the potential for leaching should also be
considered. Usually, P leaching is not considered to be a significant problem in groundwater
because it is not very mobile in soils or sediments, and should therefore be retained in the
soil zone. However, in extremely vulnerable areas, where the soil and subsoil are shallow
and where P enters groundwater in significant quantities, groundwater may act as an
additional nutrient enrichment pathway for receptors such as lakes, rivers and wetlands
(EPA, 2008). Phosphorus leaching may occur in sandy soils (Carlyle et al., 1998) or where
there are preferential flow paths in the soil.
In the past, the primary objective of chemical amendment of manure was to reduce NH
3
losses from manure as this increased N availability to plants. In recent years environmental
concerns have shifted this focus to amendments, which mitigate P loss from soils and
manure. In Ireland, the focus of recent research has been to find amendments which reduce
solubility of P in dairy cattle slurry in particular. The use of such amendments must be
practical and cost effective for the farmer. The effect of reducing P solubility on reducing
subsequent P fertilizer replacement value of the material should also be considered.
Alum (aluminium sulphate) has been used extensively to treat poultry litter in the U.S for
over 30 years with great success to reduce NH
3
in poultry houses and reduce soluble P in
poultry litter (Moore and Edwards, 2007). These authors also found that alum addition to
poultry litter reduced P loss, ammonia volatilisation and had negligible effect on metal
release from amended soil. Work involving amendments of swine and dairy cattle slurries
for the control of P have been limited to laboratory batch studies with little emphasis on cost
or feasibility of treatments (Dao, 1999; Dou et al., 2003; Kalbasi and Karthikeyan, 2004; Smith
et al., 2001; Moore et al., 1998).
Aluminium chloride has been recommended as the most suitable amendment for
controlling P solubility in swine and cattle slurry (Smith et al., 2001). In an incubation study
Dou et al. (2003) found that technical grade alum added at 0.1 kg/kg (kg alum per kg slurry)
and 0.25 kg/kg reduced Water Extractible P in dairy and swine slurry by 99% and 80%,
respectively. Dao (1999) amended farm yard manure with calcium carbonate, alum and fly
ash in an incubation experiment and reported WEP reductions in amended manure
compared to the control of 21, 60 and 85%. Penn et al. (2009) examined the sorption and
retention mechanisms of several P sorbing materials (PSMs) including acid mine drainage
treatment residuals, water treatment residuals, fly ash, bauxite mining residual and FGD in
lab experiments and found the degree of sorption of P to be strongly influenced by the
solution pH, buffer capacity of manure, and ionic strength of amendments. These
amendments are attractive as they are free. However, they are more variable than chemicals
and commercial coagulants used by other workers and much more research is required
before there could be used in practice. Internationally, P sorbing amendments have been
used to control P losses after manure application. P sorbing amendments can either be
added directly to the manure before land application (Moore et al., 1998), spread on the
ground before manure application (McFarland et al., 2003), or incorporated into the topsoil
at (Novak and Watts, 2005).
Ochre from coal mining origins in the U.K. is a low value waste product from acid mine
drainage and has been used as an amendment to sequester P in filters or drainage ditches, or
in wetlands receiving sewage or agricultural waste. In Ireland, metal release from metal
mining Avoca ochre has made it unsuitable for environmental purpose (Fenton et al., 2008;
Fenton et al., 2009(a)). Ochre has a high P sequestration capacity with 97% of sequestration
occurring within 5 minutes of contact with an agricultural waste.
Agricultural Dairy Wastewaters
459
3.2 PRB and reactive media for enhanced denitrification
Low-cost, in situ treatment systems, called permeable reactive barriers (PRB), may be used
to treat groundwater. In these systems, N-rich wastewater flows through a carbon (C)-rich
mixture to reduce nitrate concentrations to acceptable levels. Organic C amendments offer
low-cost surface and subsurface treatment alternatives for wastewater treatment. C
availability is an important factor that affects denitrifying activity in soils. The presence of C
provides an energy source, thereby enhancing the potential for denitrification.
Denitrification may be increased in soils by the addition of an external C amendment. This
amendment may be natural C such as woodchip, wheat straw, corn, vegetable oil, sawdust
mulch, or other materials, such as treated newspaper or unprocessed cotton (Volokita, 1996).
A PRB or denitrification wall is only one of many denitrifying bioreactor types, i.e.
denitrification beds, up-flow bioreactors, stream bed bioreactor or denitrification layers. The
limitations of a denitrification wall are that they require site specific analyses of hydraulic
gradient, the depth and extent of the nitrate plume/s, removal of nitrate is confined to up-
gradient pollution sources and within the upper 2 m of groundwater. Problems may arise if
the denitrification wall has a lower saturated hydraulic conductivity than the surrounding
sub-soil. If this occurs, nitrate plumes tend to flow around the wall and not through it.
However, in cases where nitrate contamination occurs below 2 m, the diameter (parallel to
flow path of contaminant) of the trench may be widened. This causes up-welling into the
more permeable trench. Flow through these denitrification bioreactor systems may be either
horizontal or vertical. In laboratory studies, vertical flow systems, wherein influent water is
pumped from the base of a column, tend to be preferred, as anaerobic conditions are easy to
maintain and constant flow rates can be maintained.
3.2.1 Vertical flow systems
Different types of filter media have been examined in PRBs. Gilbert et al. (2008) studied
seven types of materials (softwood, hardwood, coniferous, mulch, willow, compost and
leaves) to select a suitable natural organic substrate to use in a PBR. Subsequent to a batch
test, the material used in the laboratory-scale study was softwood. The columns were 0.09 m
in diameter and 0.9 m long, and received an influent concentration of 50 mg NO
3
-N dm
-3
loaded from the column base at two HLRs: 0.3 cm
3
min
-1
and 1.1 cm
3
min
-1
. At the lower
HLR, removals of more than 96% were measured, whereas removals of 66% were measured
for the higher HLR. The impact of residence times was also studied by Claus and Kutzner
(1985), who studied N removal in an up-flow packed bed reactor, with lava stones as
support for the microbial growth. Using nitrate solution of different concentrations (1.8; 3.0;
4.3; 6.1 g NO
3
L
-1
) and 5 different residence times (5; 3.3; 2.5; 2.0; 1.7 h), 95% denitrification
was measured at the longest residence time.
Other types of filter media, such as shredded newspaper, have also been examined. Volokita
et al. (1996) treated water in 0.55 m-high x 0.1 m-diameter laboratory columns using
shredded newspaper (0.4 cm width). Complete nitrate removal of the inlet solution (100 mg
L
-1
) was achieved at an ambient temperature of 32
o
C. Sawdust has high denitrification rates
due to its large surface area, but it is prone to clogging. Bedessem et al. (2005) used a
mixture of sawdust and native soil in a 4.6 m-long, 7.6 cm-diameter laboratory column to
treat synthetic wastewater. The total nitrogen (TN) removal was 31% in the control column
(comprising only native soil) and 67% in columns with an organic layer (soil and sawdust).
Saliling et al. (2007) evaluated woodchips and wheat straw using an up-flow bioreactor. The
Waste Water - Evaluation and Management
460
influent concentration was 200 mg NO
3
-N L
-1
and a 99% removal was obtained. Vrtovšek
and Roš (2006) examined the effectiveness of a 1 m long x 0.12 m diameter fixed-bed biofilm
reactor, comprising a mixture of PVC plastic and powdered activated carbon (PAC) as
packing material. The reactor was inoculated with municipal wastewater before operation.
Influent water with a concentration of 45 mg NO
3
-N L
-1
and sodium acetate
(CH
3
COONa.3H
2
O) was loaded from the base of the column. Different loading rates were
applied to the column, with drinking water quality being achieved at nitrogen loading rates
(NLR) of lower than 1.9 g NO
3
-N m
-2
d
-1
. Phillips and Love (2002) investigated a denitrifying
bio-filter to remove nitrate from re-circulating aquaculture system waters using an up-flow
fixed film column and two fermentation columns. Two nitrate concentrations (1.13 kg NO
3
-
N m
-3
d
-1
and 2.52 kg NO
3
-N m
-3
d
-1
) were loaded at a HLR of 3.0 m
hr
-1
. The column was
packed with polystyrene media with a specific surface area of 1000 m
2
m
-3
and was seeded
with activated sludge prior to operation. Commercial fish food was used as a fermentation
source. Nitrate removal of greater than 99% was achieved. Rocca et al. (2007) used a
coupling heterotrophic-autotrophic denitrification processes (HAD) supported by cotton
and zero-valent iron (ZVI) to measure nitrate reduction. Two sets of columns filled with
cotton and 150 g or 300 g of ZVI were used in this experiment. This had an up-flow inlet
concentration of 100 and 220 mg NO
3
L
-1
, and 3 and 6 mg L
-1
of phosphate. The HAD had a
higher volumetric nitrate removal ratio (VNR) than cotton-supported denitrification alone.
A laboratory sulphur-based reactive barrier system was evaluated by Moon et al. (2008) and
was able to transform 60 mg N L
-1
in di-nitrogen (N
2
) in the presence of phosphate. The
denitrification rate was higher than 95%. Cameron and Schipper (2010) compared nitrate
removal, hydraulic and nutrient leaching characteristics of nine different carbon substrates.
Mean nitrate removal rates for the period 10–23 months were 19.8 and 15 g N m
−3
d
−1
(maize
cobs), 7.8 and 10.5 g N m
−3
d
−1
(green waste), 5.8 and 7.8 g N m
−3
d
−1
(wheat straw), 3.0 and
4.9 g N m
−3
d
−1
(softwood), and 3.3 and 4.4 g N m
−3
d
−1
(hardwood) for the 14 and 23.5 C
treatments, respectively.
3.2.2 Horizontal flow systems
Horizontal flow systems have also been used in studies. Healy et al. (2006) examined the use
of various wood materials as a carbon source in laboratory horizontal flow filters to
denitrify nitrate from a synthetic wastewater. The filter materials were: sawdust (Pinus
radiata), sawdust and soil, sawdust and sand, and medium-chip woodchips and sand. Two
influent NO
3
-N concentrations, 200 mg L
-1
and 60 mg L
-1
, loaded at 2.9 to 19.4 mg NO
3
-N kg
-
1
mixture d
-1
, were used. The horizontal flow filter with a woodchip/sand mixture, loaded
at 2.9 mg NO
3
-N kg
-1
d
-1
, performed best, yielding a 97% reduction in NO
3
-N at steady-state
conditions. Using a sand tank containing a denitrifying zone in the centre (sand coated with
soybean oil), Hunter (2001) measured a 39% nitrate removal of the initial concentration of 20
mg NO
3
-N L
-1
at a flow rate of 1112 L week
-1
.
3.3 Wetlands
Dairy dirty water (DDW), defined in Section 2.3, can have a significant adverse effect on the
environment. In Ireland, management of DDW is explained in Section 3.3, but in recent
years, the use of constructed wetlands (CWs) for the treatment of DDW, as well as domestic
and municipal wastewaters, has being gaining in popularity. This is due to their relatively
low capital costs and maintenance requirements.
Agricultural Dairy Wastewaters
461
3.3.1 Wetland types
There are two types of CW: free water surface constructed wetlands (FWS CWs) and
subsurface CWs. In FWS CWs, wastewater flows in a shallow water layer over a soil
substrate. Subsurface CWs may be either subsurface horizontal flow CWs (SSHF CWs) or
subsurface vertical flow CWs (SSVF CWs). In SSHF CWs, wastewater flows horizontally
through the substrate. In SSVF CWs, wastewater is dosed intermittently onto the surface of
sand and gravel filters and gradually drains through the filter media before collecting in a
drain at the base. CWs may be planted with a mixture of submerged, emergent and, in the
case of FWS CWs, floating vegetation. However, the ability of vegetation to capture
nutrients, particularly in a cool temperate climate, is limited (Healy et al., 2007).
The large surface area of CWs provides an environment for the physical/physico-chemical
retention and biological reduction of organic matter and nutrients (Knight et al., 2000; Lu et
al., 2009). Depending on the type of CW used, its design, organic loading rate (OLR) and
hydraulic retention time (HRT) (Karpiscak et al., 1999); a CW can have a significant nutrient
removal capability. However, due to the effect of changing temperatures, the treatment
efficiency of these systems tends to vary throughout the year (Bachand and Horne, 2000).
3.3.2 Design guidelines for dairy dirty water treatment
American guidelines for the design loading of SSHF CWs treating agricultural wastewater
(NRCS, 1991) recommend an areal OLR of 7.3 g 5-day biochemical oxygen demand (BOD
5
)
m
-2
d
-1
; similar rates are used in wetland design for cool temperate climates (Cooper et al.,
1996; Dunne et al., 2005ab). New Zealand guidelines for the disposal of DDW (Tanner and
Kloosterman, 1997) recommended that an FWS CW should only succeed two waste
stabilization ponds (an anaerobic and an aerobic pond, respectively) before entering the
wetland with an OLR not exceeding 3 g BOD
5
m
-2
d
-1
. Generally, FWS CWs are used for the
treatment of DDW as issues such as blockage of the filter media – normally associated with
the operation of SSHF CWs – do not arise.
3.3.3 Treatment efficacy
Results from CWs have been variable. Table 4 tabulates the performance of FWS CWs in the
treatment of DDW in a range of countries. In a study of planted and unplanted SSHF CWs,
where the unplanted SSHF CWs acted as an experimental control, Tanner (1995ab) found
that under 5-day carbonaceous biochemical oxygen demand (CBOD
5
) OLRs ranging from
0.9 to 3.4 g CBOD
5
m
-2
d
-1
(unplanted) and 0.9 to 4.1 g CBOD
5
m
-2
d
-1
(planted), maximum
CBOD
5
removals of 85% and 92%, respectively, were measured. Ammonification was more
pronounced with increasing HRT, and total nitrogen (Tot-N) removal varied between 48
and 80% for planted CWs. Similar OLRs were used in a study on a 3-cell integrated FWS
CW in Co. Wexford, Ireland (Dunne et al., 2005ab) where, under OLRs varying from 2.7 to
3.5 g BOD
5
m
-2
d
-1
, good organic removal was measured, but nitrification was not complete
during winter.
Cronk et al. (1994) also found that under reduced retention times (with OLRs of 60 g BOD
5
m
-2
d
-1
) BOD
5
and suspended solids (SS) concentrations were not reduced to acceptable
levels after treatment in a 1-cell FWS CW, and that no significant reduction of total kjeldahl
nitrogen (TKN) occurred. In a study on a dairy farm in Drointon in the U.K (Cooper et al.,
1996), a SSHF CW was used to treat influent with an average BOD
5
concentration of 1192 mg
L
-1
. The system initially utilized only the wetland alone and performed poorly under an
OLR of approximately 26 g BOD
5
m
-2
d
-1
. However, when two SSVF CWs and a lagoon were
Waste Water - Evaluation and Management
462
Parameter Wetland Loading Influent Effluent Removal Reference
Type rate ± SD ± SD efficiency
BOD
Ireland FWS 998±1034 16±5 98 [1]
USA FWS ~60 7130 2730 62 [2]
FWS ~12 242 246 -2 [3]
FWS NP 1914 59 97 [4]
FWS 18 2680 611 77 [5]
Australia FWS 5.6 220 90 59 [6]
Italy FWS ~1.9 451 28 94 [7]
N. Zealand FWS ~4.1 113 27 76 [8]
FWS ~1 337 11 92 [8]
COD
Ireland FWS 1718±2008 162±83 91 [1]
SS
Ireland FWS 535±434 34±31 94 [1]
USA FWS NP 5540 990 82 [2]
FWS NP 911 641 30 [3]
FWS NP 1645 65 96 [4]
FWS 9 1284 130 90 [5]
N. Zealand FWS ~8.5 150 33 78 [8]
FWS ~1.9 142 34 76 [8]
Tot-N
USA FWS 0.7 103 74 28 [5]
FWS NP 170 13 92 [4]
N. Zealand FWS 2.7 ~38 20 48 [9]
FWS 0.6 ~38 10 75 [9]
NH
4
-N
Ireland FWS 48±25 6±5 88 [1]
USA FWS 0.05 8 52 0 [5]
FWS NP 72 32 56 [4]
Israel FWS NP 51 44 14 [10]
N. Zealand FWS NP 33 22 34 [9]
FWS NP 38 11 71 [9]
NO
3
-N
USA FWS NP 5.5 10 0 [4]
FWS 2x10
-3
0.3 0.1 67 [5]
Tot-P
USA FWS NP 53 2.2 96 [4]
FWS 0.2 26 14 46 [5]
N. Zealand FWS 0.8 ~11 6.9 37 [9]
FWS 0.2 ~11 2.9 74 [9]
PO
4
-P
Ireland FWS 15±7 3±2 80 [1]
Avg±SD; FWS = free-water surface constructed wetland; NP = not published
[1] Healy and O’ Flynn (pers. comm.); [2] Cronk et al., 1994; [3] Karpiscak et al., 1999; [4] Schaafsma et
al., 2000; [5] Newman et al., 2000; [6] Geary and Moore, 1999; [7] Mantovi et al., 2003; [8] Tanner et al.,
1995(a); [9] Tanner et al., 1995 (b); [10] Ran et al., 2004.
Table 4. Average influent and effluent concentration (mg L
-1
), loading rates (g m-
2
d
-1
), and
removal efficiencies of wetlands treating dairy dirty water (DDW).
Agricultural Dairy Wastewaters
463
installed in front of the SSHF CW, the system had an OLR of approximately 4 g BOD
5
m
-2
d
-1
and had good organic and SS removal rates, but had limited nitrification due to large
fluctuations in the inlet wastewater strength. Even under significantly reduced OLRs, SSHF
and FWS CWs have under-performed. In Italy, a study on a 2 cell FWS CW operated in
series and monitored over a 26 month period, treating a mixture of domestic and DDW at an
average influent OLR under 2 g BOD
5
m
-2
d
-1
, showed that anoxic zones which developed in
the wetland inlet meant that nitrification was inhibited, producing an effluent Tot-N which
was mainly composed of ammonium-N (NH
4
-N) (Mantovi et al., 2003).
Present agricultural practice in Ireland is governed by The European Communities (Good
Agricultural Practice for Protection of Waters) Regulations 2009 (S.I. No. 101 of 2009), which
places a responsibility on the individual farmer and the public authority to adhere to the
conditions set out within the Nitrates Directive (EEC, 1991(a)) and other water quality
directives to ensure good wastewater management practices. On account of this, CWs are
becoming popular for the treatment of DDW. Healy and O’ Flynn (pers. comm.) evaluated
the performance of seven CWs treating DDW in Ireland. They found that average removals
of chemical oxygen demand (COD) from DDW were 91%. However, average effluent
concentrations were 162 mg L
-1
, which was much higher than the maximum allowable
concentration (MAC). The performance of the CWs in the reduction of NH
4
-N and ortho-
phosphorus (PO
4
-P) was also highly variable.
4. Conclusion
Much research focuses on the nutrient content of agricultural wastewaters and their
inorganic fertilizer replacement potential. Many options for dairy slurry and dirty water are
in place including land application, irrigation and treatment using a variety of on farm or off
farm options. Nutrient, gaseous and microbial losses can result from land application of
agricultural wastes. Much research focuses on matching crop requirements with organic
fertilizer applications. In addition, the control of P within such wastes can prevent incidental
losses to the environment e.g. chemical amendments. Once nutrients are lost, other forms of
remediation such as PRB’s or wetlands may be applicable to protect a waterbody.
5. References
ADAS, 1985. Dirty water disposal on the farm, Ministry of Agriculture, Fisheries and Food,
London.
ADAS, IGER & SSRC, 1994. Low rate irrigation of dilute farm wastes. Report for the
National Rivers Authority, R and D no. 262, National Rivers Authority, Bristol.
Aislabie, J.M., Fraser, R.H., Smith, J. & McLeod, M. 2001. Leaching of bacterial indicators
through four New Zealand soils. Australian Journal of Soil Research 39: 1397-1406.
Anon, 2005. European Communities (Good Agricultural Practice for Protection of Waters)
Regulations 2005. SI 788 of 2005. Department of Environment, Heritage and Local
Government, The Stationary Office, Dublin, 47 pp.
Anon, 2006. European Communities (Good Agricultural Practice for Protection of Waters)
Regulations 2006. SI 378 of 2006. Department of Environment, Heritage and Local
Government, The Stationary Office, Dublin, 49 pp.
Anon, 2009. European Communities (Good Agricultural Practice for Protection of Waters)
Regulations 2009. SI 101 of 2009. Department of Environment, Heritage and Local
Government, The Stationary Office, Dublin, 50 pp.