Energy Technology and Management Part 8 pot
Bạn đang xem bản rút gọn của tài liệu. Xem và tải ngay bản đầy đủ của tài liệu tại đây (2.3 MB, 20 trang )
Network Reconfiguration for Distribution System with Micro-Grid
131
Initial
condition
SMG of the micro-grid
0 kW 100 kW 200 kW 300 kW 400 kW 500 kW
Switchers to
be opened
7-20 (T)
8-14 (T)
11-21 (T)
17-32 (T)
24-28 (T)
6-7 (S)
8-9 (S)
11-12 (S)
14-15 (S)
27-28 (S)
6-7 (S)
8-9 (S)
14-15 (S)
15-16 (S)
27-28 (S)
6-7 (S)
8-9 (S)
14-15 (S)
16-17 (S)
27-28 (S)
5-6 (S)
7-8 (S)
11-12 (S)
15-16 (S)
24-28
(T)
5-6 (S)
7-8 (S)
11-12 (S)
16-17 (S)
24-28 (T)
5-6 (S)
7-8 (S)
11-12 (S)
17-32
(T)
24-28
(T)
Power loss(kW) 134.98 153.14 141.15 133.65 128.52 121.32 110.10
Node of lowest
voltage
17 15 16 17 16 17 32
Lowest voltage
(p.u)
0.9143 0.9222 0.9299 0.9335 0.9275 0.9317 0.9378
SMG of the micro-grid
600 kW 700 kW 800 kW 900 kW
1000
kW
1100
kW
1200 kW
Switchers to
be opened
5-6 (S)
7-8 (S)
11-12 (S)
9-10 (S)
24-28 (T)
5-6 (S)
7-8 (S)
11-12 (S)
11-21 (T)
24-28 (T)
5-6 (S)
7-8 (S)
8-9 (S)
30-31 (S)
24-28 (T)
5-6 (S)
7-8 (S)
8-9 (S)
30-31 (S)
24-28 (T)
5-6 (S)
7-8 (S)
11-21 (T)
30-31 (S)
24-28 (T)
5-6 (S)
7-8 (S)
11-21 (T)
30-31 (S)
24-28 (T)
5-6 (S)
7-8 (S)
11-21 (T)
29-30 (S)
24-28 (T)
Power loss(kW) 106.24 104.23 81.71 80.03 78.12 78.12 69.57
Node of lowest
voltage
32 32 30 30 30 30 29
Lowest voltage
(p.u)
0.9379 0.9380 0.9545 0.9545 0.9546 0.9546 0.9627
SMG of the micro-grid
1300 kW
1400
kW
1500
kW
1600
kW
1700
kW
Switchers to
be opened
5-6 (S)
7-8 (S)
11-21 (T)
29-30 (S)
24-28 (T)
5-6 (S)
7-8 (S)
11-21
(T)
28-29 (S)
24-28
(T)
5-6 (S)
7-8 (S)
11-21
(T)
27-28 (S)
24-28
(T)
5-6 (S)
7-8 (S)
11-21
(T)
26-27 (S)
24-28
(T)
5-6 (S)
7-8 (S)
11-21
(T)
5-25 (S)
24-28
(T)
Power loss(kW) 69.57 63.44 67.71 73.23 80.00
Node of lowest
voltage
29 29 28 26 25
Lowest voltage
(p.u)
0.9627 0.9616 0.9555 0.9488 0.9449
* In Tab.1, if a switcher is marked by (T), it is a tie switcher, e.g. 11-21(T) means a tie switcher between
node 11 and 21. If a switcher is marked by (S), it is a sectionalizing switcher, e.g. 5-6 (S) means a
sectionalizing switcher between node 5 and 6.
Table 1. Reconfiguration results for IEEE 33-node system with a single micro-grid and
different SMG values.
Energy Technology and Management
132
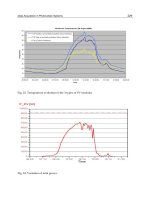
Fig. 5. Power loss changes with SMG (IEEE 33-node system)
Fig. 6. Lowest voltage changes with SMG (IEEE 33-node system)
2.
Power loss and lowest voltage (V
min
in Fig.6) both change with the SMG value of micro-
grid. For power loss, the minimum value occurs at point A in Fig.5 with (1400kW,
63.44kW), while the maximum value of V
min
occurs at point B with (1200kW,
0.9627p.u.). It is very interesting that the SMG values of point A and point B are not
equal.
3.
Power loss and V
min
both change with SMG nonlinearly. e.g. In Fig.6, when SMG
increases in the interval of O-C and D-B, V
min
also increases. While SMG increases in the
interval of C-D and B-E, V
min
decreases. For power loss, it is interesting that there is a
minimum point at SMG =1400kW. When the SMG is less than 1400kW, the power loss
decreases with SMG increasing. When SMG is larger than 1400kW, the power loss
increases with SMG increasing.
4.2 PG&E 69-node system
PG&E 69-node system consists of 69 nodes, 5 tie lines all with tie switchers. All branches
have sectionalizing switchers. Details of the system can be referred to (Baran & Wu, 1989,
Network Reconfiguration for Distribution System with Micro-Grid
133
Chen et al, 2008; Yu et al, 2009). It is assumed that there is a micro-grid connecting to node
25. When a fault occurs, it causes branch 14-15 out of service. Using the presented method in
section 3, we calculate the power loss and lowest voltage when SMG of the micro-grid
changes. The result is shown in Tab.2, Fig.7 and Fig.8. Discussion to the result is similar to
that of IEEE 33-node system, which is omitted here for simplification.
Initial
Condition
SMG of the micro-grid
0 kW 100 kW 200 kW 300 kW 400 kW 500 kW
Switchers to
be opened
11-66(T)
13-21(T)
15-69(T)
27-54(T)
39-48(T)
11-66(T)
13-21(T)
14-15(S)
50-51(S)
47-48(S)
11-66(T)
21-22(S)
15-69(T)
27-54(T)
47-48(S)
11-66(T)
14-15(S)
18-19(S)
27-54(T)
47-48(S)
11-66(T)
13-21(T)
15-69(T)
27-54(T)
47-48(S)
11-66(T)
13-21(T)
15-69(T)
53-54(S)
47-48(S)
11-66(T)
13-21(T)
63-64(S)
53-54(S)
47-48(S)
Power
loss(kW)
188.53 129.08 121.96 118.15 117.32 110.32 110.01
Node of lowest
voltage
54 50 54 54 54 53 53
Lowest voltage
(p.u)
0.9140 0.9236 0.9254 0.9261 0.9261 0.9297 0.9297
SMG of the micro-grid
600 kW 700 kW 800 kW 900 kW
1000
kW
1100
kW
1200
kW
Switchers to
be opened
11-66(T)
13-21(T)
3-59(S)
53-54(S)
47-48(S)
11-66(T)
13-21(T)
15-69(T)
52-53(S)
47-48(S)
11-66(T)
21-22(S)
15-69(T)
51-52(S)
47-48(S)
11-66(T)
14-15(S)
3-59(S)
50-51(S)
47-48(S)
11-66(T)
21-22(S)
3-59(S)
50-51(S)
47-48(S)
11-66(T)
14-15(S)
3-59(S)
50-51(S)
47-48(S)
11-66(T)
10-11(S)
67-68(S)
50-51(S)
47-48(S)
Power
loss(kW)
109.60 83.77 83.78 83.80 83.80 83.81 84.81
Node of lowest
voltage
53 52 51 50 50 50 50
Lowest voltage
(p.u)
0.9297 0.9412 0.9416 0.9425 0.9425 0.9425 0.9426
Table 2. Reconfiguration results for PG&E 69-node system with a single micro-grid and
different SMG values.
Energy Technology and Management
134
Fig. 7. Power loss changes with SMG (PG&E 69-node system)
Fig. 8. Lowest voltage changes with SMG (PG&E 69-node system)
5. Conclusion
This chapter presents an optimal model for reconfiguration analysis of distribution system
with micro-grids. Once a fault occurs in a distribution system, it can be applied to
construct some optimal islands so as to guarantee power supplying to some important
loads and to reduce power loss at the same time. The model is then decomposed into a
capacity sub-problem and a reconfiguration sub-problem. The former is used to determine
the optimal capacity for each island, and the latter is used to find the optimal
reconfiguration with less power loss. Two sub-problems are called iteratively to get the
optimization solution. Finally, IEEE 33-node system and PG&E 69-node system are
employed to validate the effectiveness of the presented method. Studies of this chapter are
helpful to find the optimal integration scheme for various DG devices connecting to
distribution system in the future.
Network Reconfiguration for Distribution System with Micro-Grid
135
6. References
EPRI(2007). Renewable energy technical assessment guide-TAG-RE: 2006. EPRI Final
Report, Palo Alto, CA USA: 2007. 1012722
EPRI(2001). Integrating distributed resources into electric utility distribution systems, EPRI
Final Report, Palo Alto, CA USA: 2001. 1004061
IEEE(2003). IEEE standard for interconnecting distributed resources with electric power
systems, IEEE Std 1547-2003.
Chen, H. F.; Liu, Z.; Jia, H. J.; Yu, X. D. Bender's decomposition based reconfiguration for
distribution network with distributed generation. Automation of Electric Power
Systems, 2008, 32(1): 6-10.
Yu, X. D.; Jia, H. J.; Wang, C.S.; et al. Network reconfiguration for distribution system with
micro-grids, Proc. of 1st SUPERGEN, 2009, April 6-7, Nanjing, China. Article No:
5348219.
Barnes M; Kondoh, J; Asano, H; et al. (2007). Real-world microgrids: an overview, Proc of
IEEE International Conference on System of Systems Engineering, San Antonio, TX
USA, 2007.4. 16-4.18, pp.1-8.
Khan M. S.; Iravani, M. R. (2007). Supervisory hybrid control of a micro grid system, Proc. of
IEEE 2007 Electrical Power Conference, 2007, Oct.25-26, Montréal, Québec, Canada,
pp.20-24.
Dimeas, A. L.; Nikos, D. H. (2005). Operation of a multiagent system for micro-grid control.
IEEE Trans. on Power Systems, 2005, 20(3): 1447-1455.
Civanlar, S.; Grainger, J. J.; Yin H.; et al. (1988). Distribution feeder reconfiguration for loss
reduction. IEEE Trans. on Power Delivery, 1988, 3(3): 1217-1223.
Baran, M. E.; Wu, F. F. (1989). Network reconfiguration in distribution systems for loss
reduction and load balancing, IEEE Trans. on Power Delivery, 1989, 4(2): 1401 -
1407.
Song, Y. H.; Wang, G. S.; Johns, A. T.; Wang, P. Y. (1997). Distribution network
reconfiguration for loss reduction using fuzzy controlled evolutionary
programming, IEE Proc Generation, Transmission and Distribution, 1997, 144 (4):
345-350.
Kashem, M. A.; Ganapathy, V; Jasmon, G. B. (2001). A geometrical approach for network
reconfiguration based loss minimization in distribution systems, Int. J. of Electrical
Power and Energy Systems, 2001, 23(4):295-304.
Carpaneto, E.; Chicco, G. (2004). Ant-colony search-based minimum losses reconfiguration
of distribution systems, Proc. of the 12th IEEE Mediterranean, MELECON, 2004,
May 9-12, Dubrovnik, Croatia, pp. 971-974.
Sua, C.T.; Changb, C. F.; Chiou, J. P. (2005). Distribution network reconfiguration for loss
reduction by ant colony search algorithm, Electric Power Systems Research, 2005,
75(2-3):190-199.
Tu, Q.; Guo, Z. Z. (2006). Median current moment method for dynamic reconfiguration in
distribution network, Proc. of Int. Conference on Power System Technology, 2006,
22-26 Oct. Chongqing, China, pp.1-4.
Bhattacharya, S. K.; Goswami, S. K. (2008). Distribution network reconfiguration considering
protection coordination constraints, Electric Power Components and Systems, 2008,
36(11):1150-1165.
Energy Technology and Management
136
Carreno, E. M.; Romero, R.; Padilha F. A. (2008). An efficient codification to solve
distribution network reconfiguration for loss reduction problem, IEEE Trans. on
Power Systems, 2008, 23(4): 1542-1551.
7
A Camera-Based Energy Management
of Computer Displays and TV Sets
Vasily G. Moshnyaga
Fukuoka University
Japan
1. Introduction
With increase in image quality and screen sizes, the energy consumption of computer
displays and television sets has significantly grown. In a typical personal computer or PC,
display accounts for 30%~50% of the total PC energy consumption [Mahesri 2005, Robertson
2002]. For instance, typical 19 inch LCD monitor, such as Sony SDM-S93 (1280x1024 pixels),
burns in active mode 50W or almost 38% of the total desktop system power (130W). With
large popularity of video and gaming applications, LCD makers are being called on to cut
power consumption while providing better images. Rapid utilization of multiple displays
each consuming tens of watts throughout homes, offices and buildings increases cost and
environmental impact of energy consumption significantly. Although most PC displays
support power management, new robust methods are needed for evolving display usage
scenarios.
For TV sets, the quest for efficient display energy management is more severe, because
modern TVs have much bigger screens than computer displays and therefore consume more
power. Although the LCD TVs are more efficient than their cathode-ray tubes (or CRT) TVs,
recently emerged plasma television sets are twice as bigger and about four times more
energy than their cathode-ray tube equivalents [Coughlan, 2006]. A 50-inch flat-screen
plasma HDTV now burns over 500Watts of power [Plasma TV, 2006]; consuming almost the
same amount of energy as dishwasher or in-room air-conditioner. The problem however
does not relate only to plasma television sets. The LCD TV sets also consume a lot. A typical
42” LCD TV takes 169-250Watts of power per each hour [TV Power Consumption, 2008].
According to Nielsen Media Research Inc. [Nielsen 2009] over 99% of all households in US
have TV sets, with 2.24 TVs per household in average. Since TV is ON for almost 5 hours in
an average US home a day [Television & Health], it has become one of the largest energy
consumers. Due to emerging problems of global warming and fossil fuel shortage, reducing
TV energy is very important.
Up to the date, reducing energy consumption of LCD displays has been tackled mainly
through system and circuit optimizations, which either ignore the user, assuming fixed and
stable demands on system operation or rely on very simplified policies, which eventually
lead to large energy losses. Generally, there are two sources of energy losses in a device:
intrinsic losses and the user-related losses. The intrinsic energy losses are caused by the
engineering design, technology and materials used in construction of the device. For
example, a plasma TV intrinsically dissipates more energy than a LCD TV, etc. The user-
Energy Technology and Management
138
related losses are associated with varying and inefficient device usage. Keeping a TV ON
when nobody watches it, for example, causes energy loss associated with bad device usage.
Existing energy management policies are device centric; that is they either ignore the user,
assuming unchangeable operational environment for the device or rely on very simplified
polices. Take a TV for example. Take a TV for example. A variety of methods has been
proposed to reduce energy consumption of TVs. Majority of them, however, target the
intrinsic energy losses, without considering the viewer. As a result, the television sets
produce bright and high quality pictures independently whether there is any viewer or
not. According to [Gram-Hansen, 2003], the energy consumption of consumer electronic
devices can differ by a factor of two due to usage. Some experts estimate that 26% - 36% of
the total domestic energy consumption are losses related to unreasonable usage of
appliances [Elias 2007]. Clearly, in order to reduce the losses, we must make the device
energy management user-centric, i.e. adaptable to the varying user behavior. No energy
should ever be spent uselessly.
In this chapter we present a new approach to LCD display and TV set energy management,
which unlike existing methods employs a video camera to bind the display power state to
the actual user’s attention. We discuss implementation of this novel approach and show the
results of its experimental evaluation.
The chapter is organized as follows. In the next section we survey related research. Section 3
describes the proposed camera-based display energy management approach. Section 4
presents implementation features for PC display and TV set. Section 5 summarizes our
findings and outlines work for the future.
1
2. Related research
The core technology to manage power consumption of display in modern personal
computers is Advanced Configuration and Power Interface (or ACPI in short) developed by
HP, Intel, Microsoft, Phoenix, and Toshiba. The OS-based ACPI specifies one or more power
states (e.g. standby, sustain, etc.) that are intermediate between on and off turning the
display to low power state after a specified period of inactivity on mouse and/or keyboard.
Each power state corresponds to proper level of display brightness and power consumption.
The main problem with ACPI is that it strongly depends on inactivity intervals, either set as
default or by the user. From one hand, if the inactivity intervals are improperly short, e.g. 1
or 2 minutes, the ACPI can be quite troublesome by shutting the display off when it must be
on. From another hand, if the inactivity intervals are set to be long, the ACPI efficiency
decreases. Because modifying the intervals requires system setting, most users however
never adjust the power management of their PCs for fear that it will impede performance
[Fujitsu-Siemens]. Those who do the adjustment, usually assign long intervals. HP inspected
183,000 monitors worldwide and found that almost a third was not set to take advantage of
the energy saving features. Just enabling these features after 20 minutes of inactivity can
save up to 381 kWh for a monitor per year [Hewlett-Packard 2006]. Evidently, to prevent
such a problem the PC energy management must employ more efficient user monitoring.
Several techniques have been proposed to improve presence detection of computer users.
Extending touch-pad function beyond pointer movement to provide user-presence
1
Apple PCs employ power management technology that is distinct from but similar to ACPI (see
[Nordman 1996], [Nordman 1997] for more details
A Camera-Based Energy Management of Computer Displays and TV Sets
139
identification is proposed in [Park, 1999]. [Dai 2003] suggests using thermal sensors placed
around display screen to detect user’s presence by comparing temperature fluctuation the
sensors during a sample interval. When user is present, the temperature fluctuation is
consistent with a normal fluctuation pattern of human breathing.
TV sets also employ screen brightness dimming technologies for energy saving. Nowadays
TV viewers can modify the screen brightness level by selecting one of three operation
modes: the “standard mode” delivers the highest level of brightness; the “saving mode”
refers to the dimmed screen and “no brightness mode” reflects the dark screen. The
brightness level in the saving mode can also be changed. Sensing light is already a feature of
many TVs to enable dimming based on ambient light level. However, unless the light is
changed or the viewer changes the mode, the TV maintains same brightness.
Many efforts have been put recently on brightness/contrast adjustment techniques to lower
display energy consumption in active mode. The reason is that transmissive and
transflective color TFT LCD panels [Sharp 2002] do not illuminate itself but filter a backlight,
the primary source of display energy dissipation. Because simply dimming the backlight
degrades the display visibility, Choi, et al [Choi 2002] proposed to maintain brightness or
contrast of the LCD panel when the backlight is dimmed down. To reduce the average
energy demands of the backlight, Gatti, et al [Gatti 2002] suggested the backlight auto
regulation scheme. Cheng and Pedram [Cheng 2004] showed that a concurrent brightness
and contrast scaling (CBCS) technique further enhances image fidelity with a dim backlight,
and thus saves an extra power. Chang, et al [Chang 2005] introduced a dynamic luminance
scaling or DLS technique that dimmed the backlight while allowing more light to pass
through the screen panel to compensate for the loss of brightness in the original image.
Shim, et al [Shim 2004] combined the DLS technique with dynamic contrast enhancement
and applied it for transflective TFT LCD panels. Pasricha, et al [Pasricha 2004] presented an
adaptive middleware-based technique to optimize backlight power when playing streaming
video. Iranli, et al [Iranli 2006] presented HVS-aware dynamic backlight scaling in TFT LCD.
A modification of the LCD panel to permit zoned backlighting has been discussed in [Flin
1999]. There is also a variety of techniques for automated adjustment of brightness in high
dynamic range panoramic images, e.g. [Pattanai 2000], [Tumblin 1999]. These techniques
dynamically brighten or darken image regions depending on the scene content and average
local luminance.
Despite differences, the proposed brightness and/or contrast adjustment techniques have
one feature in common. Namely, they work independently on the viewer attention. While
the techniques are able to decrease the TV energy consumption in active mode, they can not
change the modes. So TV screen remains active even if nobody watches it. Similarly to
computer users, majority of TV viewers do not change brightness or power mode for energy
savings, fearing that it affects picture quality. Besides, viewers usually watch TV while
doing other activities: reading books, working on PC, preparing food, chatting with friends,
etc. According to statistics, a TV is ON for almost 5 hours in an average US home a day [3].
As Kaiser Family Foundation [Generation M2, 2010] reports, 39% of 8-18 year olds in US say
they keep TV on while doing other things “most of the time”; 29% say they do so “some of
the time.” In other words, a TV frequently wastes energy for producing high quality
pictures when nobody watching them.
Leading TV produces have recently started to embed “user sensors” into TV sets in order
adjust power consumption to the user behavior. For example, the VIERA® plasma TV from
Panasonic senses the user through the remote controller. If the time from the last use of
Energy Technology and Management
140
remote controller exceeds a pre-defined time interval (e.g. 1, 2 or 3 hours), the TV
automatically powers off. The latest Bravia® HDTV from Sony incorporates an infra-red
motion sensor, which switches the TV off when no motion has been detected in front of it
over a period of time (e.g. 5 min, 30 min or 1 hour) pre-set by the user. Also Hitachi and
Toshiba use hand gesture sensors to control TV.
Sensing the viewer explicitly (through fingers, hands or body motion) has several problems:
it is either incorrect (a moving dog or a tree in the window can keep the TV on) or
troublesome, i.e. requires the user either to push the remote control or move in front of the
screen frequently or to enlarge the allowed duration of inactivity interval to prevent
shutting the TV down. Also, because modern PCs monitor the user’ fingers not eyes, they
can not distinguish whether the user looks at the screen or not. Therefore, they may either
switch the screen off inappropriately, i.e. when someone looks at the screen without
pressing the keys, or lose energy by staying in active mode while idling. We claim that
ignorance of the viewer’s attention is the main cause of the user-related energy losses of
existing displays in PCs and TVs. While the display operation mode must depend on the
viewer, existing displays, up to our knowledge, do not take the viewer’s focus into account.
We propose a method which can solve this problem.
3. The proposed display energy management technology
The main goal of our approach is to increase the energy efficiency of display by enabling
it to “watch” its viewer and lower down the display power whenever the viewer
is detracted from the screen. We assume that the screen of computer display or TV is
enabled with a video camera. This can be a special camera embedded in display for viewer
monitoring, an infra-red camera or a general purpose video camera (e.g. SONY VAIO visual
communication camera) connected via USB port for video capture, conferencing, etc. The
camera is located at the top of display or TV. When a viewer looks at the screen, it faces the
camera frontally. Also we assume that computer display and TV have a number of backlight
intensity levels with the highest level corresponding to the largest power consumption and
the lowest level to the smallest power, respectively. The highest level of backlight intensity
is enabled either initially or whenever the user looks at the screen. In all cases we assume
that the viewer monitoring mode is optional to the user.
The idea behind our display energy management is simple. When the user of PC or TV
looks at screen, the screen is kept active in “power-up” mode to provide the best visibility. If
the user detracts his/her attention from the screen, the screen is dimed off to decrease
energy consumption. Finally, if nobody looks at the screen for long time or disappears from
the camera’s range, the screen enters the “sleep” mode or is turned off to save energy.
In order to make the technology effective, the camera based viewer tracking system must
satisfy a number of requirements, such as initialization simplicity, be non-intrusive, support
unrestricted head movements, real time operation and low energy consumption. The latter
requirement is especially important for battery operated personal computers because it
keeps the PC battery lifetime and weight reasonable. Majority of currently available viewer
tracking systems, unfortunately, do not satisfy these requirements making energy
management a real challenge. For instance, some systems need calibration procedures; the
others require users to wear head-mounted gears (a hat or helmet or glasses on which
camera is mounted) or restrict head positions within a quite narrow area. Those systems
which meet the requirements are unfortunately very energy consuming [Ji 2002], [Baluja
1994], [Ohno 2003], [Theocharides 2004], [Park 2005], [Kawato 2005].
A Camera-Based Energy Management of Computer Displays and TV Sets
141
Video input
Eye-gaze detection
is user
present?
yes
gaze
on screen?
Dim backlight to
the next level
Power-up
mode
yes
no
no
C=C+1
C<N
no
yes
Can dim?
yes
User presence detection
begin
Sleep
mode
C=0
no
Video input
Eye-gaze detection
is user
present?
yes
gaze
on screen?
Dim backlight to
the next level
Power-up
mode
yes
no
no
C=C+1
C<N
no
yes
Can dim?
yes
User presence detection
begin
Sleep
mode
C=0
no
Fig. 1. The flowchart of the proposed camera-based computer display energy management
Below we present techniques which ensure real-time camera-based energy management
with low-energy overhead. Although the same methodology can be used for tracking
viewers of computer display and TV set, we optimize the techniques by the application to
reduce the energy overhead.
3.1 The camera based computer PC display energy management
Figure 1 shows the flowchart of our camera-based computer display energy management.
Here, C counts the number of consecutive image frames in which the user’s gaze is off the
screen. We assume that the camera is located at the top of display. If no user is detected in
the N consecutive video frames, the display is turned to the sleep mode. Otherwise, the
technology tracks the user’s eye-gaze. If the gaze has been off the screen for more than N
consecutive frames, the backlight luminance is dimmed down to the next level. Any on-
screen gaze reactivates the initial backlight luminance by moving the display onto power up
mode. However, if no on-screen gaze has been detected for more than N frames and the
backlight luminance has already been lowest, the display enters the sleep mode. Returning
back from sleep mode is done automatically whenever the user gaze is back on screen. The
user may also switch the display OFF whenever he or she wishes. Re-activating the screen
from the OFF state requires pushing the ON button.
Energy Technology and Management
142
132
465
(x1,y1)
(x2,y1)
(x1,y2)
(x2,y2)
(x0,y0)
132
465
(x1,y1)
(x2,y1)
(x1,y2)
(x2,y2)
(x0,y0)
Fig. 2. An illustration of the SSR filter
3.1.1 User presence detection
The goal of this task is to determine from the camera (or CMOS sensor) readings whether or
not the user is currently present in front of display. To detect the user’s presence in front of
the display, we first localize the face search by applying background subtraction and skin-
color segmentation to the RGB representation of input image. The skin is defined by the
following criteria [Douchamps 2002]: 0.55<R<0.85, 1.15<R/G<1.19, 1.15<R/B<1.5 and
0.6<(R+G+B)<1.8.
To accelerate the face-area extraction, we use two filters. The first one limits the size of the
head in reasonable range. The second one verifies that the face contains a minimum of 25%
of skin colored pixels. Thus, if the total number of pixels in the derived face area exceeds the
threshold (W), the user is assumed present.
3.1.2 Eye-gaze detection
The eye-gaze detector implements the algorithm proposed by [Kawato 2005], which scans
the Six Segment Rectangular filter (SSR) over the integral representation [Viola 2001] input
image. to define the Between The Eyes (BTE) point of human face (see Fig.2) and then
searches the regions 1 and 3 from the left and right side of the BTE point to locate the eyes.
The algorithm does not depend on illumination, face occlusion, eye closure. It is more stable,
robust and less complex than the other eye-tracking formulations. However, it is still very
computationally demanding. In a quest to locate all faces (without restriction on face size,
motion and rotation) the algorithm repeats scan six times over the whole image frame
performing over 28 Million operations, such as addition or subtraction per frame (640x480
pixels frame size). Though such a full search might be necessary in some applications, it
seems redundant when tracking eyes of the PC user.
In our eye-tracking application we can assume that:
1. The target object is a single PC user. The user sits in front of PC at a relatively close
distance (50-70cm).
2. The user’s motion is slow relatively to the frame rate.
3. The background is stable and constant.
Based on these assumptions, we apply the following optimizations to reduce eye-tracking
complexity:
a. single SSR filter scan;
b. fixed SSR filter size;
c. three pixel displacement of the SSR filter during the scan;
d. low frame processing rate (5-10 fps);
A Camera-Based Energy Management of Computer Displays and TV Sets
143
Locate the eyes
Confirm by SVM
Save BTE, eye locations
Positive
yes
no
Extract face candidates
Next face candidate
0ther candidates?
yes
no
Next frame
Positive
Compute integral image of S
0ther candidates?
Run SSR filter
no
yes
no
Save BTE location
Run complete?
Face candidate?
no
no
yes
Face candidate?
Set search area (S)
around previous BTE
no
Set search area (S) by
background extraction and
skin-color segmentation
BTE known?
yes
Locate the eyes
Confirm by SVM
Save BTE, eye locations
Positive
yes
no
Extract face candidates
Next face candidate
0ther candidates?
yes
no
Next frame
Positive
Compute integral image of S
0ther candidates?
Run SSR filter
no
yes
no
Save BTE location
Run complete?
Face candidate?
no
no
yes
Face candidate?
Run SSR filter
no
yes
no
Save BTE location
Run complete?
Face candidate?
no
no
yes
Face candidate?
Set search area (S)
around previous BTE
no
Set search area (S) by
background extraction and
skin-color segmentation
BTE known?
yes
Fig. 3. The modified eye-tracking algorithm
As our study shows [Yamamoto 2009], such enhancements reduce computational
complexity considerably without affecting the quality of the results.
Fig.3 shows the modified algorithm. For the first frame or any frame in which the search for
BTE candidate was unsuccessful, we search the image area reduced by background and skin-
color extraction; otherwise the search is restricted to a small area (S) of ±8 pixels around the
BTE point. For the chosen area, the algorithm first computes the integral image and then scans
it by the Six Segment Region filter (SSR) to select the BTE candidate. If the BTE candidate is
found, the system uses the BTE as a starting point to locate eyes. If eyes have been detected,
the user is assumed to be looking at screen; else it is not. If no face candidate has been found
for N consecutive frames, the user is considered not present in front of the display.
The BTE search is organized as follows. The green component of the search area is
transformed to integral image representation [Viola 2001] and scanned by the six-segment
rectangular (SSR) filter (Fig.2). At each location, the SSR filter compares the integral sums of
the segments as follows: At each location, the SSR filter compares the integral sums of the
segments as follows:
Sum (1) < Sum (2) & Sum (1) < Sum (4) (1)
Sum (3) < Sum (2) & Sum (3) < Sum (6) (2)
If the above criteria (1) are satisfied, the SSR is considered to be a candidate for the BTE
pattern (i.e. face candidate) and two local minimum (i.e. dark) points each are extracted
from the regions 1 and 3 of the SSR for left and right eyes, respectively.
In the search for eyes, we ignore 2 pixels at the boarder of the regions to avoid effects of
eyebrows, hair and beard. Also, because the eyebrows have almost the same grey level as
the eyes, the search starts from the lowest positions of regions 1 and 3.
Energy Technology and Management
144
D
A
DD
A
Fig. 4. An illustration of the eye detection heuristics (left) and the search area reduction
The eye localization procedure is organized as a scan over the green plane representation of
regions 1 and 3 for a continuous segment of dark pixels (i.e. whose value is lower than the
threshold k). As in [Kawato 2000], we assume that eyes are located if the distance between
the located eyes (D) and the angle (A) at the center point of the BTE area 2 (see Fig.4, left)
satisfy the following:
30 < D <42 & 115° < A < 180° (3)
If both eyes are detected, the user’s gaze is considered to be on screen. Otherwise, it is
assumed to be off the screen. The eye positions found in the current frame are then used to
reduce complexity of processing the successive frames. Since the face/eye motion of
computer user is slow in practical circumstances, the search in the next frame is limited to a
small region, which spans by 8 pixels in vertical and horizontal direction around the eye
points of the current frame.
Fig. 4(right) demonstrates the search area reduction by our algorithm: dashed line shows the
area defined by background extraction; dotted line depicts the area obtained by skin-color
segmentation; the plain (dark line) shows the area around the previous BTE point; white
crosses show the computed locations of eyes.
If for any frame, the user gaze is detected to be on screen, the backlight luminance is set-up
to the highest level by resetting the backlight voltage to the initial value. If the gaze has been
detected off the screen for N consecutive frames, the backlight voltage is reduced to the next
level to dim the backlight luminance down. If the lowest level of the backlight voltage
supply has been reached and the user still is not found in the camera readings, the system
switches the display off to save energy.
3.1.3 Implementation
Fig.5 outlines the block-diagram of the proposed computer display power management
system. The user tracking unit receives an RGB color image and outputs two logic signals,
u
1
,u
0
. If the user is detected in the image, the signal u
0
is set to 1; otherwise it is 0. The zero
value of u
0
enforces the voltage converter to shrink the backlight supply voltage to 0 Volts,
dimming the display off. If the eye-gaze detector determines that the user looks at screen, it
sets u
1
=1. When both u
0
and u
1
are 1, the display operates as usual. If the user’s gaze has
been off the screen for more than N consecutive frames, u
1
becomes 0. If u
0
=1 and u
1
=0, the
input voltage (V
b
) of the high-voltage inverter is decreased by ΔV. This voltage drop lowers
backlight luminance and so shrinks the power consumption of the display. Any on-screen
A Camera-Based Energy Management of Computer Displays and TV Sets
145
High-voltage
inverter
Backlight
lamp
Voltage
converter
Screen
V
b
Video
Camera
Display
Eye
detector
u
1
(R,G,B)
u
0
User
presence
detector
User tracking unit
Fig. 5. Block diagram of the camera-based display energy management system
CMOS camera
User
tracker
CMOS camera
User
tracker
Fig. 6. The user-tracking hardware
gaze in this low power mode reactivates the initial backlight luminance and moves the
display onto normal mode. However, if no on-screen gaze has been detected for N
consecutive frames and the backlight luminance has already reached the lowest level, the
display is turned onto sleep mode.
We implemented the system in hardware (see [Moshnyaga 2009] for details). Fig.6 illustrates
the hardware design of the user tracking unit. The design was synthesized in Verilog HDL
using Synopsis Design Compiler and realized on a single FPGA (Xilinx XC3S250E) board.
The board is connected to VGA CMOS camera, through parallel I/O interface. Table 1
summarizes parameters of the FPGA design. The user tracking unit operates at 48MHz
frequency using 3.3V external voltage and provides user presence detection at 20fps rate.
Due to capacity limitations of the on-chip SRAM memory, input images were 160x120 pixels
in size. The SSR filter was 30x20 pixels in size. The total power consumption of the gaze
detector design was 150mW, which is 35 times less than software implementation of the
user presence detector on desktop PC () [Moshnyaga 2005].
Energy Technology and Management
146
Parameter Value
System clock frequency 48MHz
External voltage 3.0V
Internal voltage 1.2V
System gate count 250000
Logic cell count 18508
Memory size 216Kb
Frame size (pixels) 160x120
Detection rate 20fps
Power 150mW
Table 1. FPGA design parameters
Input logic
Voltage controller
clk
CCFL×2
V
b
L
0
L
1
-15V
+15V
+12V
PIC
16F84A
u
0
u
1
CCFL
AC-DC
inverter
C
display
-
+
R4
R1
R2
Relay
Input logic
Voltage controller
clk
CCFL×2
V
b
L
0
L
1
-15V
+15V
+12V
PIC
16F84A
u
0
u
1
CCFL
AC-DC
inverter
C
display
-
+
R4
R1
R2
Relay
Fig. 7. The modified voltage converter
Next, to change the display brightness dynamically, we modified the voltage converter by
adding the input logic, the voltage controller, and a relay, as shown in Fig.7. In TFT LCD
displays, the Pulse Width Modulation (PWM) scheme links brightness of the cold cathode
fluorescent lamps (CCFL) to the input voltage, Vb, of the CCFL AC-DC inverter. Usually,
the display brightness is the highest when Vb=0 and the lowest when V
b
=5V. In our design,
the voltage V
b
is controlled by two inputs (u
0
,u
1
) whose levels are defined by the eye-gaze
detector (see fig.5). When u
0
=0, the relay disconnects the 12V power supply to the display
switching it OFF. Turning the display ON automatically sets u
0
to 1, which enforces +12V
voltage supply to display. When u0=1, the display power consumption is controlled by the
output (V
b
) of the voltage controller. Namely, when u
1
=1, the counter (cnt) nulls outputs
L
1
,L
2
setting V
b
to 0V. When u
1
=0, the counter increments its state with each new rise of
signal clk, thus setting the voltage converter to increment its output V
b
by approximately
0.7V. Table 2 outlines the display voltage control and the power consumption at the
corresponding four voltage levels. As it clearly shows, changing the brightness leads to large
savings of display power.
A Camera-Based Energy Management of Computer Displays and TV Sets
147
u1 u0 Vb(V) Brightness Power (W)
1 1 0 bright 34.03
1 0 1.2 Level 1 27.43
1 0 2.4 Level 2 22.21
1 0 3.6 Level 3 17.54
1 0 4.8 Level 4 14.62
0 - - OFF 0.01
Table 2. Display voltage control parameters
a) b)
c) d)
Fig. 8. Examples of true detection
3.1.4 Evaluation
To evaluate accuracy of the gaze detector, we ran four different tests each of each
conducted by different users. The users were free to look at the camera/display, read
from the materials on the table, type text, wear eyeglasses, move gesticulate or even leave
the PC whenever wanted. Fig.8 illustrates the detection results on 4 images. The + marks
depict positions where the system assumes the eyes to be. As we see, even though the
lighting conditions of faces vary, the results are correct. Ordinary pairs of glasses (see
Fig.8) have no bad effect on the performance for frontal faces. In some face orientations,
however, the frame of pair of glasses can hide a part of eye ball, causing the system to
loose the eye. Or sometimes it takes eyebrow or hair as an eye and tracks it in the
following frames.
Table 3 summarizes the results. Here, the second column depicts the total number of frames
considered in the test; columns marked by ‘True’ and ‘False’ reflect the number of true and
false detections, respectively; the Accuracy column shows the ratio of true decisions to the
Energy Technology and Management
148
Test Frames True False Accuracy (%)
1 151 133 18 88
2 240 214 26 89
3 100 90 10 90
4 180 152 28 84
Average 167 147 20 88
Table 3. Results of evaluation on test sequences
0
1 501 1001 1501 2001
Frame
ACPI
0
5
10
20
30
35
40
Power (W)
15
25
No user
Gaze
off screen
No user
Gaze
on
screen
User is
present
Gaze
on
screen
0
1 501 1001 1501 2001
Frame
ACPI
0
5
10
20
30
35
40
Power (W)
15
25
No user
Gaze
off screen
No user
Gaze
on
screen
User is
present
Gaze
on
screen
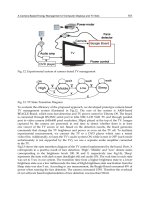
Fig. 9. Power consumption vs. image frame for the tested display
total number of all decisions made. As the tests showed, the eye detection and tracking
accuracy of proposed hardware is quite high (88% on average).
Next, we estimated the energy efficiency of the proposed system by measuring the total
power consumption taken from the wall by the system itself and the 17” IO-DATA TFT LCD
display (35W on peak, eight different levels of screen brightness) controlled by the system.
Fig.9 profiles the results measured per frame on a 100sec (2000frames) long test. In the test,
the user was present in front of the display (frames 1-299, 819-1491, 1823-2001); moved a
little from the display but still present in the camera view (frames 1300 to 1491); and stepped
away from the PC disappearing from the camera (frames 300-818, 1492-1822). The system
was set to step down from the current power level if the eye-gaze off the screen was
continuously detected for more than 15 frames (i.e. almost 1 sec). The ACPI line shows the
power consumption level ensured by the conventional ACPI power management.
We observe that our technology is very effective. It changes the display power accordingly
to the user behavior; dimming the display when the user gaze is off the screen and
illuminating the screen (by elevated power) when the user looks on it. Changing the
A Camera-Based Energy Management of Computer Displays and TV Sets
149
Fig. 10. Screenshots of display and corresponding power consumption: when the user looks
at screen, the screen is bright (power: 35W); else the screen is dimmed (power: 15.6W)
brightness from one power level to another in our system takes only 20ms, which is
unobservable for the user. Fig. 10 shows the brightness of the screenshots and the
corresponding power consumption level (see the figures which are displayed on the down-
right corner of the pictures; the second row from the bottom shows the power).
The total power overhead of the system is 960mW. Even though the system takes a little
more power than ACPI (see horizontal line in Fig.9) in active mode on this short test, it saves
36% of the total energy consumed by the display. In environments when users frequently
detract their attention from the screen or leave computers unattended (e.g. school,
university, office) the energy savings could be significant.
3.2 The camera based TV energy management
3.2.1 An overview
The methodology used for camera-based TV energy management is similar to that discussed
in Section 3.1 with the difference that for TV it monitors multiple viewers simultaneously.
Energy Technology and Management
150
User present?
yes
Can dim?
Power saving
mode
Dim backlight
Power-Up mode,
C=0
no
yes
Video input
Begin
no
C=C+1
C<N
no
yes
User present?
yes
Can dim?
Power saving
mode
Dim backlight
Power-Up mode,
C=0
no
yes
Video input
Begin
no
C=C+1
C<N
no
yes
Fig. 11. Flowchart of the camera-based TV energy management
Also, because TV screens are much larger than PC displays, the TV viewers can be on a far
distance from camera than the PC users. As result, detecting gaze of TV viewers correctly
based on a typical CMOS sensor or web camera actually becomes impossible. Therefore for
TV, we track faces (no eyes), assuming that viewers, who watch TV, face the screen (and
camera) frontally. Besides, people sometime watch TV in darkness when ordinary CMOS
image sensors are almost useless. In such conditions, the only device which can be used is
an infra-red camera or IR-vision sensor.
Fig. 11 shows the flowchart of the proposed TV energy management. Here C denotes a
counter and N is a given threshold. By default, the TV screen is bright providing the best
picture quality. Every image frame captured by the camera is scanned to detect a human
face. If neither motion nor human face is detected (i.e. no viewer is present or present but
not looking at the TV screen) in N consecutive frames, the screen is dimmed to a lower level
of screen brightness. If the screen brightness has already reached the lowest level and can
not be dimmed anymore while no human face has been detected for N consecutive frames,
the screen is turned to the sleep mode (i.e. black screen) while the audio system (i.e. sound)
is kept ON. Any on-screen face reactivates the initial backlight luminance by moving the
screen onto the normal mode.
3.2.2 Implementation and evaluation
To detect a human face we developed in Linux OS a face-detection software by using open-
source C-language image processing library “Open-CV” [OpenCV] from Intel. The program
detects faces based on a boosted cascade of simple Haar-like features, proposed by Viola
and Jones [Viola, 2001]. It provides correct detection of human faces located up to 4 meters
away from the camera and ±40 degrees in horizontal and vertical directions.