Waste Water Treatment and Reutilization Part 8 pptx
Bạn đang xem bản rút gọn của tài liệu. Xem và tải ngay bản đầy đủ của tài liệu tại đây (819.69 KB, 30 trang )
Application of Luffa Cylindrica in Natural form as Biosorbent to Removal of Divalent Metals
from Aqueous Solutions - Kinetic and Equilibrium Study
199
2.7 Kinetic and equilibrium studies
The kinetic equations, which are, Avrami (Lopes et al., 2003), pseudo first-order (Largegren,
S., 1898), pseudo-second order (Ho, Y.S., Mckay, G.M., 1999), Elovich (Ayoob et al., 2008)
and intra-particle diffusion model (Weber Jr. and Morris, 1963) are given in Table 1.
Kinetic model Equation
Pseudo-first-order (Largegren, S., 1898)
Pseudo-second-order (Ho, Y.S., Mckay, G.M., 1999)
Elovich (Ayoob et al., 2008)
Avrami (Lopes et al., 2003)
Intra-particle diffusion (Weber Jr.and Morris, 1963)
(
)
[
]
tqq
et
.k-exp-1 .
p
=
t
q
1
kq
1
q
t
e
2
e
t
+=
tq
t
ln)ln(
β
αβ
β
11
+=
()
[
]
(
et
tqq .k-exp-1 .
AV
=
Ctkq
idt
+=
Table 1. Kinetic adsorption models
The isotherm equations which are, Langmuir (Langmuir, 1918), Freundlich (Freundlich, 1906).
Sips (Sips, 1948) and Redlich–Peterson (Redlich and Peterson, 1959) are given in Table 2.
Isotherm Equation
Langmuir (Langmuir,1918)
Freundlich (Freundlich, 1906)
The Redlich-Peterson (Redlich and Peterson, 1959)
Sips (Sips,1948)
e
eL
aC
CK
m
x
+
==
1
e
Q
n
eFe
CKQ
1
=
β
α
eL
ej
C
CK
+
=
1
e
Q
n
e
n
e
aC
abC
+
=
1
e
Q
Table 2. Equilibrium isotherm models
2.8 Evaluation of the kinetic and isotherm parameters
In this work, the kinetic and equilibrium models were fitted employing the non-linear fitting
method, using the non-linear fitting facilities of the software NLREG version 6.5.
3. Results and discussion
3.1 Results
Specific surface area - BET (m²/g) 0.28
Total Surface area (m²/g) 1.1895
Pore Diameter Range (µm ) 1051.309204 to 0.003577
Table 3. Physical properties of the Luffa cylindrica biosorbent
Waste Water - Treatment and Reutilization
200
Elements Weight% Atomic%
C 79.33 86.91
O 12.25 10.07
P 00.95 00.40
S 00.75 00.31
Cl 01.58 00.59
K 03.86 01.30
Ca 01.29 00.42
Table 4. Elemental composition of the Luffa cylindrica biosorbent
(a) Subfigure A
(b) Subfigure B
(c) Subfigure C
(d) Subfigure D
(e) Subfigure E
(f) Subfigure F
(g) Subfigure G
(h) Subfigure H
Fig. 1. Scanning electron microscopy of Luffa cylindrica seeds and sponge mixture biosorbent:
(A) transversal view of the mixture of seed and sponge 33×; (B, C, D, E) transversal view of
the mixture of seed and sponge 1000×; (G, H) transversal view of the mixture of seed and
sponge 5000×.
Application of Luffa Cylindrica in Natural form as Biosorbent to Removal of Divalent Metals
from Aqueous Solutions - Kinetic and Equilibrium Study
201
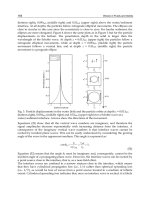
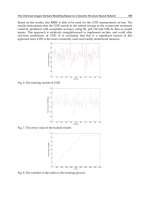
Fig. 2. A plot showing the pore size distribution of the biosorbent - L. cylindrica
Fig. 3a. FTIR spectrum of the mixture of seed and sponge of L. cylindrica biosorbent before
biosorption.
Waste Water - Treatment and Reutilization
202
Fig. 3b
. FTIR spectrum of the mixture of seed and sponge of L. cylindrica biosorbent after
biosorption of Ni
2+
ions .
Fig. 3c. FTIR spectrum of the mixture of seed and sponge of L. cylindrica biosorbent after
biosorption of Cu
2+
ions.
Application of Luffa Cylindrica in Natural form as Biosorbent to Removal of Divalent Metals
from Aqueous Solutions - Kinetic and Equilibrium Study
203
Fig. 3d. FTIR spectrum of the mixture of seed and sponge of L. cylindrica biosorbent after
biosorption of Pb
2+
ions.
Fig. 3e. FTIR spectrum of the mixture of seed and sponge of L. cylindrica biosorbent after
biosorption of Zn
2+
ions.
Waste Water - Treatment and Reutilization
204
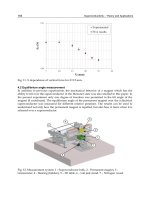
Fig. 4. % Removal of heavy metal ions from aqueous solutions (50 ml, pH 5.0) with
increasing dosage of the heavy metals using L. cylindrica (1.0 g) as biosorbent for 2h.
Fig. 5. Time dependent study of the sorption of lead, copper, zinc and nickel on L. cylindrica
seeds and sponge mixture using 1.0 g biosorbent dose. Initial lead, Nickel, Copper and Zinc
concentrations were 20.0, 4.0, 5.0 and 2.5 mg/L respectively with pH 5.0.
Application of Luffa Cylindrica in Natural form as Biosorbent to Removal of Divalent Metals
from Aqueous Solutions - Kinetic and Equilibrium Study
205
Metal ions (M
2+
)
Kinetic
model
Parameters
Cu Pb Zn Ni
Pseudo-
First order
Pseudo-
Second
order
Intra-
particle
diffusion
Elovich
Avrami
q
e
(mg/g)
k
e1
(g/mg min)
r
2
q
e
(mg/g)
k
e2
(g/mg min)
r
2
k(mg/g min
0.5
)
C (mg/g)
r
2
α (mg/g min)
β (g/mg)
r
2
Kav(min
-1
)
n
av
q
e
(mg/g)
r
2
0.1886
0.1044
0.9819
0.2002
1.1300
0.9883
0.0168
0.0419
0.7933
10.2050
56.7641
0.7375
0.3228
0.3235
0.1886
0.9819
0.9843
0.1720
0.9991
1.0004
0.9183
0.9997
0.0824
0.2691
0.6989
1.292E+13
38.7968
0.9704
0.5434
0.5434
0.9794
0.9983
0.1100
0.1364
0.9947
0.1138
3.7011
0.9977
0.0094
0.0278
0.7401
7649.602
167.0520
0.8709
0.3374
0.4042
0.1099
0.9947
0.1141
0.0240
0.9556
0.1490
0.1522
0.9666
0.0102
0.0026
0.9752
0.0070
29.3910
0.9054
-0.1163
-0.2064
0.1141
0.9556
Table 5. Kinetic model rate parameters obtained using the nonlinear methods.
Metal ions (M
2+
)
Isotherm
Parameters
Cu Ni Pb Zn
Langmuir
Freudlich
Sips
Redlich-
Peterson
Q
max
K
L
r
2
K
F
n
r
2
Q
max
K
s
n
r
2
A
rp
K
rp
g
r
2
2.26E+04
1.4580
0.4922
0.2519
0.5897
0.5381
1.19E+04
0.5897
2.11E-05
0.5381
-0.5421
0.0458
1.0000
0.7449
8.20E+03
7.01E-06
0.3518
0.0015
0.2121
0.9231
1.59E+03
9.51E-07
0.2120
0.9231
-0.2936
0.0117
1.0000
0.9632
1.36E+05
8.32E-06
0.6571
0.2544
0.3846
0.7189
7.90E+04
3.22E-06
0.3845
0.7189
-0.2525
0.3875
1.0000
0.8218
2.89E+04
3.00E-05
0.8576
1.3655
0.6801
0.9212
1.14E+04
1.20E-04
0.6801
0.9212
-1.0178
0.5072
1.0000
0.9539
Table 6. Equilibrium isotherm parameters obtained using the nonlinear methods.
Waste Water - Treatment and Reutilization
206
3.2 Discussion
Table 3 show the surface area and pore diameter range for the biosorbent used for this
study. The Specific surface area using the BET method was 0.28m²/g and the Pore diameter
range was between 1051.309204 to 0.003577µm. As observed, the surface area for the seed
and sponge mixture of L. cylindrica is relatively low, with pore diameter values in agreement
with those found for typical mesoporous materials (Hamoudi and Kaliaguine, 2003).
Table 4 shows the elemental composition of Luffa cylindrica that was analysed by means of
scanning electron microscopy (SEM). The Luffa cylindrica sample showed a very high
percentage of carbon.
Scanning electron microscopy (SEM) of the Luffa cylindrica biosorbent was taken in order
to verify the presence of macropores in the structure of the fiber. In the micrographs
presented Figure 1 (A - J) is observed the fibrous structure of Luffa cylindrica, with some
fissures and holes, which indicated the presence of the macroporous structure. These,
should contribute a little bit to the diffusion of the Ni (II), Pb (II), Cu (II) and Zn (II) to the
Luffa cylindrica biosorbent surface. The small number of macroporous structure is
confirmed by the low specific surface area of the biosorbent (see Table 3). As the
biosorbent material presents few numbers of macroporous structure, it adsorbed low
amount of nitrogen, which led to a low BET surface area (Passos et al., 2006; Vaghetti et al,
2003; Arenas et al., 2004; Passos et al., 2008). Therefore the major contribution of the Ni
(II), Pb (II), Cu (II) and Zn (II) uptake can be attributed to micro- and mesoporous
structures (see Figure 1 (A-J)).
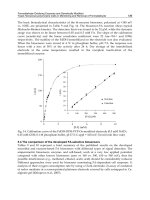
The pore size distribution of the Luffa cylindrica sample was obtained by Mercury intrusion
method, and it is shown in Figure 2. The distribution of average pore diameter curve
presents a maximum with an average pore diameter of about 30 µm. The amount of pores
seen in the Luffa cylindrica biosorbent decreases for average pore diameters ranging from 30
to 1000 µm. On the other hand, the amount of average pores ranging from 3.0E-03 to 30 µm
is predominant. Therefore, this biosorbent can be considered mixtures of micro- and
mesoporous materials (Passos et al., 2006; Vaghetti et al, 2003; Arenas et al., 2004; Passos et
al., 2008).
Figure 4 show the percent removal of Ni
2+
, Pb
2+
, Cu
2+
and Zn
2+
ions from the aqueous
solution using Luffa cylindrica seeds and sponge mixture. The highest percent removal for
the dosage of 1000 mg of the biosorbent was 98.2 for Pb
2+
and was followed by 95.2, 87.6 and
43.5 for Zn
2+
, Cu
2+
and Ni
2+
ions respectively.
Figures 3 a - e show the FTIR spectral. The functional groups on the binding sites were
identified by FTIR spectral comparison of the free biomass with a view to understanding the
surface binding mechanisms. The significant bands obtained are shown in Figure 3 a - e.
Functional groups found in the structure include carboxylic, alkynes or nitriles and amine
groups (Pavia et al., 1996).
The stretching vibrations of C-H stretch of -CHO group shifted from 2847.05 to 2922.20,
2852.58, 2852.46 and 2852.43 cm
-1
after Cu
2+
, Zn
2+
, Pb
2+
and Ni
2+
ions biosorption. The
assigned bands of the carboxylic, amine groups and alkynes or nitriles vibrations also
shifted on biosorption. The shift in the frequency showed that there was biosorption of Cu
2+
,
Zn
2+
, Pb
2+
and Ni
2+
ions on the L. cylindrica biosorbent and the carboxylic and amine groups
were involved in the sorption of the Cu
2+
, Zn
2+
, Pb
2+
and Ni
2+
ions.
Application of Luffa Cylindrica in Natural form as Biosorbent to Removal of Divalent Metals
from Aqueous Solutions - Kinetic and Equilibrium Study
207
Adsorption kinetic study is important in treatment of aqueous effluents as it provides
valuable information on the reaction pathways and in the mechanism of adsorption
reactions.
In this study nonlinear kinetic equations were preferred to the linear equations, since there
are always errors associated with linearization (Mohan et al., 2005; Kumar, 2007; Kumar,
2007). Therefore large errors in kinetic and equilibrium parameters could be obtained, if a
not suitable linear equation is utilized (Mohan et al., 2005; Kumar, 2007; Kumar, 2007). In
addition, the nonlinear kinetic equations have successfully been employed to obtain these
adsorption parameters with excellent accuracy for different adsorbates and adsorbents
(Kumar, 2007; Kumar, 2007; Arenas et al., 2007; Jacques, et al., 2007; Jacques, et al., 2007;
Lima et al., 2007; Lima et al., 2008).
The kinetic study carried out showed that the sorption was best described by all the models
used. The experimental data for all the metal ions studied fitted very well to the Pseudo-
second order model then followed by Pseudo-first order, Avrami, Elovich and Intra-particle
diffusion models. This was shown in Table 5. It was observed that Pb
2+
, Zn
2+
, Cu
2+
and
Ni
2+
ions had regression values (r
2
) for Pseudo-second-order as 0.9997, 0.9977, 0.9883 and
0.9666 respectively. Both Pseudo first order, Pseudo-second order and Avrami models had
values higher than that of Elovich and Intra-particle diffusion models which had a values of
0.7401, 0.7933, 0.6989 and 0.9752 for Zn
2+
, Cu
2+
, Pb
2+
and Ni
2+
ions respectively. Thus it can
be concluded that sorption kinetics using Luffa cylindrica seed and sponge mixture as
biosorbent followed the Pseud-first-order, Pseudo-second-order and Avrami kinetic models.
Hence, the pseudo-second-order model is better in explaining the observed rate. This
suggests that sorption of the metal ions involve two species, in this case, the metal ion and
the biomass (Herrero et al., 2008). These results are in accordance with similar researches
carried out (Ho et al., 2004; Kumar et al., 2006; Lodi et al., 1998) with several natural
sorbents.
The time profile for the various metal ions studied on L. cylindrica is presented in Figure 5.
The rate of Zn
2+
, Cu
2+
, Pb
2+
and Ni
2+
ions removal was rapid in the first 20 minutes and it
decreased progressively afterwards. It was observed that the biosorption process reached
equilibrium after 120 minutes.
The observed fast biosorption kinetics was consistent with the biosorption of metal
involving non-energy mediated reactions, where metal removal from solutions is due
purely to physico-chemical interactions between biomass and metal solution. This fast metal
uptake from solution indicates that binding might have resulted from interaction with
functional groups on the cell wall of the biosorbent rather than diffusion through the cell
wall of the biomass this is in agreement with results that have been reported in many
studies using different biosorbents on the uptake of different heavy metals (Kumar et al.,
2006; Pan et al., 2006; Bueno et al., 2008).
The fitting of data to Redlich-Peterson, Sips, Langmuir and Freundlich isotherms suggest
that biosorption of Pb (II) ions onto the biosorbent could be explained by Redlich-Peterson
isotherm with correlation coefficient of 0.8218 as outlined in Table 6. The biosorption of Zn
(II) ions onto the biosorbent could be explained by all the isotherms studied with correlation
coefficients of 0.8576, 0.9212, 0.9212 and 0.9539 for Langmuir, Freundlich, Sips and Redlich-
Peterson isotherms respectively. The biosorption of Ni (II) ions onto the biosorbent could be
explained by Freudlich, Sips and Redlich-Peterson isotherms with correlation coefficients of
Waste Water - Treatment and Reutilization
208
0.9231, 0.9231 and 0.9632 respectively. The biosorption of Cu (II) ions could be explained by
Redlich-Peterson isotherm with the correlation coefficient of 0.7449. Because experimental
q
e
values were lower than that of Q
max
, considering the reported approaches in the literature
(Hall et al., 1996; Ozer and Ozer, 2003), it may be suggested that biosorption takes place as
monolayer phenomena and that L. cylindrica biomass was not fully covered by the metal
ions.
4. Conclusion
The removal of metal ions from aqueous solution is of importance both environmentally
and for water re-use. The Luffa cylindrica seeds and sponge mixture has been presented here
as a good alternative biosorbent for Ni
2+
, Pb
2+
, Cu
2+
and Zn
2+
ions removal from aqueous
solution. This biosorbent has the ability to sorb the Ni
2+
, Pb
2+
, Cu
2+
and Zn
2+
ions at the
solid/liquid interface, when the sample were suspended in water at a pH of 5.0 and a
contacting time of 2h to saturate the available sites located on the biosorbent surface. Out of
the five kinetic models used to adjust the sorption, the best fit was the Pseudo-second order
model and for the isotherm the best fit was Redlich-Peterson isotherm for Ni (II) ion
biosorption onto L. cylindrica seeds and sponge mixture biosorbent.
5. References
Abdel-Ghani, N. T., Ahmad K. H., El-Chaghaby, G. A. and Lima, E. C. (2009). Factorial
experimental design for biosorption of iron and zinc using Typha domingensis
phytomass. Desalination 249: 343–347.
Arenas, L. T., Lima, E. C., dos Santos Jr., A. A., Vaghetti, J. C. P., Costa, T. M. H.,
Benvenutti, E.V. (2007). Use of statistical design of experiments to evaluate the
sorption capacity of 1,4-diazoniabicycle[2. 2. 2] Octane/silica chloride for Cr (VI)
adsorption, Colloid Surf. A. 297, pp. 240–248.
Arenas, L. T., Vaghetti, J. C. P. Moro, C. C. Lima, E. C. Benvenutti, E. V. Costa, T. M. H.
(2004). Dabco/silica sol–gel hybrid material. The influence of the morphology on
the CdCl
2
adsorption capacity, Mater. Lett. 58, pp. 895–898.
Ayoob, S. Gupta, A. K. Bhakat, P. B. Bhat, V. T. (2008). Investigations on the kinetics and
mechanisms of sorptive removal of fluoride from water using alumina cement
granules, Chem. Eng. J. 140, 6–14.
Babel, S., Kurniawan, T. A. (2003). Low-cost adsorbents for heavy metals uptake from
contaminated water: a review, J. Hazard. Mater. 97, 219–243.
Bal K. J., Hari B. K. C., Radha K., Ghale G. M., Bhuwon R.S., Madhusudan P.U.(2004)
Descriptors for Sponge Gourd [Luffa cylindrica (L.) Roem. ], NARC, LIBIRD &
IPGRI.
Basil JL, Ev RR, Milcharek CD, Martins LC, Pavan FA, dos Santos, Jr. AA, Dias SLP, Dupont
J, Noreña CPZ, Lima EC (2006). Statistical Design of Experiments as a tool for
optimizing the batch conditions to Cr (VI) biosorption on Araucaria angustifolia
wastes. J Hazard Mater; 133: 143-153.
Application of Luffa Cylindrica in Natural form as Biosorbent to Removal of Divalent Metals
from Aqueous Solutions - Kinetic and Equilibrium Study
209
Bueno, B. Y. M., Torem, M. L., Molina, F., de Mesquita, L. M. S. (2008).Biosorption of
lead(II), Chromium(III) and copper(II) by R. opacus: Eqilibrium and kinetic studies.
Miner.Eng. 21, 65-75.
Cimino, G., Passerini, A. and Toscano, G., (2000). Removal of toxic cations and Cr (VI) from
aqueous solution by hazelnut shell. Water Res., 34 (11), 2955-2962.
David, W. O. and Norman, H. N. (1986). Principles of Modern Chemistry. Saunders Golden
Sunburts Series Printed by the Dryden Press. 383 Madison Avenue, New York. N.
Y.10017. USA.
Freundlich, H. M. F. (1906). Über die adsorption in lösungen, Zeitschrift für Physikalische
Chemie (Leipzig) 57A, 385–470.
Goyal, P., Sharma, P., Srivastava, S, Srivastava, M. M. ( 2008). Saraca indica leaf powder for
decontamination of Pb: removal, recovery, adsorbent characterization and
equilibrium modeling, International Journal of Enviornmental Science and
Technology, Vol. 5, No. 1, pp. 27-34.
Gupta, N., Prasad, M., Singhal, N. and Kumar, V. (2009). Modeling the Adsorption Kinetics
of Divalent Metal Ions onto Pyrophyllite Using the Integral Method. Ind. Eng.
Chem. Res., 48 (4), 2125-2128.
Graeme, K. and Pollack C., Jr (1998). Heavy metal toxicity, Part I: Lead and metal fume
fever. Journal of Emergency Medicine, Volume 16, Issue 2, Pages 171-177.
Hall, K. R. Egleton, L. C. Acrivos, A., Vemeulen, T. (1966). Pore and solid diffusion kinetics
in fixed bed adsorption under constant pattern conditions. Ind. Eng. Chem. Fund.
5, 212-223.
Hamoudi, S., Kaliaguine, S.(2003). Sulfonic acid-functionalized periodic mesoporous
organosilica. Micropor. Mesopor. Mater. 59, p. 195-204.
Herrero, R. Lodeiro, P. Rojo, R. Ciorba, A. Rodriguez, P. Sastre deVicente, M.E.(2008). The
efficiency of the red alga Mastocarpus stellanua for remediation of cadmium
pollution. Bioresour. Technol. 99, 4138-4146.
Ho, Y. S., Chui, W. T., Hsu, C. Huang, C. (2004). Sorption of lead ions from aqueous solution
using tree fern as a sorbent. Hydrometallurgy. 73, 55-61.
Ho Y. S., Huang C. T. Huang H.W. (2002).Equilibrium sorption isotherm for metal ions on
tree fern.Process Biochemistry 37, 1421-1430.
Ho, Y. S., Mckay, G. M. (1999). Pseudo-second order model for sorption process, Proc.
Biochem. 34,451–465.
Jacques, R. A., Bernardi, R., Caovila, M., Lima, E. C., Pavan, F. A., Vaghetti, J. C. P., Airoldi,
C. (2007). Removal of Cu(II) Fe(III) and Cr(III) from aqueous solution by aniline
grafted silica gel, Sep. Sci. Technol. 42, pp. 591–609.
Jacques, R. A., Lima, E.C., Dias, S.L.P., Mazzocato, A.C., Pavan, F.A. (2007).Yellow passion
fruit shell as biosorbent to remove Cr(III) and Pb(II) from aqueous solution, Sep.
Purif. Technol. 57, pp. 193–198.
Jolley, O. D., O’Brien, G. and Morrison, J. (2003).Evolution of Chemical Contaminant and
Toxicology Studies, Part 1 - An Overview, South Pacific Journal of Natural Science,
Vol 21, 1-5.
Waste Water - Treatment and Reutilization
210
King, P., Rakesh, N., Beenalahari,Y., Kumar, Y.P., Prasad, V.S.R.K. (2007). Removal of lead
from aqueous solution using Syzygium cumini L.: Equilibrium and Kinetic studies. J.
Harzad. Mater. 142: 340 – 347.
Klen, M. R. F., Ferri, P., Martins, T. D., Tavares, C. R. G. and Silva, E. A. (2007) Equilibrium
study of the binary mixture of cadmium–zinc ions biosorption by the Sargassum
filipendula species using adsorption isothermsmodels and neural network, Biochem.
Eng. J. 34,136–146.
Kumar, K. V. (2007). Optimum sorption isotherm by linear and non-linear methods for
malachite green onto lemon peel, Dyes Pigment 74, pp. 595–597.
Kumar, K. V. (2007). Pseudo-second order models for the adsorption of safranin onto
activated carbon: comparison of linear and non-linear regression methods, J.
Hazard. Mater. 142, pp. 564–567.
Kumar, Y. P, King, P. Prasad, V.S. (2006). Equilibrium and kinetic studies for the biosorption
system of copper(II) ion from aqueous solution using Tectona grandis L. f. leaves
powder, J. Hazard. Mater. 137, 1211-1217.
Kuyucak, N.; Volesky, B. In Biosorption of Heavy Metals; Volesky, B., ed.; CRC Press: Boca
Raton, FL, 1990, pp. 173-198.
Langmuir, I. (1918). The adsorption of gases on plane surfaces of glass, mica and platinum, J.
Am. Chem. Soc. 40, 1361–1403.
Largegren, S, (1898). About the theory of so-called adsorption of soluble substances,
Kungliga Suensk Vetenskapsakademiens Handlingar 241,1–39.
Life Extension. Heavy metal toxicity.
Assessed on the 7th of November, 2009.
Lima, E. C., Royer, B., Vaghetti, J. C. P., Brasil, J. L., Simon, N. M., dos Santos Jr., A. A.,
Pavan, F. A., Dias, S. L. P., Benvenutti, E. V. and da Silva, E. A. (2007). Adsorption
of Cu (II) on Araucaria angustifoliawastes: determination of the optimal conditions
by statistic designof experiments, J. Hazard. Mater. 140, 211–220.
Lima, E. C., Royer, B., Vaghetti, J. C. P., Simon, N. M., da Cunha, B. M., Pavan, F. A.,
Benvenutti, E. V., Veses, R. C., Airoldi, C. (2008). Application of Brazilian-pine fruit
coat as a biosorbent to removal of reactive red 194 textile dye from aqueous
solution. Kinetics and equilibrium study, J. Hazard. Mater. 155, pp. 536 – 550.
Lodi, A., Solisio, C., Converti, A. Borghi, M. (1998). Cadmium, zinc, copper, silver and
chromium (III) removal from wastewaters by Sphaerotilus natans. Bioprocess
Biosyst. Eng. 19, 197-203.
Lopes, E. C. N. dos Anjos, F. S. C. Vieira, E. F. S. Cestari, A. R. (2003). An alternative Avrami
equation to evaluate kinetic parameters of the interaction of Hg (II) with thin
chitosan membranes, J. Colloid Interface Sci. 263 , 542–547.
Marshall, W. E. and Champagne, T. E. (1995). Agricultural Byproducts as Adsorbents for
Metal ions in Laboratory Prepared Solutions and in Manufacturing Wastewater,
Journal of Environmental Science and Health, Part A: Environmental Science and
Engineering. Vol. 30, No. 2, 241 – 261.
Application of Luffa Cylindrica in Natural form as Biosorbent to Removal of Divalent Metals
from Aqueous Solutions - Kinetic and Equilibrium Study
211
Martins, B. L., Cruz, C. C. V., Luna, A. S. and Henriques, C. A. (2006). Sorption and
desorption of Pb
2+
ions by dead Sargassum sp. biomass, Biochem. Eng. J. 27, 310 -
314.
Mazali I. O. Alves O. L. (2005). Morphosynthesis: high fidelity inorganic replica of the
fibrous network of loofa sponge (Luffa cylindrica). Anais da Academia Brasileira de
Ciências, Vol. 77, No. 1, p. 25-31.
Mohan, D., Singh, K. P., Singh, V. K. (2005). Removal of hexavalent chromium from aqueous
solution using low-cost activated carbons derived from agricultural waste materials
and activated carbon fabric cloth, Ind. Eng. Chem. Res. 44, 1027–1042.
Ozer, A., Ozer, D. (2003).Comparative study of the biosorption of Pb(II), Ni(II) and Cr(VI)
ions onto S. cerevisiae: determination of biosorption heats. J. Harzad. Mater. 100:
219-229.
Pan, J., Ge, X., Liu, R., Tang, G.H. (2006). Characteristic features of Bacillus cereus cell
surfaces with biosorption of Pb (II) ions by AFM and FT-IR. Colloids Surf., B. 52,
89-95.
Passos, C. G. Lima, E. C. Arenas, L. T. Simon, N. M. da Cunha, B. M. Brasil, J. L. Costa, T. M.
H. Benvenutti, E. V. (2008). Use of 7-amine-4-azahepthylsilica and 10-amine- 4-
azadecylsilica xerogels as adsorbent for Pb (II). Kinetic and equilibrium study,
Colloids Surf. A .316, pp. 297–306.
Passos, C. G. Ribaski, F., Simon, N. M., dos Santos Jr., A. A., Vaghetti, J. C. P., Benvenutti, E.
V. , Lima, E. C. (2006). Use of statistical design of experiments to evaluate the
sorption capacity of 7-amine-4-azahepthylsilica and 10-amine- 4-azadecylsilica for
Cu (II) Pb (II) and Fe (III) adsorption, J. Colloid Interface Sci. 302, pp. 396–407.
Pavia, D. L., Lampman, G. M., Kriz, G. S. (1996). Introduction to Spectroscopy, 2nd edn.,
Saunders Golden Sunburst Series, New York.
Rakesh N., Kalpana P., Naidu T. V. R and Venkateswara Rao M. (2010). Removal of Zinc
Ions from Aqueous Solution by Ficus Benghalensis L.: Equilibrium and Kinetic
Studies. International Journal of Engineering Studies. Volume 2, Number 1, pp. 15–
28.
Redlich, O., Peterson, D.L. (1959). A useful adsorption isotherm, J. Phys. Chem. 63, 1024–
1027.
Rowell R. M., James S. H., Jeffrey S. R. (2002). Characterization and factors effecting fibre
properties, In Frollini E, Leao, AL, Mattoso LHC, (ed.), Natural polymers and
agrofibres based composites. Embrapa Instrumentacao Agropecuaria, San Carlos,
Brazil pp.115-134.
Santhy, K. and Selvapathy, P., (2004). Removal of heavy metals from wastewater by
adsorption of coir pith activated carbon. Sep. Sci. Technol., 39 (14), 3331- 3351.
Sherrod, P. NLREG version 6.5 (Demonstration) copyright © 1992-2008.
Singh, S., Verma, L. S., Sambi, S. S., Sharma, S. K Adsorption Behaviour of Ni (II) from
Water onto Zeolite X: Kinetics and Equilibrium Studies. Proceedings of the World
Congress on Engineering and Computer Science 2008(WCECS 2008), October 22 -
24, 2008, San Francisco, USA.
Sips, R. (1948). On the structure of a catalyst surface, J. Chem. Phys. 16, 490–495.
Waste Water - Treatment and Reutilization
212
Tumin, N. D., Chuah, A. L., Zawani, Z., Abdul Rashid, S. (2008). Adsorption of Copper from
aqueous solution by Elais guineensis kernel activated carbon. Journal of Engineering
Science and Technology Vol. 3, No. 2, 180 – 189.
Vaghetti, J. C. P. Zat, M., Bentes, K. R. S., Ferreira, L. S., Benvenutti, E. V., Lima, E. C. (2003).
4-Phenylenediaminepropylsilica xerogel as a sorbent for copper determination in
waters by slurry-sampling ETAAS, J. Anal. Atom. Spectrom. 18, pp. 376–380.
Weber Jr. W. J., Morris, J. C. (1963). Kinetics of adsorption on carbon from solution, J. Sanit.
Eng. Div. Am. Soc. Civil Eng. 89, 31–59.
Part 2
Physicochemical Methods for
Waste Water Treatment
11
Degradation of Nitroaromatic Compounds
by Homogeneous AOPs
Fernando S. García Einschlag, Luciano Carlos and Daniela Nichela
Instituto de Investigaciones Fisicoquímicas Teóricas y Aplicadas
(UNLP, CCT CONICET), La Plata
Argentina
1. Introduction
Nitroaromatic compounds are environmental contaminants associated with anthropogenic
activities such as production and use of dyes, explosives, pesticides and pharmaceuticals.
Many of these substances, such as nitrobenzene and nitrophenols, usually found in
wastewaters of these industries are considered potentially toxic. Because nitro-substituted
aromatic compounds have strong electron withdrawing groups, they are poorly
biodegradable by aerobic treatments. The detoxification of wastewaters containing these
hazardous substances is very difficult since, due to their high stability, they are usually
refractory to conventional biological treatments.
Research on alternative or additional methods of wastewater treatment is of current interest.
Wastewater treatment by means of advanced oxidation processes (AOPs) has become one of
the issues of major interest in modern environmental chemistry. Various AOPs are
nowadays available and applicable at laboratory, pilot or even technical levels for achieving
oxidative degradation of organic pollutants in aqueous media. These processes are based on
the production of highly reactive species. Among them, the hydroxyl radicals (HO
•
) are the
main oxidizing species. Hydroxyl radicals are able to oxidize most organic compounds due
to their high reactivity and low selectivity. The reaction of HO
•
with organic compounds (by
addition to double bonds and/or by hydrogen abstraction) generates C-centered radicals
that are subsequently trapped by dissolved oxygen to yield peroxides and peroxyl radicals.
These intermediates initiate thermal chain autooxidation reactions and the overall processes
may, if necessary, lead to complete mineralization. A clear understanding of the effect of
reagent concentrations on the evolution of reaction byproducts is critical for producing
proper engineering designs. Therefore, the optimization of AOP-methods for waste water
treatment requires a comprehensive understanding of the chemical events that govern the
transformation rates of the pollutants.
The main objective of this chapter is to provide a comprehensive description of
physicochemical phenomena that govern both the transformation rates of nitroaromatic
pollutants and the overall degradation efficiencies during waste water treatments by
different advanced oxidation processes in homogeneous phase. The chapter summarizes the
results obtained in studies related with the degradation of nitroaromatic compounds of
environmental relevance by different homogeneous AOPs. Simple tools for describing the
Waste Water - Treatment and Reutilization
216
main kinetic features of each system are presented. In addition, the influence of reaction
conditions in the transformation pathways of nitrobenzene is discussed.
2. Methods
2.1 Substrate characterization
Physicochemical properties of the organic pollutants (i.e., absorption coefficients, rate
constants, and acid-base behavior, among others) should be known to develop reaction
models capable of predicting oxidation efficiencies. Speciation of the model pollutants may
influence the kinetic trends observed in AOP systems since both the spectral behavior and
the reactivity towards HO
•
radicals depend on speciation. Speciation studies presented
include the analysis of acid base and, for Fenton systems, complexation equilibria. In
addition, spectral characterization of reaction mixtures is required for evaluating inner filter
effects in photoenhanced technologies. Another relevant parameter to be considered is the
substrate reactivity towards hydroxyl radicals since it governs the fraction of HO
•
that
effectively attack the model pollutant in a given reaction mixture. Therefore, rate constant
values are usually required to evaluate HO
•
scavenging effects. A brief summary of the
basic tools used to characterize important physicochemical properties of the benzoic acid
derivatives studied in subsections 3.6.3 and 3.7.2 is given below.
2.1.1 Acid base properties
The absorption spectra of the model substrates were recorded from pH 1.5 to pH 5.5. The
values of the first deprotonation constants (pK
a1
) were estimated by nonlinear fitting of the
absorbance versus pH profiles obtained at selected wavelengths (Nichela et al., 2010)
(
)
DDP0
AbsAbsAbsαf +−×=
(1)
where α
0
are given by 10
-pH
/ (10
-pKa
+ 10
-pH
), Abs
P
are the absorptions of the protonated
forms and Abs
D
are the absorptions of the deprotonated forms.
2.1.2 Substrate speciation and formation of ferric complexes
In order to characterize the substrate speciation conditional formation constants (K) at pH
3.0 for the 1:1 ferric complexes were estimated by nonlinear fitting of the absorbance versus
[Fe(III)] profiles at the maximum wavelengths corresponding to each ferric complex. The
following expression was used to obtain K values (Nichela et al., 2010)
()()()()
K
2
LMK41LMK1LMK
bΔεaf
00
2
2
0000
o
×××−++×−++×
××+=
(2)
where a
0
is the absorbance of the initial solution containing the free ligand; M
0
and L
0
are the
initial metal and ligand concentrations, respectively; b is the optical path length and Δε is the
difference of absorption coefficients between the complex and the ligand.
2.1.3 Evaluation of rate constants by competition kinetics
The analysis of the consumption profiles of different compounds within the same
environment in a competition experiment is a means to evaluate their relative reactivity
(Pignatello et al., 1999). Assuming that the substituted benzoic acids (S
i
) and a reference
Degradation of Nitroaromatic Compounds by Homogeneous AOPs
217
compound (S
Ref
) are solely decomposed by hydroxyl radicals, the following reactions show
the competition for the oxidizing species:
HO
•
+ S
i
→ Products k
i
(3)
HO
•
+ S
ref
→ Products k
ref
(4)
Thus, the respective consumption rates can be expressed as
•
i
ii
d[S ]
k[HO] [S]
dt
−
=
⇒
•
i
i
d ln[S ]
k [HO]
dt
=−
(5)
−
=
•
ref
ref ref
d[S ]
k[HO] [S]
dt
⇒
=−
•
ref
ref
d ln[S ]
k [HO]
dt
(6)
If no assumption for the time dependence of the concentration profile for hydroxyl radicals
is made, integration of eqns (5) and (6) yields
−=
∫
t
•
it
i
i0
0
[S ]
ln k [HO ] dt
[S ]
(7)
−=
∫
t
•
ref t
ref
ref 0
0
[S ]
ln k [HO ] dt
[S ]
(8)
From the kinetic profiles, measured for the substrate and the reference in a competition
experiment, the relative reactivity (β=k
i
/k
ref
) can be obtained by plotting ln[S
i
] against
ln[S
ref
] as described elsewhere (García Einschlag et al., 2003). Hence, if k
ref
is known the
absolute rate constant for the different substrates S
i
can be calculated as k
i
= β . k
ref
.
2.2 Monitoring the substrate transformation
Different analytical techniques are used to follow substrate consumption and product
formation, among them UV/vis, HPLC-UV/vis, HPLC-MS, GC-MS, selective electrodes
(i.e., Cl
-
and pH), IC and TOC. The reaction rates calculated from the concentration profiles
allow obtaining kinetic information, whereas the analysis of reaction intermediates
distributions are used for drawing mechanistic conclusions. Finally, the characterization of
the initial toxicity and its evolution by means of toxicity tests is recommended.
2.3 Analysis of product distributions
For a detailed study of the contribution of different reaction channels of substrate
degradation it should be taken into account that the initial attack of HO
•
to nitroaromatic
substrates produces hydroxynitrocyclohexadienyl-like radicals (HNCHD·). These radicals
subsequently form different primary products through parallel reaction pathways. The yield
of the i-th primary product (η
i
) is defined as the degraded substrate fraction that converts
into the corresponding product (X
i
) as a result of the aforementioned reaction steps. As
primary products also suffer the attack of HO
•
radicals, the calculation of η values should be
carried out by considering the following expressions describing the kinetic profiles of
nitrobenzene (NBE) and its products (Carlos et al., 2008)
Waste Water - Treatment and Reutilization
218
NBE NBE
d[NBE]
r - - k [HO ][NBE]
dt
•
==
(9)
iiNBE ii
d[Xi]
r η k [HO ][NBE] k [HO ][X ]
dt
••
== −
(10)
According to eqn (9), [HO
•
] values can be obtained from measured r
NBE
values as
NBE
NBE
r
[HO ]
k[NBE]
•
= (11)
Hence, combining eqns (10) and (11) it is possible to deduce a general expression for η
i
iii
i
NBE NBE
rkX
η
rk[NBE]
[
]
= + (12)
If only initial reaction stages are considered, product concentrations are negligible and the
second term of eqn (12) can be disregarded. Under these conditions, η
i
values can be
estimated as η
i
INI
= r
i
INI
/r
NBE
INI
which is strictly valid in the limit of zero conversion degree.
In addition, normalized yields (η
N
) may be used to compare the formation pathways of the
phenolic products, the normalization factor being the sum of their yields
N
i
i
i
η
η
η
=
∑
(13)
Normalized yields permit a more direct comparison of relative contributions of the
pathways that lead to the formation of phenols since their sum is independent from the
nitrobenzene fraction transformed into other products.
2.4 Kinetic modeling
In order to obtain quantitative expressions describing simplified reaction models, the
application of the steady state approximation for HO
•
radicals is a very useful strategy.
Thus, equations governing the production and fate of HO
•
radicals (i.e., r
Prod
HO
•
& r
Cons
HO•
=
k
app
HO•
x [HO
•
]) should be taken into account. The evaluation of r
Prod
HO
•
is presented for
both dark and irradiated systems; whereas the HO
•
scavenging factor, that governs the HO
•
lifetimes, is calculated by taking into account the main decay pathways.
3. Reaction rates and simplified reaction schemes for homogeneous AOPs
This section presents simplified reaction schemes that allowed to obtain quantitative
expressions for the experimental trends in different homogeneous AOP systems.
3.1 UV photolysis
In UV photolysis systems ultraviolet irradiation is directly absorbed by a chemical substrate
(S), this process is followed by the decomposition of the excited species transforming the
parent compound into one or more products. This transformation may involve homolytic or
heterolytic breaking of the chemical bonds. These reactions can be represented as follows
S + hν → S* → Prod P
a
S
Φ
S
(14)
Degradation of Nitroaromatic Compounds by Homogeneous AOPs
219
where P
a
S
is the rate of photons absorbed by S and Φ
S
is the quantum yield of substrate
photolysis given by eqn (15) (Braun et al., 1986)
S
S
S
S
A
a
0
d[S] dt
r
Φ
P
P(1 10 )
−
−
==
−
(15)
where r
S
is the rate of substrate transformation (mol L
-1
s
-1
), P
a
S
is the rate of photons
absorbed by the substrate S (einstein L
-1
s
-1
), P
0
is the incident photonic rate (einstein L
-1
s
-1
)
obtained by actinometry and A
S
= ε
S
.l.[S] is the absorbance of S at the wavelength of
irradiation. Given that many waste water plants use polychromatic irradiation,
polychromatic quantum efficiencies (η
S
) are a better parameter for practical purposes. The
polychromatic quantum efficiency in these processes may be calculated using eqn (16)
i
S
A
0i
i
d[S] dt
η
Pp(110)
s
−
−
=
−
∑
(16)
where d[S]/dt
is the substrate degradation rate obtained from the slope of [S] vs. irradiation
time,
A
i
is the absorbance at the i
th
irradiation wavelength, P
0
, is the total incident photon
rate, defined as the number of photons entering the solution per unit time and unit volume,
p
i
is the probability mass function of the photonic lamp emission and the factor (1–10
-Ai
)
accounts for the fraction of photons absorbed by the substrate within the reactor.
In order to test the efficiency of UV photolysis for the treatment of nitroaromatic substrates,
aqueous solutions of 1-chloro-2,4-dinitrobenzene (CDNB); 2,4-dinitrophenol (DNP);
nitrobenzene (NBE); 3-nitrophenol (MNP) and 4-nitrophenol (PNP) were irradiated at pH 2.5
using an HPK125 medium-pressure mercury arc lamp (García Einschlag et al., 2002b). In all
cases, the conversion degrees of the different substrates were less than 4% after continuous
irradiation for 2-3 h. Polychromatic quantum efficiencies were in the range 1.3×10
-4
-7.8×10
-4
.
These results are in agreement with reported quantum yields of photolysis of various aromatic
compounds that have been determined to be in the range 10
-3
- 10
-4
(Lipczynska-Kochany and
Bolton, 1991; Lopez et al., 2000). Given the low values obtained for η
S
, it is clear that UV
photolysis is a rather inefficient method for treating nitroaromatic compounds in waste water.
3.2 VUV photolysis
Water strongly absorbs at irradiation wavelengths shorter than 190 nm, the absorption cross
section increasing as the wavelength decreases between 190 and 160 nm (Heit et al., 1998).
The VUV photolysis of water may be described by the following processes
H
2
O + hν → H
•
+ HO
•
P
a
H2O
Φ
H
•
(17)
H
2
O + hν → H
+
+ HO
•
+ e
−
aq
P
a
H2O
Φ
e-
(18)
where P
a
H2O
, Φ
H
•
and Φ
e-
are the rate of photons absorbed by water, the quantum yield of H
•
formation and the quantum yield of e- formation, respectively. It is important to recall that,
given the high cross section of water molecules within the irradiation wavelength range,
P
a
H2O
= P
0
. The quantum yield for the production of solvated electrons is low (0.05) and
almost wavelength independent. In contrast, values of 0
.42 and 0.33 at 172 and 185 nm,
respectively, have been reported (Heit et al., 1998) for the quantum yield of HO
•
production
Waste Water - Treatment and Reutilization
220
(Φ
HO•
). In aerated solutions, H atoms and hydrated electrons are efficiently trapped by
dissolved oxygen, yielding hydroperoxyl radicals (HO
2
•
) and its conjugated base, the
superoxide anion (O
2
•
-
). Since the latter species are much less reactive than hydroxyl
radicals, the main pathway leading to the substrate decomposition is given by rxn (19)
S + HO
•
→ Prod k
S
(19)
The degradation of the substrate 4-chloro-3,5-dinitrobenzoic acid (CDNBA) by VUV process
was studied (Lopez et al., 2000) with two VUV irradiation sources, a low pressure mercury
arc with Suprasil envelope allowing irradiation at 185 nm and a xenon-excimer lamp
emitting at 172 nm.
time (min)
0 25 50 75 100 125 150 175
Concentration (mg C L
-1
)
0
10
20
30
40
50
CDNBA
DOC
time (min)
0 25 50 75 100 125 150 175
Concentration (mg C L
-1
)
0
10
20
30
40
50
CDNBA
DOC
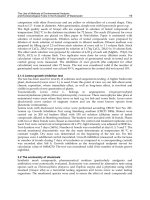
Fig. 1. Degradation of CDNBA by VUV photolysis of water. Left: 172 nm. Right: 185 nm.
Fig. 1a shows that irradiation of aerated aqueous solutions of CDNBA using the Xe-excimer
lamp resulted in a relatively fast CDNBA degradation and an efficient mineralization within
the first three hours. The disappearance of CDNBA and the DOC depletion were slightly
slower under VUV irradiation at 185 nm than at 172 nm (Fig. 1b). The initial rates of
CDNBA disappearance (r
S
) were used to obtain the apparent quantum yields of substrate
disappearance at each wavelength
S
S
app
0
r
Φ
P
=
(20)
the initial Φ
S
app
values being 1.1 × 10
−2
and 0.90 × 10
−2
at 172 and 185 nm, respectively. This
slightly lower value of
Φ
CDNBA
may result from the lower Φ
HO•
at 185 nm than at 172 nm.
The efficiency of HO
•
radicals trapping by CDNBA was obtained from ratio of Φ
CDNBA
and
Φ
HO•
values. The low value obtained at both wavelengths (approx. 0.025) is related to the
limited penetration of the VUV radiation in water. Relative high concentrations of short
lived HO
•
radicals are formed in a narrow layer around the lamp shaft, thus diffusion is not
fast enough to avoid depletion of the substrate and molecular oxygen in this layer.
3.3 UV/H
2
O
2
systems
In the UV/H
2
O
2
process, the photolysis of H
2
O
2
results in the homolysis of the oxygen-
oxygen bond and the production of hydroxyl radicals (HO
•
).
Degradation of Nitroaromatic Compounds by Homogeneous AOPs
221
H
2
O
2
+ hν → 2 HO
•
P
a
H2O2
Φ
H2O2
(21)
where P
a
H2O2
is the rate of photons absorbed by H
2
O
2
and Φ
H2O2
is the quantum yield of
H
2
O
2
photolysis. Techniques based on the use of H
2
O
2
are advantageous (Stefan et al., 1996)
since H
2
O
2
can be readily mixed with water in all proportions and costs associated to
production and handling of H
2
O
2
are not high. This process leads, in most cases, to the
mineralization of the organic substrate, i.e. production of CO
2
, H
2
O, and mineral acids.
We studied the degradation of the substrates CDNBA, CDNB, DNP, MNP, NBE and PNP by
the UV/H
2
O
2
process (García Einschlag et al., 2002a; García Einschlag et al., 2002b).
Dramatic changes in the absorption spectra were observed indicating that nitroaromatic
substrates are rapidly consumed under these conditions. The degradation rates were
strongly dependent on substrate and H
2
O
2
concentrations. The initial rates of substrate
disappearance (
r=-d[S]/dt) under different conditions show that when increasing the
concentration of H
2
O
2
, a maximum rate (r
max
) could be observed. When increasing the initial
substrate load [S]
0
, the optimal H
2
O
2
concentration ([H
2
O
2
]
OPT
, defined as the initial H
2
O
2
concentration for which
r
max
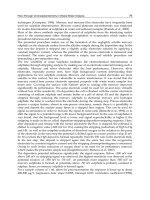
was reached) increased proportionally. Fig. 2 shows the
behavior of the
r/r
max
represented as a function of the parameter R (defined as [H
2
O
2
]
0
/[S]
0
).
MNP
R
0 150 300 450 600
r
S
/ r
MAX,S
0.0
0.4
0.8
1.2
6.47x10
-4
M
DNP
R
0 150 300 450 600
r
S
/ r
MAX,S
0.0
0.4
0.8
1.2
2.71x10
-4
M
4.87x10
-4
M
8.13x10
-4
M
CDNB
R
0 150 300 450 600
r
S
/ r
MAX,S
0.0
0.4
0.8
1.2
1.48x10
-4
M
2.96x10
-4
M
4.44x10
-4
M
NBE
R
0 150 300 450 600
r
S
/ r
MAX,S
0.0
0.4
0.8
1.2
1.51x10
-4
M
3.10x10
-4
M
PNP
R
0 150 300 450 600
r
S
/ r
MAX,S
0.0
0.4
0.8
1.2
2.48x10
-4
M
5.70x10
-4
M
CDNBA
R
0 150 300 450 600
r
S
/ r
MAX,S
0.0
0.4
0.8
1.2
1.62x10
-4
M
3.29x10
-4
M
Fig. 2. Normalized initial consumption rates for the different substrates in UV/H
2
O
2
processes.
Interestingly, optimal concentration ratios
R
OPT
(=[H
2
O
2
]
OPT
/[S]
0
) were independent of [S]
0
.
As [H
2
O
2
]
0
increased for a given [S]
0
, a remarkable change in the initial rate was observed,
but when
R > R
OPT
, this rate showed a smooth decrease. This behavior is of great importance
from both a practical and an economical point of view, since there is a wide range of
R
values corresponding to oxidation rates of at least 90% of the optimal rate.
The degradation of pollutants by the UV/H
2
O
2
technique involves a complex set of
reactions. Although a detailed analysis of all the reactions involved in the oxidative
degradation manifold of each compound is a very difficult task (Glaze et al., 1995; Stefan
and Bolton, 1998; Crittenden et al., 1999; Stefan et al., 2000), the general trends observed are
Waste Water - Treatment and Reutilization
222
very similar (Fig. 2). Hence, we proposed a simple kinetic model for describing the observed
behavior (García Einschlag et al., 2002b). During the initial oxidation stages, only S and
H
2
O
2
are present in substantial amounts. Accordingly, the HO
•
radicals generated by H
2
O
2
photolysis rxn (21) may be trapped either by the substrates rxn (19) or by H
2
O
2
rxn (22)
H
2
O
2
+ HO
•
→ HO
2
•
+ H
2
O k
H2O2
(22)
Reactions implying HO
2
•
or O
2
•-
have not been considered, as their reactivity is much lower
than that of HO
•
(Simic, 1975; Nadezhdin and Dunford, 1979; Getoff, 1997). A similar
remark applies to the reactions associated with the intermediate products, whose
concentrations during the first irradiation stages may be neglected. UV photolysis of the
substrates was also disregarded (see section 3.1).
3.3.1 Initial degradation rates under monochromatic irradiation
According to the reduced set of reactions proposed, the substrate consumption rate (r) is
governed by
S
d[S]
r k [S] [HO ]
dt
•
−
==
(23)
Assuming that the steady-state hypothesis holds for HO
•
, their concentration is given by
22
HO
HO 2 2 S
r
[HO ]
k [H O ] k [S]
•
•
=
+
(24)
where r
HO
stands for the rate of HO
•
production. Under monochromatic irradiation, r
HO
may be expressed as
22 22
22
HO HO
-A
0 2 2
HO
S
HO
22
2 P Φ (1- 10 ) ε [H O ]
r
ε [H O ] ε [S]
•
=
+
(25)
where (1-10
-A
)[(ε
H2O2
[H
2
O
2
])/(ε
H2O2
[H
2
O
2
] + ε
S
c
S
)] is the fraction of photons absorbed by
H
2
O
2
. Combining eqns (23), (24) and (25) and assuming absorbance values greater than 2,
the oxidation rate of the substrate (r) may be expressed as (García Einschlag et al., 2002b)
22
HO
0
2 P ΦεR
r
(ε R 1) (k R 1)
=
++
(26)
where R=[H
2
O
2
]
0
/[S]
0
, ε=ε
H2O2
/ε
S
and k=k
H2O2
/k
S
. The optimal ratio R
OPT
leading to the
highest initial rate can be obtained by differentiation of eqn (26) (i.e. R=R
OPT
for dr/dR=0)
22
22
S
S
OPT
HO
HO
k ε
1
R
k ε
k ε
== (27)
This simple expression of R
OPT
(=[H
2
O
2
]
OPT
/[S]
0
) might be used, either to evaluate [H
2
O
2
]
OPT
if k
S
and ε
S
are known or to estimate k
S
if [H
2
O
2
]
OPT
is determined experimentally. The
validity of eqns (26) and (27) was tested by comparing experimental and simulated trends of
the oxidation rates. Solid lines in Fig. 2 were calculated using eqn (26).
Degradation of Nitroaromatic Compounds by Homogeneous AOPs
223
3.3.2 Initial degradation rates under polychromatic irradiation
The previous ideas can be extended to processes induced by polychromatic irradiation
sources. A typical HPK125 lamp exhibits a continuous background and various emission
lines. Therefore, the rate of photon absorption by hydrogen peroxide,
P
a
H2O2
, is described by
22
λ
22
0
22
HO
A
HO
22
λ
a λ
HO
S
22 λ
λ
λ
(1 - 10 ) ε [H O ]
P P pd
λ
ε [H O ] ε [S]
−
=
+
∫
(28)
where the quantity A
λ
represents the total absorbance of the solution, ε
λ
H2O2
and ε
λ
S
are the
molar absorption coefficients of substrate and H
2
O
2
at a given wavelength, and p
λ
is the
probability density function of the photonic emission. Although this integral cannot be
solved in a simple way, the calculation of
P
H2O2
can be carried out as a discrete sum. Eqn (28)
was solved for the wavelength range between 200 and 500 nm
22
i
HO 0
22
22
HO
A
22
i
i
HO
S
i
22 i
i
ε [H O ]
P P p(1-10)
ε [H O ] ε [S]
−
=
+
∑
(29)
where subscript i refers to a very small finite wavelength interval (i.e., 1 nm) and p
i
is the
probability mass function of the photonic emission of the lamp. Thus, the expression
equivalent to eqn (26) under polychromatic irradiation turns out to be
22
0
S
HO
ii
i
i
i
p Φε R
2 P
r
(k R 1) (ε R1)
=
++
∑
(30)
where ε
i
=ε
i
H2O2
/ε
i
S
. As already indicated r
S
exhibits a maximum at R
OPT
. After setting
d
r
S
/dR = 0 the following expression can be obtained (García Einschlag et al., 2002a)
22 22
OPT
OPT OPT
HO HO
22
ii ii
ii
22
ii
ii
p Φ ε p Φ ε R
k
(ε R1) (ε R1)
=
++
∑∑
(31)
It is clear that the latter equation cannot be rearranged to obtain R
OPT
since it is an implicit
equation (in R
OPT
). In order to obtain an expression for R
OPT
we defined the quantity f(i) as
22
OPT
HO
ii
i
2
i
p Φ ε
f(i)
(ε R1)
=
+
(32)
which is a function of the spectral and kinetic properties of the system. Eqn (31) may be
rearranged to give (García Einschlag et al., 2002a)
22
S
OPT
HO
22
1
HO
S
k ε
R
k
ε
−
= (33)
where <ε
H2O2
/ε
S
> is the statistical expectance of the ratio ε
i
H2O2
/ε
i
S
, the quantity f(i) being the
probability distribution function. Although eqn (33) does not allow the calculation of
R
OPT
, it
is interesting to note its similarity with eqn (27) derived for monochromatic irradiation.