Waste Water Treatment and Reutilization Part 11 docx
Bạn đang xem bản rút gọn của tài liệu. Xem và tải ngay bản đầy đủ của tài liệu tại đây (3.76 MB, 30 trang )
Purification of Waste Water Using Alumina as Catalysts Support and as an Adsorbent
289
palladium adsorption decreased below that of alumina dissolution. The amount of PdCl
4
2-
on alumina is limited by the (i) strong electric forces of adsorbed species and (ii) dissolution
of alumina. However, it is clear that some amount of the adsorbed PdCl
4
2-
is detached
together with Al
3+
during the dissolution process. Therefore, it can be assumed that one
important consequence of alumina dissolution, in addition to the effect of ionic strength, is
the retardation of PdCl
4
2-
adsorption.
y = 0.1078x + 3.2865
R
2
= 0.9928
y = 0.2057x
R
2
= 0.9942
y = 0.1263x
R
2
= 0.9715
y = 0.0401x + 1.7372
R
2
= 0.9908
0
4
8
12
16
0 20406080100
Time / h
[H
+
] cons. /
μ
mol m
-2
(a)
0
0.2
0.4
0.6
0.8
0204060
Time / h
[Pd]
ads.
/
μ
mol m
-2
(b)
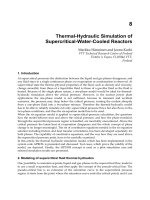
Fig. 7. Time course of (a) proton consumption and (b) adsorption density of PdCl
4
2-
on
alumina, during the impregnation of γ-Al
2
O
3
with PdCl
4
2-
at pH 3.5 (x) and pH 4 (◊).
To find out whether the proton consumption is affected by PdCl
4
2-
adsorption, the ratio
between [H
+
]
cons.
and [Al
3+
]
sol.
is analyzed in Table 1. From Table 1, it is clear that PdCl
4
2-
does not promote alumina dissolution, because the rate between [H
+
]
cons.
and [Al
3+
]
sol.
remained practically constant (~ 4.2), regardless of whether PdCl
4
2-
was present or not in the
solution. If PdCl
4
2-
would promote alumina dissolution, the proton consumption should
decrease significantly in comparison to the amount of Al
3+
formed. In practice, only the rate
of alumina dissolution was affected by PdCl
4
2-
. It is likely that one of the reasons for the
retardation of PdCl
4
2-
adsorption is alumina dissolution.
[H
+
]
cons.
/[Al
3+
]
sol.
experiment time/h pH system
3.99 72 3.5 Al
2
O
3
+ H
+
4.24 74 3.5 Al
2
O
3
+ H
+
+ PdCl
4
2-
4.23 70 4.0 Al
2
O
3
+ H
+
4.19 50.5 4.0 Al
2
O
3
+ H
+
+ PdCl
4
2-
Table 1. Influence of PdCl
4
2-
on [H
+
]
cons.
/[Al
3+
]
sol.
ratio at pH 3.5 and 4
In the course of PdCl
4
2-
impregntion, three types of simultaneous process could be analyzed:
(I) alumina dissolution, (II) proton consumption, and (III) adsorption density of PdCl
4
2-
on
the surface of alumina. It was observed that some amount of support was mobilized in the
liquid phase during impregnation. The amount of dissolved alumina depends on the pH of
the solution as well as on the nature of the impregnating ion (PdCl
4
2-
). It was demonstrated
that the protons are consumed in two distinct processes, i.e., reversible adsorption of H
+
(Langmuir-type adsorption) and irreversible adsorption of H
+
(leading to dissolution of
alumina). A clear distinction between the reversible and irreversible adsorbed proton has
been made for the first time.
Alumina dissolution during impregnation may have significant consequences on the
formation of the catalytic active phase. It is expected that aluminum ions, originating from
Waste Water - Treatment and Reutilization
290
the support, will always be present in the catalytic phase (i.e., palladium phase), inducing
the formation of lattice defects (Balint & Aika, 1997). Therefore, the aluminum presence in
the palladium active phase should be taken into consideration in explaining the catalytic
behavior in a chemical reaction.
3. Alumina as catalytic support
3.1 Effect of support on active site formation
Alumina is frequently used as a support for metal catalysts due to its high surface area and
good thermal stability. However, as shown above, alumina can be dissolved during the
process of impregnation. The dissolution of alumina is induced by adsorption of heavy
metal ions. Then, dissolved aluminum species may be included in the newly formed phase
on the surface of the support, which is the precursor of active site. It is highly possible that
such contamination of active site by aluminum may have significant effect on catalyst
performance. In order to assess the effect of possible aluminum inclusion in the active site,
Ru/Al
2
O
3
catalysts were prepared by two different methods; one is conventional
impregnation and the other is metal colloid synthesis and supporting them onto alumina
support (Miyazaki et al, 2001). Then, their performance in ammonia synthesis was
compared (Balint & Miyazaki, 2007).
Ruthenium is known to have one of the highest catalytic activities for ammonia synthesis
(Aika, 1994). Typically, the conventional Ru catalysts are prepared by impregnation of the
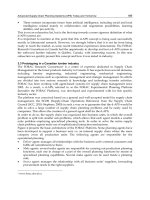
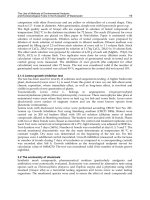
Fig. 8. TEM image of 6.3% Ru/Al
2
O
3
. Some typical Ru particles are indicated by arrows.
oxide support either with and aqueous solution of RuCl
3
· 3H
2
O or with Ru
3
(CO)
12
dissolved
in tetrahydrofuran (Murata & Aika, 1992a, b). When catalysts are prepared by impregnation
of alumina with RuCl
3
, the metal particles, after drying, calcinations, and reduction, are not
uniform in size and shape. It is well known that the catalytic activity of a supported metal is
strongly related to the morphology of the particle, i.e., size and shape (Ahmadi, et al., 1996).
However, the conventional preparation of catalysts, consisting of the impregnation of a
support with an aqueous solution of a soluble metal precursor, makes it difficult to control
the final size and shape of the supported metal particles. Additionally, it is highly possible
that the support has a great influence on the catalytic activity of the metal when the catalyst
is prepared by impregnation. An alternative method to obtain supported catalysts with
well-defined metal particles is the preparation of supported catalysts from metal colloids.
Purification of Waste Water Using Alumina as Catalysts Support and as an Adsorbent
291
The great advantage of the colloid method is that it provides relatively monodispersed
metal particles. Moreover, it is shown that not only the particle size but also the crystal
structure of the metal nanoparticles can be controlled to some extent by using appropriate
structure-directing polymers for colloid preparation (Miyazaki, et al., 2000).
Ru colloid was prepared by reducing RuCl
3
· nH
2
O in ethylene glycol. The average diameter of
the particle measured by TEM was 5 nm. The colloid particles were supported on γ-Al
2
O
3
(Aerosil) to realize the Ru loading of 6.3 wt%. Figure 8 shows the TEM image of Ru/Al
2
O
3
.
EPMXA measurement proved that the black spots corresponded to ruthenium particles. It can
be seen that the Ru particles was uniform in size and shape, and they were dispersed well on
the surface of γ-Al
2
O
3
. The particle size of Ru obtained by TEM was 4.2 nm. This value agreed
well with the values obtained by H
2
and CO chemisorption; 4.8 and 5.4 nm, respectively. It is
noteworthy that by using colloid method, Ru particles can be supported without affecting the
particle size and dispersion, even when the metal loading was increased up to 6.3%.
0
200
400
600
800
1000
550 600 650 700 750 800
Rate of NH
3
formation
[μmol g
-1
h
-1
]
T [K]
conventional Ru/Al
2
O
3
promoted
Ru/Al
2
O
3
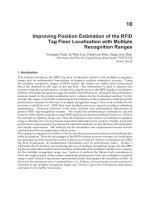
Fig. 9. Temperature dependence of the rate of ammonia synthesis over Ru/Al
2
O
3
(6.3 wt%).
The rates over conventional Ru/Al
2
O
3
catalysts are also shown for comparison.
The catalytic activity of Ru/Al
2
O
3
was measured for ammonia synthesis. The catalytic tests
were performed at atmospheric pressure in a stainless steel reactor containing 0.4 g of 6.3 wt %
Ru/Al
2
O
3
. Prior to the catalytic tests, the Ru/Al
2
O
3
was pelletized, crushed, and then sieved.
The fraction, from 335 to 1000 μm, was collected and loaded into the reactor. Before the test,
the sample was reduced in H
2
flow at 550˚C for 2 h. The catalytic activity tests were carried
out at a flow rate of the reaction mixture 60 cm
3
/min STP (45 cm
3
/min H
2
and 15 cm
3
/min
N
2
). The rate of ammonia synthesis was measured in a 365 to 500˚C temperature range. The
produced ammonia was trapped by 1 · 10
-3
mol/L solution of sulfuric acid, and the rate of
ammonia formation was determined from the decrease in the conductivity of the solution.
The catalyst which was prepared by supporting the Ru colloid on γ-Al
2
O
3
showed a
remarkably high activity for ammonia synthesis. The reaction rates expressed as micromoles
per gram-hour as a function of temperature are shown in Fig. 9. Figure 9 shows that the rate of
ammonia synthesis over 6.3 wt% of Ru/Al
2
O
3
increased progressively with an increase in
temperature, reaching a maximum at 723 K. Above this temperature, the reaction is
thermodynamically limited and therefore the overall rate decreased. The highest reaction rate
of 923 μmol g
-1
h
-1
was observed at 723 K. The reproducibility at each reaction temperature
was within the range of experimental error (± 25 μmol g
-1
h
-1
). Apparent activation energy of
76.9 kJ/mol was estimated, and this value agreed well with the previously published data. For
Waste Water - Treatment and Reutilization
292
example, the apparent activation energies determined for promoted and nonpromoted
Ru/Al
2
O
3
catalysts range between 44 and 101 kJ/mol (Murata & Aika, 1992a,b).
From the above results there are two points that are worthy of note. One is the temperature
of highest activity for ammonia synthesis. The highest activity of the conventional Ru/Al
2
O
3
catalysts was observed at 315˚C (Murata & Aika, 1992), whereas the catalyst prepared from
the Ru colloid had a maximum activity at a higher temperature, 450˚C (723 K). From
industrial point of view, it is preferable for ammonia synthesis to have a catalyst that is
more active at a lower temperature. Thermodynamically, the increase in temperature is not
favourable for ammonia synthesis reaction. Therefore, it is of great interest to obtain the
higher equilibrium conversions at lower temperatures.
The other point is that Ru/Al
2
O
3
catalysts prepared from the Ru colloid showed unusually
high activity although it was not promoted. The conventional Ru/Al
2
O
3
catalysts are known
to exhibit quite low activities for ammonia synthesis, and this has been attributed to the
acidity of alumina. The addition of alkaline or lanthanide promoters was reported to be an
effective way of enhancing the catalytic activity (Murata & Aika, 1992a). The highest
catalytic activities of the promoted and nonpromoted Ru/Al
2
O
3
catalysts prepared by
conventional methods using RuCl
3
or Ru
3
(CO)
12
as precursors together with the activity of
the catalyst prepared from the Ru colloid are shown in Fig. 9. The reported activity of the
nonpromoted conventional Ru/Al
2
O
3
catalysts is very small, ranging from 10 to 60 μmol g
-1
h
-1
. It was reported that the nonpromoted catalysts prepared from RuCl
3
exhibited
significantly lower activities as compared to those obtained from Ru
3
(CO)
12
.
The acidity of alumina has been considered to be the main reason for the low activity of the
conventional Ru/Al
2
O
3
catalysts for ammonia synthesis. The addition of alkaline (Cs, Rb, K)
or rare earth (La, Ce, Sm) elements to Ru/Al
2
O
3
leads to a significant increase in the catalytic
activity (Murata & Aika, 1992b, Moggi, et al., 1995). Typically, the activity of the promoted
Ru/Al
2
O
3
catalysts ranges from 130 to 250 μmol g
-1
h
-1
(Fig. 9). The Ru/Al
2
O
3
catalyst
prepared from the Ru colloid showed a significantly higher activity than that from
promoted catalysts. A notable exception is the K
+
-promoted Ru/Al
2
O
3
catalyst, prepared
from Ru
3
(CO)
12
, whose catalytic activity for ammonia synthesis was reported to be 2470
μmol g
-1
h
-1
under conditions comparable to those shown in Fig. 9 (0.4 g catalyst, 60 ml
min
-1
) (Moggi, et al., 1995). However, the activity of the conventionally prepared Ru
catalysts strongly depend on the conditions of preparations. Slight changes of the
preparation variables result in significant changes in catalytic activity.
The differences observed between the Ru/Al
2
O
3
catalysts prepared by the conventional
impregnation methods and the catalyst obtained via colloid deposition raise problems
regarding the role that supports play in the formation of catalytically active phases. In the
former part of this chapter, we reported that the support (alumina) plays an essential role in
the formation of the active phase(s) when the catalysts were prepared by the impregnation
method. The impregnation process can be regarded as complex sequences of chemical
reactions taking place at the solid (the support)-liquid (solution of the metal salt) interface.
During the impregnation process, the metal particles, i.e., the active site of the catalysts, are
contaminated more or less by the supports. In this case, the acid or base character of the
supports plays an important role in determining the final catalyst activity. In contrast to the
impregnation method, metal colloid deposition onto a support gives metal particles that are
uncontaminated by the support. Therefore, the influence of the support on the metallic
active phase is minimized. The Ru/Al
2
O
3
catalyst prepared by Ru colloid, is supposed to
have Ru nanoparticles that do not interact significantly with the support, and this should be
the reason for the remarkably high catalytic activity demonstrated for ammonia synthesis.
Purification of Waste Water Using Alumina as Catalysts Support and as an Adsorbent
293
3.2 Support as adsorbent
Nitrate and nitrite ions are one of the world’s major pollutants of drinking-water resources. In
order to remove nitrate and nitrite ions in drinking water, physicochemical methods (e.g. ion
exchange, reverse osmosis, and electrodialysis) and biological denitration methods have been
studied (Fanning, 2000). However, these methods have disadvantages, in that they are
consuming, complex, and sometimes require costly post-treatment of the effluent. The catalytic
reduction of nitrate and nitrite in the liquid phase with hydrogen over a solid catalyst has
recently been confirmed to be a promising method for the treatment of drinking water (Corma,
et al., 2004). The most widely used catalyst is Pd-Cu/Al
2
O
3
. On the other hand, the catalytic
performance of the Pt-Cu/Al
2
O
3
catalyst is comparable to that of Pd-Cu/Al
2
O
3
(Gauthard,
2003). Alumina is a typical support used in this reaction. The reduction of nitrate is known to
proceed in two reaction steps, i.e., reduction of nitrate to nitrite and further reduction of nitrite
to N
2
(desired product) and/or NH
4
+
(byproduct). Epron et al., (2001) found that two metal
components of the catalyst are active for distinct reasons. Less noble metals, such as Cu, are
catalytically active for the reduction of nitrate to nitrite, whereas the nitrite is reduced on the
surface of noble metals, i.e., Pd or Pt. However, the two reactions do not seem to be completely
independent of each other. Gao et al., (2003) reported that the bimetallic Pd-Cu catalyst
(especially in the case of Pd:Cu = 2:1 molar ratio) exhibits much higher activity for nitrite
reduction compared with the monometallic palladium catalyst.
In studies of the catalytic reductions of nitrate and nitrite, the catalytic activity is generally
calculated from the decrease in the concentration of nitrate or nitrite ions in the reaction
solution. In practice, the nitrate and nitrite ions that disappear from the reaction solution are
presumed to be converted to N
2
and NH
4
+
, without taking the possibility of adsorption onto
the catalyst into account. In fact, there is very little information regarding to the nitrate
and/or nitrite adsorption onto alumina; however, there have been recent reports regarding
such adsorption (Handa et al., 2001, Kney et al., 2004, Ebbesen, et al., 2008). If significant
amounts of nitrate or nitrite ions are adsorbed onto an alumina support, then such
adsorption phenomena should be taken into consideration when the catalytic activity of
denitration is calculated, especially for batch experiments. Measurement of the actual
catalytic activity for liquid phase reduction of nitrate is an important issue, due to the
potential application of this method. Conversion over denitration catalyst must be
significantly high to overcome the regulation limits, and this is one of the critical point that
would allow or prevent practical applications. Therefore, it is necessary to evaluate the
amounts of nitrate and nitrite ions removed from the reaction solution, not only by reaction,
but also by adsorption. Therefore, adsorption of nitrite onto alumina and Pt/Al
2
O
3
was
focused (Miyazaki et al., 2009). Nitrite was selected because it is the reaction intermediate of
the nitrate reduction reaction, and because its toxicity is higher than nitrate.
NO
2
-
catalytic reduction experiments were performed in a four-neck flask. The necks were
used for the Ar (inert gas) inlet, H
2
(reduction gas) inlet, and gas outlet, and for sampling of
the liquid phase, respectively. One hundred and fifty milliliters of the 2 mmol/L NaNO
2
solution was stirred in a flask with a magnetic stirrer and the solution was kept at 25˚C
using a water bath. γ-Al
2
O
3
(Aerosil) or Pt/Al
2
O
3
(0.3 g) was then added to the nitrite
solution. Prior to the reduction, dissolved air in the suspension was removed by bubbling
Ar gas for 20 min. H
2
gas was then bubbled into the solution with a flow rate of 10 min/min.
Two milliliter aliquots of the reaction solution were sampled periodically and filtered
immediately. The concentrations of NO
2
-
and NH
4
+
ions in the solution were measured
using a UV-vis spectrophotometer.
Waste Water - Treatment and Reutilization
294
On the other hand, adsorption experiments were performed in the same manner as the
reduction experiments, excepting H
2
flow. Ar gas was continuously bubbled in the
suspension, so that no NO
2
-
loss by reduction was presumed to occur, due to the absence of
reductant H
2
gas.
A catalytic reduction experiment was performed using γ-Al
2
O
3
without Pt in the presence
and absence of H
2
flow. The concentration of NO
2
-
decreased, even though there was no
noble metal on the support (Fig. 10). In the catalytic reduction of nitrate, the reduction of
nitrite by H
2
to N
2
and/or NH
4
+
is reported to take place on the surface of supported noble
0
0.4
0.8
1.2
1.6
2
0 50 100 150 200
Time [min]
NO
2
-
[mmol/L]
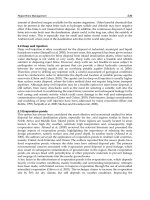
Fig. 10. Time course of nitrite concentration in the reacting solution. Experiment was
performed with H
2
flow (z) and without H
2
flow (|).
metal particles. It is generally assumed that the catalytic activity can be ascribed only to the
supported metal (i.e., Pd and Pt), and that the support (i.e., alumina, silica, carbon, etc.) is
completely inert (Epron, 2002). Therefore, the decrease of NO
2
-
in the presence of H
2
may
not be due to catalytic conversion. To confirm this, the same experiment was performed
without the reductant (H
2
gas). Interestingly, a decrease in NO
2
-
concentration was also
observed as shown in Fig. 10. In both cases, no formation of NH
4
+
(product) was observed.
Thus, the decrease in NO
2
-
concentration was not due to reduction, i.e., alumina was
completely inert toward NO
2
-
reduction. Therefore, the disappearance of NO
2
-
is attributed
to adsorption on alumina. The result showed that around 30% of the initial amount of NO
2
-
was absorbed after 100 min of reaction time.
0.8
1
1.2
1.4
1.6
1.8
2
0 50 100 150 200
Time [ m i n ]
Concentration [mmol/L]
adsorption
Converted to NH
4
+
Converted to N
2
Fig. 11. 2 mmol/L NaNO
2
was reduced by H
2
gas on 0.1 wt% Pt/Al
2
O
3
catalyst. The
decrease of NO
2
-
(○) was found to be caused by catalytic conversion to N
2
or NH
4
+
, and by
adsorption onto alumina (Δ).
Purification of Waste Water Using Alumina as Catalysts Support and as an Adsorbent
295
Because a significant amount of NO
2
-
was found to be adsorbed onto alumina, the
adsorption experiment was performed using a 1 wt% Pt/Al
2
O
3
catalyst, in order to
determine whether the same adsorption phenomena occurred on Pt supported catalyst.
Figure 11 shows the result of both the adsorption and reduction experiment on 1 wt%
Pt/Al
2
O
3
catalyst. The Pt/Al
2
O
3
catalysts were prepared by impregnation using aqueous
solution of K
2
PtCl
4
. The Pt/Al
2
O
3
catalysts were pelletized, crushed, and then sieved. The
fraction of powder with size from 335 to 1000 μm was collected. The adsorption experiment
was carried out in the absence of H
2
, whereas the catalytic reduction was performed under
H
2
flow. The H
2
flow induces the reduction of NO
2
-
over Pt; therefore, it is not possible to
evaluate the amount of adsorbed NO
2
-
under H
2
flow. In the absence of a H
2
flow, the
concentration of NO
2
-
was decreased with the 1wt% Pt/Al
2
O
3
catalyst. The adsorption
behaviour of NO
2
-
onto 1wt% Pt/Al
2
O
3
catalyst was similar to that on alumina without Pt.
For both cases, the adsorption equilibrium was reached after 100 min of reaction time. As
much as 24% of the NO
2
-
was adsorbed on the 1wt% Pt/Al
2
O
3
catalyst.
The calculation of NO
2
-
conversion and selectivity to N
2
can be subjected to significant error
if adsorption by the support is not taken into consideration. There are very few papers
discussing the adsorption of NO
3
-
or NO
2
-
on the support, as well as possible influence of
the supporting metal on the metal catalytic activity. If adsorption of NO
2
-
onto the catalyst
occurred during the reduction experiment, the actual amount of NO
2
-
catalytically converted
should be obtained as the difference between the amount of NO
2
-
removed by catalytic
reduction and by adsorption. According to this assumption, NO
2
-
conversion with 1wt%
Pt/Al
2
O
3
was calculated to be 31.5% at 190 min, but 55.5% if adsorption is not considered.
Adsorption of NO
2
-
onto the catalyst has an even more dramatic effect on the selectivity to
N
2
production. Generally, the catalytic reduction of NO
3
-
and NO
2
-
is monitored by
analyzing the species in the liquid phase, i.e., by measuring the concentration of NO
3
-
, NO
2
-
and NH
4
+
ions in the reaction solution. In most cases, the gaseous products (i.e., N
2
) are not
quantitatively determined (Epron, 2001). If adsorption is not considered, then the selectivity
to N
2
on 1wt% Pt/Al
2
O
3
is calculated to be 49.5%, while the selectivity is only 11.1% if
adsorption is taken into account. In the reduction experiment on 1wt% Pt/Al
2
O
3
, an attempt
was made to detect gaseous N
2
by gas chromatography; however, the detectable amounts
were negligible. The mass balance suggested that the decrease of NO
2
-
in the reaction
solution can be ascribed to either adsorption onto the catalyst or conversion to N
2
and NH
4
+
.
NO
2
-
adsorption on Pt/Al
2
O
3
is of great practical importance, because Pt/Al
2
O
3
is one of the
most common catalysts used to reduce NO
2
-
and NO
3
-
in waste waters by reduction with H
2
.
Thus, it is necessary to make a clear distinction between the NO
2
-
ions removed from a
reaction solution by catalytic reaction (reduction) and those removed by adsorption. One the
other hand, alumina has a possible application as NO
2
-
scavenger in the treatment of waste
water, due to its relatively high adsorption capacity for NO
2
-
ions.
4. Conclusion
Two aspects of alumina, i.e., heavy metal adsorbent and catalysts support, were discussed
and it was shown that they are closely related each other. Alumina is one of the most
frequently used adsorbent to remove heavy metal ions from waste water. The adsorption
process of heavy metal cations onto alumina is not a simple phenomenon but a complex
process composed by three main steps, i.e., adsorption, desorption and re-sorption. The first
adsorption step can be explained as surface complexation between heavy metal cation and
Waste Water - Treatment and Reutilization
296
surface aluminol groups. However, the adsorbed heavy metal cations can be desorbed by
accomplishing some surface coverage. It was shown that the formation of hydroxide of the
heavy metal is the reason for this process. In the desorption process, alumina was found to
be dissolved, too. Then, in the third step, aluminium ions dissolved from alumina may
coprecipitate with desorbed heavy metal cations. Alumina dissolution was proved to be
induced not only heavy metal cations (Zn
2+
and Cu
2+
), but also anions, PdCl
4
2-
in acid pH
range.
Alumina dissolution induced by heavy metal adsorption must have significant impact for
heavy metal behaviour in natural aquatic systems and catalyst active site formation.
Actually, Ru/Al
2
O
3
catalysts prepared by impregnation and colloid showed quite different
activity for ammonia synthesis. The difference must be caused by the composition of active
site. In the case of colloid, ruthenium particles do not contain aluminium, but the active site
of the catalyst prepared by impregnation must include aluminium, which was dissolved in
the process of impregnation. On the other hand, alumina used as catalyst support can play a
role of adsorbent, too. When NO
2
-
was reduced on the surface of Pt/Al
2
O
3
catalyst,
significant amount of NO
2
-
was found to be adsorbed on the support. Thus, in order to
adequately evaluate conversion and selectivity of the catalyst, it is necessary to take into
account the adsorption.
The two different aspect of alumina, i.e., adsorbent and support, are closely related to each
other and both are quite important for waste water treatment. Therefore, in near future, it is
very necessary to study the relation between these two roles of alumina and apply it to
waste water treatment.
5. References
Aika, K. (1994). Synthetic process of ammonia. Petrotech, 17, 2, 127-132, 0386-2963
Agaras, H.; Cerella, G. & Laborde, M. A. (1988). Copper catalysts for the steam reforming of
methanol: analysis of the preparation variables. Appl. Catal. 45, 1, 53-60, 0166-9834
Armadi, T. S.; Wang, Z. L.; Green, T. C.; Henglein, A. & El-Sayed. M. A. (1996). Shape-
controlled synthesis of colloidal platinum nanoparticles. Science, 272, 1924-1926,
0036-8075
Baldwin, T. R. & Burch, R. (1990). Catalytic combustion of methane over supported
palladium catalyst. I. Alumina supported catalysts. Appl. Catal. 66, 2, 337-358, 0166-
9834
Balint, I. & Aika, K. (1997). Defect chemistry of lithium-doped magnesium oxide. J. Chem.
Soc. Faraday Trans., 93, 9, 1797-1801, 0956-5000
Balint, I. & Miyazaki, A. (2007). Minimization of the metal-support interaction by using Ru
nanoparticles for ammonia synthesis. Trans. Mater. Res. Soc. Jpn., 32, 2, 387-390,
1382-3469
Balint, I.; Miyazaki, A. & Aika, K. (1999). Alumina dissolution promoted by CuSO
4
precipitation. Chem. Mater., 11, 2, 378-383, 0897-4756
Balint, I.; Miyazaki, A. & Aika, K. (2001). Alumina dissolution during impregnation with
PdCl
4
2-
in the acidic pH range. Chem. Mater., 13, 3, 932-938, 0897-4756
Bold, G. H. & Van Riemsdijk, W. H. (1987). Surface chemical processes in soil, In: Aquatic
Surface Chemistry, Stumm, W. (Ed.), 127-164, Jhon Willy & Sons, 0-471-82995-1, New
York
Purification of Waste Water Using Alumina as Catalysts Support and as an Adsorbent
297
Caillerie, J. B. E.; Kermarec, M. & Clause, O. (1995). Impregnation of gamma-alumina with
Ni(II) or Co(II) ions at neutral pH: hydrotalcite-type coprecipitate formation and
characterization. J. Am. Chem. Soc., 117, 11471-11481, 0002-7863
Contescu, C. & Vass, M. I. (1987). Effect of pH on the adsorption of palladium (II) complexes
on alumina. Appl. Catal. 33, 2, 259-271, 0166-9834
Corma, A.; Palmares, A. E.; Rey, F. & Prato, J. G. (2004). Catalytic reduction of nitrates in
natural water: is this realistic objective? J. Catal., 227, 561-562, 0021-9517
Dobbs, A. J.; French, P.; Gunn, A. M.; Hunt, D. T. E. & Winnard, D. A. (1989). Aluminum
speciation and toxicity in upland waters, In: Environmental Chemistry and Toxicology
of Aluminum, Lewis, T. E., (Ed.), 209-228, Lewis Publishers, Inc., 0-87371-194-7,
Michigan
Dumas, J.; Geron, G.; Kribbi, A. & Barbier, J. (1989). Preparation of supported copper
catalyst. II. Reduction of copper/alumina catalysts. J. Appl. Catal., 47, L9-L15, 0936-
860X
Ebbesen, S. D. ; Mojet, B. L. & Lefferts, L. (2008). In situ attenuated total relfection infrared
(ATR-IR) study of the adsorption of NO
2
-
, NH
2
OH, and NH
4
+
on Pd/Al
2
O
3
and
Pt/Al
2
O
3
. Langmuir, 24, 869-879, 0743-7463
Epron, F.; Gauthard, F.; Pineda, C. & Barbier, J. (2001). Catalytic reduction of nitrate and
nitrite on Pt-Cu/Al
2
O
3
catalysts in aqueous solution: role of the interaction between
copper and platinum in the reaction. J. Catal., 198, 2, 309-318, 0021-9517
Epron, F.; Gauthard, F. & Barbier, J. (2002). Catalytic reduction of nitrate in water on a
monometallic Pd/CeO
2
catalyst. J. Catal., 206, 2, 363-367, 0021-9517
Fanning, J. C. (2000). The chemical reduction of nitrate in aqueous solution, Coord. Chem.
Rev., 199, 159-179, 0010-8545
Fendorf, S. E.; Lamble, G. M.; Stapleton, M. G.; Kelley M. J. & Parks, D. L. (1994). Mechanism
of chromium (III) sorption on silica. 1. Cr(III) surface structure derived by extended
x-ray absorption fine structure spectroscopy. Env. Sci. Tech., 28, 284-289, 0013936X
Foger, K. (1984). Dispersed metal catalysts, In: Catalysis Science and Technology, Andersen, J.
R. & Boudart, M. (Eds.), 6, 227-335, Springer-Verlag, 3540128158, Berlin
Gao, W.; Jin, R. ; Chen, J.; Guan, X.; Zeng, H.; Zhang, F.; Liu, Z. & Guan, N. (2003). Titania-
supported Pd-Cu bimetallic catalyst for the reduction of nitrite ions in drinking
water. Catal. Lett., 91, 25-30, 1011-372X
Gauthard, F.; Epron, F. & Barbier, J. (2003). Palladium and platinum-based catalysts in the
catalytic reduction of nitrate in water: effect of copper, silver, or gold addition. J.
Catal., 220, 1, 182-191, 0021-9517
Goldberg, S. (1991). Sensitivity of surface complexation modeling to the surface site density
parameter. J. Colloid Interface Sci., 145, 1, 1-9, 0021-9797
Handa, E.; Kotaki, H. & Kaneda, Y. (2001). Anion scavengers, selective and adsorption
removal of nitrate and nitrite ions from wastewater, and recovery of generated
slightly soluble anion-exchange products. Jpn. Kokai Tokkyo Koho, JP 2001252648
Jacquat, O.; Voegelin, A. & Kretzschmar, R. (2009). Local coordination of Zn in hydroxy-
interlayered minerals and implications for Zn retention in soils. Geochemica.
Cosmochim. Acta, 73, 348-363, 0016-7037
Katheuser, B.; Hodnett, B. K.; Riva, A.; Centi, A.; Matralis, H.; Ruwet, M.; Grange, P. &
Passarini, N. (1991). Temperature-programmed reduction and x-ray photoelectron
Waste Water - Treatment and Reutilization
298
spectroscopy of copper oxide on alumina following exposure to sulfur dioxide and
oxygen. Ind. Eng. Chem. Res., 30, 2105-2113, 0888-5885
Kney, A. D. & Zhao, D. (2004). A pilot study on phosphate and nitrate removal from
secondary wastewater effluent using a selective ion exchange process. Environ.
Technol., 25, 5, 533-542, 0959-3330
Massey, A. G. (1973). Copper, In: Comprehensive Inorganic Chemistry, Bailer, J. C.; Emeleus, H.
J.; Nyholm, R. & Trotman-Dickenson, A. F. (Eds.), 3, 1-78, Pergamon Press Ltd., 0-
08-017275-X, Oxford
Miyazaki, A.; Asakawa, T. & Balint, I. (2009). NO
2
-
adsorption onto denitration catalysts.
Appl. Catal. A. Gen., 363, 81-85, 0936-860X
Miyazaki, A.; Balint, I.; Aika, K. & Nakano, Y. (2001). Preparation of Ru nanoparticles
supported on γ-Al
2
O
3
and its novel catalytic acitivity for ammonia synthesis. J.
Catal., 204, 364-371, 0021-9517
Miyazaki, A.; Balint, I. & Nakano, Y. (2003). Solid-liquid interfacial reation of Zn
2+
ions on
the surface of amorphous aluminosilicates with various Al/Si ratios. Geochemica.
Cosmochim. Acta, 67, 20, 3833-3844, 0016-7037
Miyazaki, A. & Nakano, Y. (2000). Morphology of platinum nanoparticles protected by
poly(N-isopropylacrylamide). Langmuir, 16,18, 7109-7111, 0743-7463
Miyazaki, A. & Tsurumi, M. (1995). The H
+
/Zn
2+
exchange stoichiometry of surface complex
formation on synthetic amorphous aluminosilicate. J. Colloid Interface Sci., 172, 2,
331-334, 0021-9797
Moggi, P.; Albanesi, G.; Predieri. G. & Spato, G. (1995). Ruthenium cluster-derived catalysts
for ammonia synthesis. Appl. Catal. A. Gen., 123, 145-159, 0936-860X
Murata, S. & Aika, K. (1992a). Preparation and characterization of chlorine-free ruthenium
catalysts and the promoter effect in ammonia synthesis: 1. An alumina-supported
ruthenium catalyst. J. Catal., 136, 110-117, 0021-9517
Murata, S. & Aika, K. (1992b). Preparation and characterization of chlorine-free ruthenium
catalysts and the promoter effect in ammonia synthesis: 2. A lanthanide oxide-
promoted Ru/Al
2
O
3
catalyst. J. Catal., 136, 118-125, 0021-9517
Pauliac, J. & Clause, O. (1993). Surface coprecipitation of cobalt(II), nickel(II), or zinc(II) with
aluminium(III) ions during impregnation of gamma-alumina at neutral pH. J. Am.
Chem. Soc., 115, 11602-111603, 0002-7863
Santhanam, N.; Conforti, T. A.; Spieker W. & Regalbuto, J. R. (1994). Nature of metal catalyst
precursors adsorbed onto oxide supports. Catal. Today, 21, 1, 141-156, 0920-5861
Subramanian, J.; Noh, S. & Schwarz, J. A. (1998). Determination of the point of zero charge
of composite oxides. J. Catal., 114, 433-439, 0021-9517
Trainor, T. P.; Brown, G. E. & Parks, G. A. (2000). Adsorption and precipitation of aqueous
Zn(II) on alumina powders. J. Colloid Interface Sci., 231, 359-372, 0021-9797
Vlasova, N. N. (2001). Effect of 2.2’-bipyridine on the adsorption of Zn
2+
ions onto silica
surface. J. Colloid Interface Sci., 233, 227-233, 0021-9797
Wada, K. & Abd-Elfattah, A. (1979). Effects of cation-exchange material on zinc adsorption
by soil. J. Soil Sci., 30, 281-290, 0022-4588
Zhang, R.; Schwarz, J.; Datye, A. & Baltrust, J. P. (1992). The effect of second-phase oxides on
the catalytic properties of dispersed metals: Palladium supported on 12%
WO
3
/Al
2
O
3
. 138, 55-39, 0021-9517
14
Absolute Solution for Waste Water:
Dynamic Nano Channels Processes
Rémi Ernest Lebrun
Université du Québec à Trois-Rivières
Canada
1. Introduction
The new concept, which will be discussed in this chapter emerged from the observation that
the wastewater contained, in fact, large quantities of elements with high added value, and
primarily - water, H
2
O. Then the problem to be solved is to sort these elements by using
clean technologies that we draw from the whole set of the unit operations of Chemical
Engineering. The possibilities offered by flourishing nanotechnologies are tremendous for
the characterization of aqueous solutions and for the development of new processes as well.
In fact, there is a wide variety of problems. In the 60s, the idea that nature was capable, if
helped a little, to treat all wastewater was widespread because it was considered that the
amounts released were small in comparison to the flow of the rivers and the vastness of the
seas and oceans. The brutal fact that the vastness is only relative, came from CO
2
emissions,
reducing the oxygen available and the recent invasion of oil into the Gulf of Mexico that
affects shores, the sea bottom and intermediate layers and this, in a large volume. In the past
and more recently, the choice was made at large scale to collect and mix the wastewater for
a global treatment, usually, municipal, which includes industrial, domestic and medical
wastewater. In the context of sustainable development, attitudes change, the selective
collection is allowable. But we must go further, much further, recognizing the presence of
different resources in each type of waste water and therefore to extract them as much as
possible at source, or reuse them on site or to market them after being given an economical
value. Nanotechnology can perform these upgrades. Intensive processes allow to perform
these small-scale operations at the site of production, reducing the mixing and transport.
In this chapter we will relate progress made over the last 50 years, whether scientific,
technological, sociological, ecological, emphasizing nanoscience and miniaturization aspects
as well as the integration of expertise in the process management. We will expose specific
cases, chosen as the most demonstrative of those we treated, for example:
- treatment of contaminated soil after a burial or a discharge, deliberate or not, of
pollutants;
- treatment of municipal wastewater resulting from the collection of releases that uses
water as a transport vector,
- regeneration of glycols in airports depending on weather conditions and others;
- reuse of brines for dyeing textile fibers;
- the transfer of copper removed during the etching of printed circuits to the plating of
new plates.
Waste Water - Treatment and Reutilization
300
We will present the multidisciplinary theoretical reflections that converge and we will
develop a mathematical model describing the phenomenological behavior of aqueous
solutions at a nanometer scale that interact with materials constituting the geometric
boundaries of the pores. We will describe the experimental methods we have adapted to
each case and the tools used in the laboratory and at the pilot scale. We will explain the
appropriateness of applying simultaneously exergy analysis and economic analysis as a tool
for decision support in the short, medium and long term. The main results will be
highlighted and will demonstrate a great potential, offering insight into creative and
efficient solutions for the near future. In a context of population and consumption growth,
natural resources can no longer be considered inexhaustible. The new resources are those
made by humans then discarded after use. They are found largely in waste water and thus
in close proximity to areas of consumption.
2. Fundamental aspects
2.1 Phenomenological aspects and modelling
In the late 50s, after the Second World War, in front of the Gibbs adsorption equation
(Gibbs, 1928), exhibited in a corridor at UCLA (University of California at Los Angeles), S.
Sourirajan had a luminous interpretation (Sourirajan & Matsuura, 1985) that led to the
development of the first reverse osmosis asymmetric membranes made of cellulose acetate
for the desalination of seawater on an industrial scale, but especially to the birth of a new
science of flow separation in nanoscale spaces as a result of many interactions between the
molecules involved.
()
,
1
ln
TA
RT a
∂γ
∂
⎛⎞
⎛⎞
Γ=−
⎜⎟
⎜⎟
⎜⎟
⎝⎠
⎝⎠
(1)
A : Surface area involved in adsorption (m
2
)
a
: Activity of solute (mol m
-3
)
R : Gaz constant (J K
-1
)
T : Temperature of the solution (K)
Γ : Gibbs surface excess of solute (mol m
-2
)
γ
: Interfacial tension at the air-solution interface (N m
-1
)
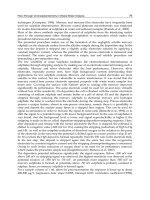
It was not until the 2000s and the availability of fast and powerful computers for us to find
that the work of Jungwirth (Vrbka et al., 2004) in molecular simulation in nanometer space
was, unwittingly, in line with the Sourirajan’s interpretation of the Gibbs adsorption
equation. The following figure describes perfectly what is considered a crucial step in fluid
dynamics in nano-spaces and called by some nanofluidic, which will create a vast field of
investigation and discovery in the area of waste water which then become new resources.
Replace the air-salt water interface by pore-salt water interface having the same properties
as the air-solution interface allows to rearrange the molecules with a very fast kinetics
causing the separation of the solvent in a layer of nanometer range. Moreover, all these
models predict an increase in surface acidity and an increase of basicity in the middle.
However, during operations to pre-concentration of the sap in Quebec and across the north-
eastern North America, tens of thousands of maple producers have all found that the
reverse osmosis produced permeate was acid when water collected from maple trees was
not (Allard, 1998) that we also confirmed in experimental studies on the subject. Recently,
Absolute Solution for Waste Water: Dynamic Nano Channels Processes
301
Fig. 1. Left and middle columns: top and side views of snapshots of solution/air interfaces
from MD simulations of 1.2 M sodium halide solutions. Right: corresponding number
density profiles. Coloring scheme: water oxygen, blue; water hydrogen, gray; sodium ions,
green; chloride ions, yellow; bromide ions, orange; iodide ions, magenta. (Vrbka et al., 2004)
the Nobel Price has been given to Peter Agre and Roderick MacKinnon (Agre & MacKinnon,
2003) for their work on the aquaporin channel and the transport of water and ions through
the bilipidic membrane cell. This discovery connected in relation with the models, shown
before, represent a new approach at the nanoscale to open a great field of research.
On the other hand, always in the late 50s, at the University of Wisconsin, B. Bird clearly
defines the concentrations, velocities and fluxes for solutions in motion (Bird et al., 2002).
This approach, using the relative velocities of solute and solvent compared to the average
Waste Water - Treatment and Reutilization
302
velocity of the solution, enables him to express the molar flux of solute compared to the
molar average velocity of the solution according to the molar concentration gradient and
thus, to give Fick's law its true meaning and render it all the necessary rigor. The differential
equations of momentum, heat and mass are expressed in terms of a balance on a volume
element.
In 1999, we have shown that all these approaches remained fully valid at the nanoscale and
that was enough to express different fluid properties and pore geometry to obtain an
excellent fit between the predictions of model obtained and the experimental data. We have
advanced the concept of dynamic permeability and interpreted from experimental data at
very low pressure drop. The water behaves like a Bingham fluid as it flows in nanoscale
spaces, highlighting the interactions between molecules.
Fig. 2. Permeability of pure water at 25°C: comparison of Bingham and Poiseuille models
with experimental data in hyperfiltration.
We have defined the dynamic permeability Aid, by analyzing the asymptotic limits of
phenomenological equations of transport in a nano filtration module as
()
()
()
id m
pam
AS
QPXX
μ
⎡
⎤
=Δ−Π−Π
⎣
⎦
(2)
()
(
)
(
)
am p
PP X XΔ=Δ −Π −Π (3)
id m a
pm
AS P
QwhenXX
μ
Δ
=→
(4)
Absolute Solution for Waste Water: Dynamic Nano Channels Processes
303
id
A : Dynamic permeability (m)
p
Q : Permeate flow rate (m
3
s
-1
)
m
S : Membrane surface (m
2
)
X : Molar fraction of the bulk solution in the membrane module (-)
m
X : Molar fraction in the boundary layer at the membrane surface (-)
p
X : Molar fraction in the permeate (-)
a
PΔ : Apparent differential pressure (Pa)
e
ff
PΔ : Effective differential pressure (Pa)
()XΠ : Osmotic pressure at the molar fraction X (Pa)
()
m
XΠ : Osmotic pressure at the molar fraction
m
X (Pa)
()
p
XΠ : Osmotic pressure at the molar fraction
p
X (Pa)
μ
: Solution viscosity of the solution in the membrane pore (Pa s)
We also showed that the pore size consisting of material such as polyamide, could shrink
depending on temperature and this, in a reversible manner. The geometry of the pores can
also vary depending on the pH or the concentration in solute of flow solutions. Other
similar effects, due to the presence of an electric field, have also been shown.
We modeled the coupling of mass transport in the boundary concentration layer and in the
pores using the double distribution of pores (Sourirajan & Matsuura, 1985). Then, we
described each of these phenomena according to the Fick’s law of diffusion as expressed by
Bird (Bird et al., 2002), to find different expressions in the boundary concentration layer.
*
()
A
AB A
JDcX=− ∇
(5)
c : Molar concentration of the solution (mol m
-3
)
A
B
D : Diffusion coefficient (m
2
s
-1
)
*
A
J : Solute molar flux relatively to average molar velocity of the solution (mol m
-2
s
-1
)
In this case, the flow rate of fluid or backdiffusion flow rate is proportional to the
concentration gradient (driving force). The coefficient of proportionality is the diffusion
coefficient.
We expressed the flow separation in a pore by an entirely new model.
*
()
M
A
AB A
cX c J∇=+ℜ
(6)
M
A
B
ℜ
: Diffusion coefficient in the membrane pore (m
2
s
-1
)
By integrating this differential equation we have shown the existence of a minimum and
maximum separation (and not asymptotic as in other models). This finding represents a
situation with no interaction. If we insert into the model the affinities between solvent-
solute-porous material, the obtained leverage will depend on the relative dimensions
between the different components.
2
'
1
''
10
'
exp
8
pM
MM
A
B
rP
ff
ff
μ
⎛⎞
Δ
−
⎜⎟
=−
⎜⎟
−ℜ
⎝⎠
(7)
'
f
: Intrinsic separation factor define by
'
m
p
m
XX
f
X
=
⎛⎞
=
⎜⎟
⎜⎟
⎝⎠
(-)
Waste Water - Treatment and Reutilization
304
'
0
f
: Minimum intrinsic separation factor (-)
'
1
f
: Maximum intrinsic separation factor (-)
0%
10%
20%
30%
40%
50%
60%
70%
80%
90%
100%
0.0E+00 5.0E-06 1.0E-05 1.5E-05 2.0E-05 2.5E-05 3.0E-05 3.5E-05 4.0E-05 4.5E-05 5.0E-05
Nb
25.1
15.0
5.1
Model (T=25)
Model (T=15)
Model (T=5)
f'
1
f'
0
f'
0
f'
1
Fig. 3. Experimental data for nanofiltration of DEG in aqueous solution at different
temperatures. Adequacy of the model of separation flow in a nanoscale pore.
Related to very important developments made by Sourirajan who expressed the interactions
as changes of Gibbs free energy in a micro-canonical ensemble described by the following
equations:
()()
** ***
ln ln ln
AM
NaCl s
D
G
CEs
KRT
δω
δ
−ΔΔ
⎛⎞
⎛⎞
=+Δ+++
⎜⎟
⎜⎟
⎝⎠
⎝⎠
∑
∑
(8)
(
)
IB
GG
G
RT RT
−Δ −Δ
−ΔΔ
=
(9)
,0
(structural groups)
II I
G
γ
γ
Δ= +
∑
With:
,0
(structural groups)
BB B
G
γ
γ
Δ= +
∑
For this purpose these definitions are sufficient. To know more refer to Sourirajan
(Sourirajan & Matsuura, 1985 p.131)
From these different groups, it is possible to define the properties of a material, the pore size
to obtain the desired separation for a given solution.
This set of models allowed us to understand and express the geometric variations of
nanoscale spaces between the polymer chains according to the presence of ionic species. The
Absolute Solution for Waste Water: Dynamic Nano Channels Processes
305
figure below shows that the adequacy between model and experiments, clearly expresses
the phenomenological behavior of molecules (solvent, solute, pore material) at the
nanoscale.
Fig. 4. Experimental data for nanofiltration (NF70 and NF45) for solutions of PEG, Na
2
SO
4
,
NaCl: Modeling maximum and minimum separation factors based on permeation flux.
These new insights have enabled the development of new processes for treating wastewater.
After defining the desired permeate and concentrate flows, from a wastewater properly
characterized, the choice of polymer and pore size provides a synergistic effect. On this basis
the process design is then possible and the optimization is based on industrial and economic
constraints.
2.2 Analysis tools for the design optimization
Modeling and understanding of transport phenomena in nanoscale pores help design the
processes required to sort the elements present in wastewater and choose to isolate them,
group them or turn them into new elements. The objective function must be defined in
terms of possible added value of the various flows that can be created by minimizing
releases to the environment in relation to expressed needs. A scientific tool for analyzing the
performance of the new process is the exergy analysis. This analysis, coupled with an
economic analysis, allows to know the degree of valorization over the maximum possible in
the context of wastewater available and immediate needs.
Here is an example of exergy analysis of a method for wastewater valorization:
The simplest configuration is illustrated in the figure below (one-stage continuous process).
Several parameters are defined as follows:
-
Average operating pressure
2
me ms
PP
P
+
⎛⎞
=
⎜⎟
⎝⎠
(10)
Waste Water - Treatment and Reutilization
306
Fig. 5. Systemic diagram of a simple process.
-
Average recirculation flow rate in the module
2
me ms
Q
+
⎛⎞
=
⎜⎟
⎝⎠
(11)
-
Average molar fraction of the solute in the module
ln
ms me
ms
me
XX
X
X
X
−
⎛⎞
⎜⎟
⎜⎟
⎝⎠
= (12)
-
Osmotic pressure gradient
() ( )
p
XX
π
ππ
Δ
=− (13)
-
Apparent transmembrane pressure
a
p
PPP
Δ
=− (14)
-
Effective transmembrane pressure
eff a
PP
π
Δ
=Δ −Δ (15)
Ideal system: minimum work of separation
The separation of a homogeneous binary mixture of different compositions needs certain
devices that consume energy in the form of work and/or heat. The minimum work to make
a separation, whatever the method used, is calculated by considering a reversible and
isothermal separation. This minimum work of separation depends only on the composition,
temperature and pressure of the initial mixture and different final fractions. For a separation
of a homogeneous mixture into pure products at constant temperature, the minimum work
to provide can be calculated by the formula:
min
ln( )
jjj
j
WNRTXX
γ
=−
∑
(16)
P
me
Q
me
= Q
e
X
me
= X
e
P
ms
Q
ms
X
ms
P
s
= P
e
Q
s
= Q
ms
X
s
= X
ms
P
p
Q
p
X
p
P, X
P
e
Q
e
X
e
W
f
W
v
W
m
W
s
Absolute Solution for Waste Water: Dynamic Nano Channels Processes
307
where W
min
is the minimum work required for separating of the mixture flow (W);
N is the molar flow of the mixture flow (mol s
-1
);
R is the constant of ideal gases (J mol
-1
K
-1
);
T is the temperature of the system and its environment that is kept constant (K);
X
j
is the mole fraction of component j in the initial mixture;
γ
j
is the activity coefficient of component j in the initial mixture.
Where products are not pure, the minimum energy consumption can be calculated by
subtracting from the equation (16), the minimum work to transform impure products to
pure products. In the case where the solute concentration is low, the activity coefficients are
taken equal to 1, and that to simplify calculations. If we use the same symbols shown in
Figure 5, we obtain the following equation to calculate the minimum work to separate a feed
stream (N
e
) in a permeate flow (N
p
) and a concentrate stream (N
s
) :
[
]
{
[]
}
min
ln (1 )ln(1 )
ln (1 )ln(1 )
ln (1 )ln(1 )
ee e e e
pp p p p
ss s s s
WRTNXXX X
NX X X X
NX X X X
=− + − −
⎡⎤
−+−−
⎣⎦
−+−−
(17)
where N
e
is the molar flow of the input solution (mol s
-1
);
N
p
is the molar flow rate of permeate (mol s
-1
);
N
s
is the molar flow of concentrate (mol s
-1
).
A method for doing the separation of a mixture where there are changes in temperature,
pressure and concentration, the exergy of a fluid stream can be presented as the sum of the
thermal exergy E
x
T
, the mechanical exergy E
x
P
and chemical exergy E
x
C
[equation 18-21]:
TPC
XXXX
EEEE=++( (18)
where thermal exergy
()
0
0
ln
T
XP p
T
EQCTTc
T
⎡
⎤
⎛⎞
=−−
⎢
⎥
⎜⎟
⎢
⎥
⎝⎠
⎣
⎦
(19)
mechanical exergy
(
)
0
P
X
EQPP
⎡
⎤
=−
⎣
⎦
(20)
chemical exergy
(
)
0
ln
C
Xiiii
ENRTeX X
γ
⎡
⎤
=− −
⎣
⎦
∑
(21)
E
x
is the flow exergy (W)
c
p
is the specific heat of the solution (J m
3
K
-1
)
e
i
is the exergy of pure product i.
T
o
, P
o
are the temperature and pressure of the reference state.
For the process (fig. 5) the following hypothesis have been done:
1.
T
0
, the operating temperature is constant
2.
The binary solution is homogenous and the activity coefficients are fixed to 1;
3.
Pressures are P
e
=P
p
=P
s
= P
atm
;
4.
The pump efficiency is equal to 100%.
The exergy balance on this process is defined as follow:
min 0f
WW TS
=
+Δ
(22)
Waste Water - Treatment and Reutilization
308
Where W
min
et W
f
are calculated by equations (17) et (22) and ΔS is the entropy generation.
Equation (22) appears as:
()
me ms
p p ms me ms ms ms s
min 0 e-p e-ms ms-s
PP
Q ( -P )+Q (P -P )+ Q (P -P ) =
2
W+T S+ S +S
+
ΔΔ Δ
(23)
Where
ΔS
e-p
, ΔS
e-ms
et ΔS
ms-s
are the entropy generations between the referred points of the
fig.(1). The exergetic efficiency of such a system can be defined by (Brodyansky et al,1995):
min
e
f
W
W
η
= (24)
2.3 Examples of general application
The following example is generic to show how this tool can be applied: a concentrated
solution which, after use, is diluted and contaminated by other elements.
Considered as waste before government standards, the wastewater was discharged into the
environment. To continue production operations, the pure products (solid) were purchased
and then mixed with pure water, purchased or produced from a local source, to obtain the
desired concentrated solution.This solution was heated to the operating temperature to be
used in the production process. However, exergy analysis shows that there is energy
generation when mixing pure products and pure water: energy, which usually is not
recovered. If we consider that contamination may be removed, we obtain a dilute solution of
good quality. The temperature level is maintained at the lowest energy cost since the
solution is recycled. From a viewpoint of exergy analysis, the best performance is to
concentrate the resulting solution to obtain the desired solution. The same analysis can
compare various processes to determine for each process the most efficient operating range.
It also helps to optimize each process on the basis of thermodynamic irreversibility.
The wastewater can be classified according to the exergy analysis. Leachate contaminated
soil or municipal wastewater, generated naturally or by simple collection, represent a
category.
The primary interest is often to treat this wastewater for discharge into the receiving
environment based on standards. There are still few places where we seek to enhance their
content. However, domestic wastewater is treated and reused in the space station. Indeed,
water is prohibitive, reuse water becomes clear. Whole buildings in Japan treat wastewater
generated internally, based on the idea of Yamamoto (Choi et al., 2006), and a single booster
is used, which allowed for significant space savings by reducing the pipes.
A large category includes wastewater at the exit of processes that have a greater level of
exergy that water supply. This exergy is thermal exergy (hot water discharge), or
mechanical exergy (high pressure discharge) or chemical exergy (water of high purity).
Another category includes wastewater containing chemicals used in excess in the
production process, which are rejected because in the presence of contaminants. Presumably
another category contents washing cars or textiles with the use of detergents and high
temperatures, cleaning with acids or bases that are found in pulp and paper industry in the
plating. The solution in this case, was to neutralize the waste to meet environmental
standards and to purchase acid and basic production needs. However, these products
Absolute Solution for Waste Water: Dynamic Nano Channels Processes
309
represent costs, risks (storage and transport) and standards for salts are closing more and
more. This situation prevents the neutralization that generates salts.
From another point of view, the human body can be perceived as a real chemical
engineering plant. It is an excellent example of exergy efficiency. The introduction of drugs,
often in excess, in the entire body is an example of exergy losses. Moreover, the presence of
endocrine precursors (from these drugs) in wastewater is now recognized as a serious
public health problem. Fortunately more and more controlled drugs diffusion and the
possibility of detecting the target to be treated are promising solutions.
2.4 Characterization of nanoscale pores
We have seen that the pore size and surface forces of the material forming these pores are of
crucial importance to minimize energy costs. An essential tool for characterizing the pore
size is the analysis of structures by near-field scanning microscopy. The image analysis of
generated images allow quantification of the size and size distribution of pores and their
surface distribution. The great advantage of this method is that it is not destructive and it
works in an ambient or controlled atmosphere as well as in liquid medium that can be
modified depending of temperature, pressure, pH, salt concentrations, etc.
The following figures, we have realized in the laboratory, illustrate the topology of
membranes at different scales. The depth of 3-D images is indicated. Areas of 2 µm each side
up to areas of 10 nm each side are presented below. Different materials have been studied
(ceramics, polymers). Figure 8 shows the cyclodextrins of 100 nm, retained by the ceramic
membrane with pores of about 20 nm, during a permeation of an aqueous solution of 100
ppm of cyclodextrins. Figure 9 presents a surface modification of the ceramic membrane
with an polyvinil oxide solution. Figure 10 shows a detail of the morphology of the new
surface. These images show the beginning of a characterization of dynamic pores.
Fig. 6. Ceramic membrane D
p
= 20 nm. Image Scanning Probe Microscope 1x1µm, contact
mode, ambient air.
Waste Water - Treatment and Reutilization
310
Fig. 7. Ceramic membrane D
p
= 20 nm. Image Scanning Probe Microscope 200x200 nm,
contact mode, ambient air.
Fig. 8. Blue cyclodextrin on ceramic membrane D
p
= 20 nm. Image Scanning Probe
Microscope 500x500 nm, contact mode, aqueous medium, ambient temperature and
pressure.
Absolute Solution for Waste Water: Dynamic Nano Channels Processes
311
Fig. 9. Surface modification of ceramic membrane Dp = 20 nm with sulfonated oxide of
polyphenyl. Image Scanning Probe Microscope 2x2
μm, contact mode, aqueous medium,
ambient temperature and pressure.
Fig. 10. Surface modification of ceramic membrane D
p
= 20 nm with sulfonated oxide of
polyphenyl. Image Scanning Probe Microscope 10x10 nm, contact mode, aqueous medium,
ambient temperature and pressure.
Waste Water - Treatment and Reutilization
312
Fig. 11. Cellulose acetate membrane manufactured according to the recipe of the first
membranes of Loeb and Sourirajan. Image Scanning Probe Microscope 600x600 nm, contact
mode, aqueous medium, ambient temperature and pressure.
In the case of processes based on organized nanoscale pores, two avenues can be
considered:
-
Minimize losses due to irreversible phenomena
Maintaining the maximum separation of solute compared to the solvent, it is possible to
minimize losses by reducing charge losses in a pore or by reducing its length or by
providing flared shapes (Sourirajan & Matsuura, 1985). We can also increase the radius of
the pore and maintain the separation. It may be noted that the number of pores increase the
exergy efficiency by decreasing the operating pressure and therefore allows to approach the
minimum work of separation, provided that it respects the maximum separation, and the
minimum pressure corresponding to this maximum separation. By opposite when the
separation varies with the pressure, which represents the irreversible thermodynamics, the
margin for maneuver is limited. It is the same with the variable temperature, to a lesser
extent.
-
Make processes more intensive (maximum production with minimal bulk)
If the most important criterion is to have a process as compact as possible, then it is possible
to organize the material to increase the number of pores per surface unit and increase the
operating conditions (temperature and pressure ). The energy cost of the operation of such a
process will then increase and other risks may be associated with this avenue. Often the
exergy of the concentrate current will be increased to an unnecessary value which may very
often lead to energy loss during the operation.
Processes such as evaporation, vacuum evaporation, multiple effect evaporation,
hyperfiltration, nanofiltration, electrodialysis, membrane distillation, etc. Each of these
processes can be most efficient for a certain range of concentration and, therefore, a process
Absolute Solution for Waste Water: Dynamic Nano Channels Processes
313
consisting of several of these unit operations may be the most efficient method for a given
problem. For cons, the chosen solution may be slightly different because of the availability
of equipment and according to economic analysis. Some of these unit operations have
marked scale effects, othera as membrane processes are much less sensitive.
3. Strategy of the process design
3.1 Wastewater, its origin: a systemic analysis
The origin of the wastewater is very important in our conceptual framework. For a long
time the grouping of wastewater has been a strategy to benefit from scale effects of
treatment processes. Currently, whether municipal or industrial, the selective collection is
increasingly applied. The analysis means of wastewater is becoming increasingly
sophisticated for a wide variety of molecules and are more accurate but costs remain
high.
Our strategy applies to a unit of industrial production (defined as a system situated in an
environment with its inputs and outputs). Systemic analysis begins with mass balances and
exergy balances (energy, temperature level, air pressure, chemical potential) on each of the
currents on the global system and subsystems to explore opportunities to create loops of
internal recycling process.
This methodology is based on different principles :
Know the production line, its inputs, its outputs, the present reactions, the necessary energy
levels, the separations and mixtures used will help to reduce analysis costs by reducing their
frequency and their level of accuracy. A program for analyzing the quality of raw materials
and products to help maintain constant operating conditions.
• The mixture of two or more fluid currents or energy must be at the same level of
exergy. If one of the currents is below this level its exergy must be increased and this
expense should be accounted. This represents an extension of the pinch technology
applied in energy saving.
These tools cannot give an objective analysis because they can optimize an existing situation
(a process in place) or optimize a newly developed method which is subjected to the
method. In no case they cannot directly provide an optimum process. Moreover, the
constraints imposed upon the posing of the problem restrict the degrees of freedom of the
designer.
An interesting example is the treatment of toxic groundwater resulting from leaching of
contaminated soils. Indeed, the fact of using the word “toxic” leads the designer towards
what might be considered as a red herring. It must reflect the standards and regulations and
optimize a method based on those constraints that apply to the current that must return to
the receiving environment and other currents that may be released into the environment.
However, if we define the wastewater according to its composition, the elements
responsible for the toxicity and ecotoxicity represent a very small amount of dissolved
matter (in the order of 10
-1
kg m
-3
or 100 ppm ). So we can consider that these waters contain
a large amount of very pure water. The proposed method allowed to produce high quality
water that could have multiple uses for treated water:
• Flow to the river
• Back to the site for irrigation as leaching water to accelerate soil washing.
• Use as process water for industry
• Use as drinking water