Advanced Radio Frequency Identification Design and Applications Part 11 docx
Bạn đang xem bản rút gọn của tài liệu. Xem và tải ngay bản đầy đủ của tài liệu tại đây (1.06 MB, 20 trang )
1. Introduction
This chapter introduces the RFID tag floor localization method with multiple recognition
ranges and its mathematical formulation to improve position estimation accuracy. Using
the multiple recognition ranges of RFID reader, the reader can obtain more information
about the distances to the tags on the tag floor. The information is used to improve the
position estimation performance. At first, this chapter reviews the RFID tag floor localization
method with single recognition range for mobile robots(Park et al., 2010) and The performance
measure based on the position estimation error variance for the localization method. For the
second, this paper extends the mathematical formulation of the localization method and the
performance measure for the case of multiple recognition ranges. This work is related to the
previous work(Park et al., 2009) that used multiple powers to improve position estimation
performance. However, previous work lacks analysis and mathematical formulation of
general RFID tag recognition models. We extend the mathematical formulation and the
analysis of the single recognition range RFID tag floor localization method (Park et al., 2010) to
the multiple recognition range case. Then the minimum error variance of multiple recognition
range is introduced as a lower bound of position estimation error variance. Finally, it presents
performance improvement of proposed localization method via the Monte-Carlo simulation
and simple experiments. The analysis for the simulation and experimental results and the
consideration for real application will be given.
This chapter is organized as follows; This section discusses sensor systems used in the mobile
robot localization. Then the advantages of the RFID systems as sensor systems for localization
are discussed and the researches on the systems are reviewed. Section 2 introduces the RFID
tag floor localization, its mathematical formulation and its performance index. Section 3
represents the motivation of introducing the use of multiple recognition ranges for the RFID
tag floor localization method, and extend the mathematical formulation and the error variance
for the multiple recognition range case. Section 4 conducts the Monte-Carlo simulation to
show the improvement of the position estimation performance when the multiple recognition
range is used. Section 5 represents experimental results that support the simulation results. In
Section 6, the minimum error variance(Park et al., 2010) as a lower bound of error variance is
extended to the multiple recognition range case. Section 7 gives the conclusions, discussions
and tasks for the further researches.
Youngsu Park, Je Won Lee, Daehyun Kim, Sang-woo Kim
Electronic and Electric Engineering department, POSTECH
Korea, South
Improving Position Estimation of the RFID
Tag Floor Localization with Multiple
Recognition Ranges
10
1.1 Sensor systems for indoor mobile robots
The localization is essential problem for the mobile robots to navigate a working area and to
accomplish their work. For the localization problem, many researchers used various types of
sensor systems to solve it.
The dead reckoning systems utilize the movement of actuators by encoders to estimate the
relative changes of position and heading angle(Everett, 1995). However, the sensor systems
accumulate the errors that induced by the mismatches between real robot and models,
slippage of wheels, and variance of wheel diameter due to the air pressure during the
navigation.
The localization systems with inertial navigation system (INS) utilize the linear accelerations
and angular velocities of the mobile robot(Borenstein and Feng, 1996). The systems integrate
these informations to estimate the current position and the heading angle. The cost of the
INS systems was very high and the size was large for the indoor mobile robots, until the
advances of the micro-electromechanical systems (MEMS). The MEMS based INS have low
cost and small size relative to mechanical INS systems. However, the INS suffers from noise
and bias that lead to drift of integrated results (Sasiadek et al., 2000). Some INS packages
include magnetic sensors to detect the terrestrial magnetism, to reduce the pose or heading
angle error. However, there are many sources that can distort the terrestrial magnetism for
indoor environments.
The ultra sonic ranging system and the lager range finder (LRF) are range detecting sensors.
The mobile robot matches range information with the map which they have, to estimate
their positions. These range sensors can measure the range of objects very accurately. But,
under some surface conditions, they can’t detect objects and can suffer from multipath
problems(Everett, 1995).
The ultra sonic satellite systems, such as CRICKET triangulate a moving node’s position with
distances from fixed nodes by time of flight(Priyantha, 2005). However, the system is hard
to scale up for the large work area and the many mobile robots. When the numbers of fixed
nodes and mobile robots are increased, the localization takes longer time due to the arbitration
processes.
The radio-frequency-based ranging systems such as chirp spread spectrum (CSS) and received
signal strength (RSS) are used for localization of the mobile robots(Inácio et al., 2005; Patwari
and Hero III, 2003), however, they have relatively large errors for the indoor mobile robot
applications. The ultra-wideband (UWB) communication systems are also used for the indoor
localization problem and have good resolution, however, the system cost is still high and each
fixed nodes needs to be synchronized by wires(Gezici et al., 2005). Moreover, they use the
wide frequency bands that can be the reason of the signal interference, therefore, it requires
the permission of the relevant government ministries when it is use.
1.2 RFID systems for indoor mobile robots
The RFID based localization systems are also used by several researches to localize the indoor
mobile robots. The RFID systems as localization sensor systems for mobile robots have several
advantages.
First, the systems are robust to the external environments such as light condition, surface
condition of objects, dirts on the landmarks, and distortion of the terrestrial magnetism.
Vision-based localization systems suffer from illumination and color changes, bad focused
images, image distortions, motion bluer and so forth. The ultra sonic sensor systems and the
LRF sensor systems can not detect obstacles or walls, under some surface conditions.
Second, the RFID systems can handle numerous unique landmarks. The landmark is the
simplest way to locate the current position, however, the vision sensor based localization
190
Advanced Radio Frequency Identification Design and Applications
systems have limitations on the numbers of landmarks or features. Moreover, they need
heavy image process routines for finding features in images. The RFID tags have their unique
identification information in their memories and some of the RFID tags have configurable
memories which can be written while or after the landmark installation.
Third, they can handle many tags in a short time. Most of RFID readers are equipped with
anti-collision algorithms such as ALOHA, slotted ALOHA, and binary search tree algorithm.
It reduces the user’s consideration for handling the collisions and arbitrations.
Finally, the installation cost and the maintenance cost of RFID systems are relatively low. The
price of tags have been dropping. Nowdays, a 96-bit EPC tags cost 7 to 15 U.S. cents and the
EPCglobal tries to reduce the price of tags to 5 cents(RFID journal, nd). After the installation
of RFID tags, the efforts to maintain the landmarks are barely needed. These utilize the
transmitted power from readers to respond to the reader. They will work normally under
harsh conditions.
For these reasons, the RFID systems are used for the mobile robot localization problem by
many researchers. Burgard et al. (2004) and Kim and Chong (2009) used directional antennas
to estimate the current position and target objects. Jia et al. (2008) used multiple antennas
to locate RFID tags accurately. Ni et al. (2004), Shih et al. (2006), Zhao et al. (2007), and Sue
et al. (2006) used active RFID tags for indoor localization of target object. Some of them have
names such as LANDMARC, VIRE, FLEXOR. Kulyukin et al. (2004) and Kulyukin et al. (2006)
used the passive RFID system with the LRF for guiding visually impaired. Chae and Han
(2005) and Kamol et al. (2007) used vision information to improve the position estimation
performance. Zhou et al. (2007) and Zhou and Liu (2007) used active RFID tags that have
LEDs on it. Using vision sensors fond the light of tag and aim the laser to the tags to activate
it.
2. RFID tag floor localization
The RFID tag floor localization method is one of the RFID based localization method that
utilize massive passive tags installed on the working area. The RFID readers are attached
under the mobile robot’s chassis and the tags are placed on the certain points on a working
area. While the mobile robot moves, the reader detects tags near the mobile robot and
estimates the position from the detected tags’ positions. The RFID tag floor localization
method has several advantages. It is easy to scale up the work space and number of
robots. Most RFID system still need some arbitration process when multiple readers in a
work area. However, the antennas for the RFID tag floor localization face down to the floor.
Therefore, they need little consideration for the reader arbitration. Moreover, it rarely require
maintenance after installation and does not require power to maintain the tag infrastructure.
The concept of the RFID tag floor localization that called the super-distributed RFID
infrastructures, is firstly proposed by Bohn and Mattern (2004). They also propose the criteria
to classify the tag placement by the density of tags and the regularities of tag positions. Several
researchers managed their works to apply the concept to their application and to improve
the position estimation accuracy. Park and Hashimoto (2009a) proposed a simple algorithm
that combined rotations and linear movements sequentially to reach the goal position. Lee
et al. (2007) and Park and Hashimoto (2009b) used weighted mean algorithm to estimate the
position of mobile robots. Park et al. (2010) investigated the performance of the RFID tag
floor localization algorithm with various reader recognition ranges and tag placements. Han
et al. (2007) used a cornering motion to gather information of robot’s position and direction.
Senta et al. (2007) used support vector machine (SVM) to learn the accurate tag positions from
191
Improving Position Estimation of the
RFID Tag Floor Localization with Multiple Recognition Ranges
pseudo table of the tag positions. Choi et al. (2008) augmented the ultra sonic sensors and the
RFID tag floor localization method for efficient localization.
2.1 Mathematical formulation of the RFID tag floor localization
Fig. 1. Concept of the RFID tag floor localization method.
To formulate the RFID tag floor localization (RTFL), it is required to define the representation
of the RFID reader and the Tag floor. The RFID reader detects the tags on the RFID tag floor
to estimate its position. The RFID tag floor is defined as a set of tags which have their own
identities and positions, installed on a work area with some geometric pattern(Fig. 1). The tags
are detected by the reader stochastically. The probability of tag recognition can be described
as a function of distance and directions between tag and reader. Moreover, the recognition
probability is also a function of the RFID reader’s transmission power, the number of tags, and
other various environmental conditions. Most RFID based localization methods, however,
assume that the recognition probability is only a function of distance and the transmission
power is fixed for the simplicity of the algorithms.
Therefore, the RFID reader can be described as follows:
R
=(x
R
, p
R
(·)), (1)
where x
R
is the position of the RFID reader and p
R
(·) is a recognition probability function of
distances between the RFID reader and tags.
Tags in tag floor can be described as a tag set T,
T
= {t
i
|i = 1, ···, N}, (2)
where N is the number of tags in the tag floor and t
i
is the position of i-th tag.
The result of a recognition process is a set of recognized tags or combination of tags. This set
must be one of subsets of T. Y is defined as a set of all subsets of T, and it can be expressed as
follows:
Y
= {φ, {t
1
}, {t
2
}, ···, {t
1
, t
2
}, ···, T}, (3)
where φ means the empty set that corresponds to the case in which no tag is recognized. The
number of elements of Y is 2
N
.
However, for a recognition function of a reader, many elements of Y have zero probability,
or cannot be happened. For example, in large tag floor, tags in rightmost end and leftmost
192
Advanced Radio Frequency Identification Design and Applications
end cannot be recognized simultaneously. So, Z is defined as the set of elements of Y, whose
elements are the tag set that can be detected at the same time.
Z
= {φ, {t
1
}, ···} (4)
= {φ, z
1
, ···, z
K
}. (5)
K is the number of elements of Z
−{φ}. φ means the case in which no tag is recognized, but
it does not mean that probability is zero. So, φ is also a element of set of realizable outputs, Z.
The set Z , the set of recognition outputs with nonzero probability, has finite size. In general
triangulation problem, there can be additional information such as signal strength, time of
flight. However, that the recognition process of RTFL gives only tag’s identity and its position.
In consequence, only finite number of estimation points can exist. Exactly saying, the number
of position estimation points is the same as the number of elements of Z
−{φ}.
We define the set of mapping or estimation points:
ˆ
X
= {
ˆ
x
1
, ···,
ˆ
x
K
}, (6)
where
ˆ
x
k
is position estimation points.
In RTFL, the position estimation using recognition output is mapping from Z to
ˆ
X,
f : Z
−{φ}→
ˆ
X, (7)
f
(z
k
)=
ˆ
x
k
. (8)
This mapping is called position estimation function. In other words,the estimated point
ˆ
x
k
is
the representative position of the domain where the recognition output z
k
occurs.
2.2 Performance index based on position estimation error variance
Main problem in RTFL is making proper position estimation function. To evaluate how proper
the function is, performance index is needed. Performance index generally used is average of
squared error. The error is difference between the real reader’s position and the estimated
position. To calculate performance the index, the conditional probability p
(
ˆ
x
k
|x
R
) should
be calculated. This probability function represents the probability of detecting the tags, z
k
,
corresponding to the mapping point, ˆx
k
, when the tag is on the position ˆx
R
. It can be described
as follows:
p
(
ˆ
x
k
|x
R
)=
∏
t
i
∈z
k
p(t
i
|x
R
) ×
∏
t
j
∈z
c
k
(1 − p(t
j
|x
R
)), (9)
where p
(t
i
|x
R
) is the probability function in which tag t
i
is detected if the reader is on a
position x
R
. If there is proper number of RFID tags, the recognition probability of a tag is
independent of other tags.
Using the conditional probability, the expected value of squared error in position x
R
can be
calculated as follows:
V
x
R
=
∑
ˆ
x
k
∈
ˆ
X
|x
R
−
ˆ
x
k
|
2
p(
ˆ
x
k
|x
R
). (10)
193
Improving Position Estimation of the
RFID Tag Floor Localization with Multiple Recognition Ranges
The average of squared error, or the error variance, as a performance index is an average of
the expected value over the domain of the RFID tag floor. It can be expressed as follows:
V
=
1
W
W
V
x
R
dxdy (11)
=
1
W
∑
ˆ
x
k
∈
ˆ
X
W
|x
R
−
ˆ
x
k
|
2
p(
ˆ
x
k
|x
R
)dxdy, (12)
where W is the work area. By using the performance index, the optimal estimation position
set can be found. Moreover, the accuracy of various position estimation functions can be
evaluated by the performance index. In general, mean based or weighted mean based position
estimation functions are used in RFID tag floor localization method.
Another aspect of the performance of the RFID tag floor localization is the success rate.
The success rate means the ratio of successful localization. The localization fails if there is
no detected tag by the reader. The success rate, however, is not dependent on a position
estimation function, but the recognition range and distance of grids. For the continuous
localization and for avoiding the localization failure, the reader recognition range should
contain at least one tag for every position of reader on the work area.
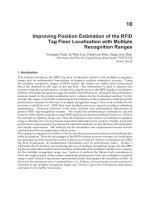
3. RFID tag floor localization with multiple recognition ranges
Most of UHF RFID readers can control power of transmission signal by changing the antenna
attenuation of readers Narayanan et al. (2005) and it means the reader can change recognition
range shown as (Fig.2). We can obtain more information about the distances between reader
and tags with multiple power, that is multiple recognition ranges. With low transmission
power, only the tags near the reader are detected. The recognition range is increased as the
transmission power is increased. By giving more weight for the estimated positions for the
lower power, the position estimation error can be reduced.
In previous studies such as the study of Luo et al. (2007), multiple power is just used for robust
recognition of tag but not used for nearness information. In the studies of Park et al.(2009),
they use the nearness information obtained by multiple recognition range to improve the
position estimation.
3.1 Mathematical formulation of RFID tag floor localization with multiple recognition ranges
Multiple recognition ranges mean that there are multiple recognition probability functions.
We can extend the description of the RFID reader of with single recognition range to the
multiple recognition ranges as follows:
R
=(x
R
, {p
m
R
(·)|m = 1, 2, ···, M}), (13)
where M is the number of the ranges and p
R
m
(·)s are corresponding recognition functions.
Also, there exist M sets of recognition outputs with nonzero probability, or Z.
Z
m
= {z
m
0
, ···, z
m
K
m
}, (14)
= {z
m
k
|k = 0, 1, ···, K
m
}, (15)
where z
m
0
= φ and z
m
is a possible recognition output with nonzero probability at m-th
recognition range. As like single range case, output of recognition process with m-th range
is one of elements of Z
m
. K
m
is the number of possible elements at the m-th range.
194
Advanced Radio Frequency Identification Design and Applications
Fig. 2. The concept of the RFID tag floor localization method with multiple recognition
ranges.
Define a set
¯
Q as follows:
¯
Q
= {(z
1
, z
2
, ···, z
m
, ···, z
M
)|z
1
∈ Z
1
, z
2
∈ Z
2
, ···, z
M
∈ Z
M
}. (16)
Hence, recognition output with multiple recognition ranges must be one of elements of
¯
Q.
But, some elements of
¯
Q cannot happen. Q is defined as a sub set of
¯
Q whose elements are
occurred with nonzero probability. Then,
Q
= {q
0
, q
1
, ···, q
l
, ···, q
L
}, (17)
where,
q
0
= {φ
1
, φ
2
, ···, φ
M
}. (18)
q
0
means that there is no recognized tag in recognition process for all recognition ranges. L is
the number of all possible combination of tags for the multiple recognition ranges.
In RTFL with multiple recognition ranges, elements of Q instead of Z are the outputs of
recognition process. The others are the same as the things in recognition process with single
recognition range as follows:
ˆ
X
M
= {
ˆ
x
1
,
ˆ
x
2
, ···,
ˆ
x
l
, ···
ˆ
x
L
}, (19)
f
M
: Q −{q
0
}→
ˆ
X
M
, (20)
where M is the number of recognition ranges .
Generally, the size of Q is much larger than the size of Z. So, there are much more estimated
points in multiple ranges case and each estimated point is representative to narrower area.
In result, error variance is smaller than error variance of single range, it means accuracy of
position estimation is improved.
195
Improving Position Estimation of the
RFID Tag Floor Localization with Multiple Recognition Ranges
3.2 Performance indexes for position estimation performance
In multiple ranges case, definition of error variance is the same as the definition in single range
case as follows:
V
=
1
W
∑
ˆ
x
k
∈
ˆ
X
M
W
|
ˆ
x
k
−x
R
|
2
p(
ˆ
x
k
|x
R
)dxdy. (21)
However, as using Q instead of Z, calculating p
(
ˆ
x
k
|x
R
) need modification as follows:
p
(
ˆ
x
l
|x
R
)=
∏
z
m
∈q
l
(
∏
t
i
∈z
m
p
m
R
(t
j
|x
R
) ×
∏
t
j
∈(z
m
)
c
(1 − p
m
R
(t
j
|x
R
)), (22)
Multiple recognition ranges give good success rate as well as accuracy improvement. The
accuracy improvement will be verified by simulations and experiments in Section 4 and
Section 5.
4. Simulation for the two RFID tag floor localization methods
This section provides and compares the simulation results for the tag floor localization method
and the method with multiple recognition ranges to show the performance improvement of
the proposed method. The Monte-Carlo method is used for the simulation and the position
estimation error variance is used as a performance index.
4.1 Simulation settings
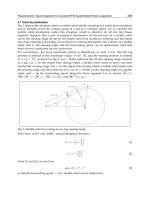
Fig. 3. The tag grid used for the RFID tag floor localization simulation.
For this simulation, 9
×9 tag grid is used as shown in Fig. 3. To compare the two type of RFID
tag floor localization methods, 400,000 sample points are generated in the 1
×1 center grid cell.
The approximation of the position estimation error variance is calculated as following
equation:
ˆ
V
(x
R
)=
1
M −1
M
∑
j=1
| x
R,j
−x
k,j
|
2
. (23)
196
Advanced Radio Frequency Identification Design and Applications
The M is the number of samples that succeed to detect at lease one tag. If the recognition
range is small, there may be no detected tag, and we call that the sample is failure point. The
rate of failure is also one of the performance index for the position estimation as mentioned
before.
If the sample point succeed to detect a tag set or tag sets with multiple recognition ranges, the
estimation point is determined by the position mapping function. For the single recognition
range case, the estimation point is determined by f
(z
k,j
)=ˆx
R,j
= x
k,j
. In this simulation,
we take mean of the detected tag positions to estimate the reader position. For the multiple
recognition range case, we use following position estimation function: f
M
(q
l,j
)=ˆx
R,j
= x
k,j
.
In this simulation, the mean value of the mean position of recognized tags for each level is
used for position estimation function.
In general, the recognition range of a tag from the position of RFID reader can not be defined
clearly, since the probability of a tag recognition gradually decreases from a certain range
near the recognition boundary. However, the recognition model p
R
(·) used in this section is
circular model as follows, for simplicity of the simulation:
p
R
(x
i
| x
R
)=
1 for
| x
i
−x
R
|≤ r
0 for
| x
i
−x
R
|> r.
(24)
The recognition ranges r changed from 0.5 to 4.0. For the multiple recognition range case,
the number of recognition ranges is 3 and the recognition range set
(r
1
, r
2
, r
3
) is defined
(0.3r, 0.7r, r).
4.2 Simulation results
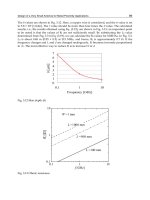
Figure 4 and 5 shows the simulation results. Figure 4 represents the error variances of
position estimation. The line and broken line respectively represents the approximation of
position estimation error variance of the RFID tag floor localization method and the method
with multiple recognition ranges. It shows the improvement of the position estimation
performance when the multiple recognition ranges are used. Both error variances are
Fig. 4. The position estimation error variance of the RFID tag floor localization methods.
decreasing as the recognition range is increasing. The reason of the decrease of the error
variance is the increase of the number of the estimation or mapping points. For the larger
recognition range, the more tags are detected by the RFID reader. Figure 5 shows the
number of the mapping points. The numbers of mapping points increase as the recognition
range increase. Each mapping point corresponds a partition that divided by the recognition
boundaries. If the number of partitions increases, the error variance is decreased. In Fig.
197
Improving Position Estimation of the
RFID Tag Floor Localization with Multiple Recognition Ranges
Fig. 5. The number of mapping points that corresponds the number of the detected tag
combinations.
5, we can find the fluctuations on the error variances. The reason of the fluctuations is the
balance between each partitions. If the partitions are relatively even, the error variance is low,
otherwise, the error variance is high. More illustrative explanation will be given in Section 6.
5. Experimental results of multiple recognition range RFID tag floor localization
This section provides the experimental results that support the performance improvement
of the proposed RFID tag floor localization method with multiple recognition ranges. The
settings for the experiment of the tag floor localization methods are explained. Then, the
result of experiment is processed with random sampling algorithm to get meaningful data.
Finally, the meaning of the results are discussed.
5.1 Experimental settings
In this experiment, 9×9 tags were placed with the 20cm×20cm grid. And the reader detected
the nearby tags at every 2cm grid points inside the 65cm
×62cm work area of the experimental
equipment. At each point, the reader changed the transmission power from 15dBm to 25dBm
by 1dBm and read the tags 10 times for each power.
After gathering the sample data, we used random sampling algorithm to process the data.
For each point, the recognition probability of each tag was defined by the data. Then, at each
sample point, tags were detected with the recognition probability and conducted the position
estimation process based on it. It was repeated 1000 times at each sample points.
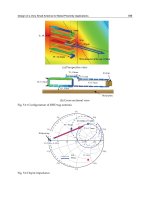
Figure 6 shows the equipments and setting that we used in this experiment. Figure 6(a) is the
experimental equipment. It was made by wood to avoid the effects of metallic objects on the
RFID reader performance. It can move the reader along x and y direction with 2mm accuracy
in the 65cm
×62cm work area. Figure 6(b) shows the tag placement and Fig. 6(c) represents
the tags used in this experiment. All of the tags were aligned with one direction to reduce
directional difference of tag antenna sensitivity. However, the directional sensitivity of the
tag in this experiment was not significant and was ignorable. Next subsection will illustrate
the recognition of the tag and other sticker type tags. Figure 6(d) is the small portable type
RFID reader that can alter its transmission power from 15dBm to 30dBm. The antenna was
8cm
×8cm ceramic antenna and faced down to the floor at the 10cm above the floor.
198
Advanced Radio Frequency Identification Design and Applications
(a) The experimental equipment. (b) Tag placement for the experiment.
(c) The UHF RFID with casing
tag(CONFIDEX STEELWAVE
MICRO).
(d) The portable UHF RFID readers
used in the experiment.
Fig. 6. The experimental settings.
5.2 Experimental results for localization
Figure 7 shows the recognition ranges of a tag used in the experiment with different RFID
reader transmission powers. We can find that the recognition range increases according to the
power. The patterns are slightly ellipsoidal shape, however, we fit these patterns to circles and
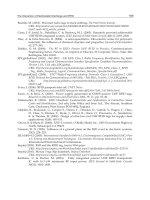
estimate the recognition ranges. Figure 8 represents the fitting result. The relation between
the reader transmission power and the reader recognition range seems to be linear, but we
can not have strong confidence to the linear relation in this experiment. Moreover, under
the different conditions such as different tags, antennas and height of antenna from the floor,
different relation can be found.
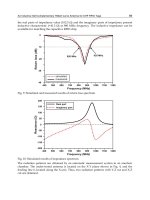
However, due to the relation linear like relation, Fig. 9, the error distance which is the
square root of the error variance can be interpreted without additional works. The relative
recognition range with respect to the tag grid (20cm) is (0.25,0.9). The simulation results that
we conducted have the data from recognition range is 0.5. Therefore, we can find the trend of
the position estimation error variance in Fig. 9 shows similar trends of the position estimation
error variance in Fig. 4 only in the range of 0.5 to 0.9. But the rest of recognition range need
more investigation. However, due to the relation linear like ship, Fig. 9, the error distance
which is the square root of the error variance can be interpreted without additional works.
The relative recognition range with respect to the tag grid (20cm) is (0.25,0.9). The simulation
results that we have starts from 0.5. Therefore, we can find the trend of Fig. 9 shows similar
trends of the position estimation error variance in Fig. 4 in the range of 0.5 to 0.9. But the rest
of recognition range need more investigation.
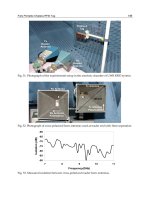
Figure 11 and Fig. 12 show the recognition ranges of other tags. The tags placed each conner
of the work area of the experimental equipment . The recognition data is sampled with
199
Improving Position Estimation of the
RFID Tag Floor Localization with Multiple Recognition Ranges
(a) 15dBm (b) 16dBm
(c) 17dBm (d) 18dBm
Fig. 7. A Recognition range of a tag with different transmission powers.
Fig. 8. Experimental result of the relation between reader transmission power and reader
recognition range
5cm
×5cm grid. These are “Inray” sticker type UHF RFID tags with 7cm×1.7cm dimension.
The tags have supreme recognition ranges. At the power of 15dBm, their recognition range
are already over 50cm. Long recognition range is good for the tag installation cost. However,
these tags have irregular recognition patterns and large difference of recognition ranges
between each tags. Tags of “Inray” types are hard to used for the RFID tag floor localization.
Figure 10 represents the fail rate which is the ratio of the number of samples that failed to
recognize tags, to the sample points. For the small powers, due to the small recognition
200
Advanced Radio Frequency Identification Design and Applications
Fig. 9. Experimental result of the relation between the position estimation error(square root
of the position estimation error variance) and the reader transmission power.
Fig. 10. Experimental result of recognition fail rate for the experiment.
Fig. 11. The recognition patterns of a “Inray” type tags with 15dBm transmission power of
RFID reader
ranges, the fail rate is high. High fail rate reads to error accumulation during the mobile
robot navigation application .
Table 1 shows the results of the random sampling post process of the acquired data previously
mentioned. We use three power levels for the multiple recognition ranges. However, in
201
Improving Position Estimation of the
RFID Tag Floor Localization with Multiple Recognition Ranges
Fig. 12. The recognition patterns of a “Inray” type tags with 17dBm transmission power of
RFID reader
Power combination(dBm) Position estimation error(cm) fail rate
(15,15,15) 6.471 0.6661
(16,16,16) 7.053 0.4781
(17,17,17) 7.389 0.3104
(18,18,18) 7.497 0.1407
(19,19,19) 7.367 0.0754
(20,20,20) 6.953 0.0209
(21,21,21) 6.872 0.0093
(22,22,22) 7.049 0.0025
(23,23,23) 6.922 0.0007
(24,24,24) 6.584 3.9E-005
(25,25,25) 6.080 2.7E-005
(16,19,25) 5.590 0.0009
(15,20,25) 5.634 0.0005
(15,19,25) 5.650 0.0011
(15,18,25) 5.674 0.0012
Table 1. The experimental results after the random sampling post process of the acquired
data. The position estimation errors are shown in cm.
real applications, the number of power levels and the combination of powers should be
determined with various considerations. The first eleven rows in Table 1 can be seen as the
result of the RFID tag floor localization with single recognition range. Since the multiple
sampling reduces the sample error variance, we used three same power levels for the single
power case, for the fair comparison with multiple recognition range case. The last four
rows represent the RFID tag floor localization method with multiple recognition ranges. The
combinations of the powers are selected by the position estimation errors.
We can see that the position estimation errors with the multiple recognition ranges are smaller
than the position estimation errors with single power. The recognition fail rates are smaller
than single recognition range cases with powers under 23dBm. The improvement of position
202
Advanced Radio Frequency Identification Design and Applications
estimation error of (16,19,25) case with respect to (25,25,25) is about 8%. Moreover, it can save
the energy of the RFID reader.
6. Minimum variance of position estimation as a bound of error
(a) Single power (r = 0.76) (b) Single power (r = 1.12)
(c) Multiple power (r = 0.76) (d) Multiple power (r = 1.12)
Fig. 13. Mapping points by the mean method and minimum variance method.
In this section, we will introduce the minimum variance of position estimation as the bound
of the position estimation error and extend it to the multiple recognition range case. Figure
13 shows the motivation of introducing the minimum variance of position estimation. As the
recognition range also grows, the number of mapping points that correspond to the partitions
is grows. As the number of partitions grows and the balance between each partitions are more
even, the position estimation error variance gets smaller.
In each figure in Fig 13, the
marks represent the mapping points produced by the mean
algorithm and the
marks represent the mapping points produced by the minimum variance
criteria. The mapping points based on the mean algorithm does not changed even if the
recognition range is changed. Moreover, for the some recognition ranges such as r
= 1, 12
in Fig. 13(b), the mapping points are out of their corresponding partitions. It leads to increase
of the error variance. If the mapping points are on the center of mass of the each partitions,
203
Improving Position Estimation of the
RFID Tag Floor Localization with Multiple Recognition Ranges
Fig. 14. The error variance and the minimum error variance of single power case.
Fig. 15. The error variance and the minimum error variance of multiple power case.
the position estimation error variance will be minimized and it is the motivation of minimum
error variance of position estimation.
However, in general, to find the minimum variance error bound analytically is not easy. We
used the Monte-Carlo simulation to find the minimum variance of position estimation of RFID
tag floor localization methods. The simulation setting is the same as Section 4.1. In addition,
we calculate the center of mass and the variances of the sample point of each partitions. The
results are represented in Fig. 14 and Fig. 15.
The minimum error variance can be used for the bound of position estimation error. The
position estimation based on the minimum variance mapping point has lower error variance
than the mean based position estimation. However, to find the minimum variance mapping
points, we should know exact recognition model of tags and properties of tags in the tag floor
must be even. The approximation of the dual problem of the minimum variance position
estimation can be found in (Bouet and Pujolle, 2009a;b). They estimated the moving RFID tag
with the fixed tags by approximating the center of mass with the virtual RFID tags.
7. Conclusion
In this chapter, we reviewed the researches on the RFID based localization methods, especially
the RFID tag floor localization methods. Then we introduced the mathematical formulation
of the RFID tag floor localization method and its performance index based on the position
estimation error variance. Moreover, we extend it to the multiple recognition range case.
Then, the improvement of the RFID tag floor localization system with multiple recognition
ranges is shown by the simulation results and the experimental results. And we extend the
error bound to the multiple recognition range case.
204
Advanced Radio Frequency Identification Design and Applications
However, for the practical application of mobile robots, we need to solve some problems.
There are still little researches on the effects of chassis, wheels, and metallic object on the floor
on recognition. Antenna emission patterns of the tags and the readers need to be studied
more and controlled for some ranges. Moreover, researches on effects of and counter plans to
irregularities of tags are required.
8. References
Bohn, J. and Mattern, F. (2004). Super-distributed RFID tag infrastructures. Lecture notes in
computer science, pages 1–12.
Borenstein, J. and Feng, L. (1996). Gyrodometry: A new method for combining data from
gyros and odometry in mobile robots. Ann Arbor, 1001, 48109–2110.
Bouet, M. and Pujolle, G. (2009a). L-VIRT: a 3-D range-free localization method for RFID
tags based on virtual landmarks and mobile readers. In Proceedings of the 6th IEEE
Conference on Consumer Communications and Networking Conference, pages 159–163.
Institute of Electrical and Electronics Engineers Inc., The.
Bouet, M. and Pujolle, G. (2009b). L-VIRT: Range-free 3-D localization of RFID tags based on
topological constraints. Computer Communications, 32(13-14), 1485–1494.
Burgard, D., Fox, D., and Philipose, K. (2004). Mapping and localization with RFID
technology. In IEEE International Conference on Robotics and Automation, pages
1015–1020.
Chae, H. and Han, K. (2005). Combination of rfid and vision for mobile robot localization.
pages 75 – 80.
Choi, B., Lee, J., and Lee, J. (2008). An improved localization system with RFID technology for
a mobile robot. In 34th Annual Conference of IEEE Industrial Electronics, 2008. IECON
2008, pages 3409–3413.
Everett, H. (1995). Sensors for mobile robots: theory and application. AK Peters, Ltd.
Gezici, S., Tian, Z., Giannakis, G., Kobayashi, H., Molisch, A., Poor, H., and Sahinoglu, Z.
(2005). Localization via ultra-wideband radios. IEEE Signal Processing Magazine,
22(4), 70.
Han, S., Lim, H., and Lee, J. (2007). An efficient localization scheme for a differential-driving
mobile robot based on RFID system. IEEE Transactions on Industrial Electronics, 54(6),
3362–3369.
Inácio, J., Gerald, J., and Ortigueira, M. (2005). New PN even balanced sequences
for spread-spectrum systems. EURASIP Journal on Wireless Communications and
Networking, 2005(3), 458.
Jia, S., Sheng, J., and Takase, K. (2008). Improvement of performance of localization id tag
using multi-antenna rfid system. pages 1715 –1718.
Kamol, P., Nikolaidis, S., Ueda, R., and Arai, T. (2007). Rfid based object localization
system using ceiling cameras with particle filter. Future Generation Communication
and Networking, 2, 37–42.
Kim, M. and Chong, N. Y. (2009). Direction sensing rfid reader for mobile robot navigation.
Automation Science and Engineering, IEEE Transactions on, 6(1), 44 –54.
Kulyukin, V., Gharpure, C., Nicholson, J., and Pavithran, S. (2004). RFID in robot-assisted
indoor navigation for the visually impaired. In 2004 IEEE/RSJ International Conference
on Intelligent Robots and Systems, 2004.(IROS 2004). Proceedings, pages 1979–1984.
Kulyukin, V., Gharpure, C., Nicholson, J., and Osborne, G. (2006). Robot-assisted wayfinding
for the visually impaired in structured indoor environments. Autonomous Robots,
21(1), 29–41.
205
Improving Position Estimation of the
RFID Tag Floor Localization with Multiple Recognition Ranges
Lee, H J., Kim, M. S., and Lee, M. C. (2007). Technique to correct the localization error of the
mobile robot positioning system using an rfid. pages 1506 –1511.
Luo, R., Chuang, C T., and Huang, S S. (2007). Rfid-based indoor antenna localization system
using passive tag and variable rf-attenuation. pages 2254 –2259.
Narayanan K., Ramakrishnan M., and Dr. Demarest K. (2005). Performance Benchmarks for
Passive UHF RFID Tags by,
Ni, L., Liu, Y., Lau, Y., and Patil, A. (2004). LANDMARC: indoor location sensing using active
RFID. Wireless Networks, 10(6), 701–710.
Park, S. and Hashimoto, S. (2009a). Autonomous mobile robot navigation using passive rfid
in indoor environment. Industrial Electronics, IEEE Transactions on, 56(7), 2366 –2373.
Park, S. and Hashimoto, S. (2009b). Indoor localization for autonomous mobile robot based
on passive RFID. In Proceedings of the 2008 IEEE International Conference on Robotics
and Biomimetics, pages 1856–1861. IEEE Computer Society.
Park, Y., Lee, J., and Kim, S. (2009). Improving position estimation on RFID tag floor
localization using RFID reader transmission power control. In Proceedings of the
2008 IEEE International Conference on Robotics and Biomimetics, pages 1716–1721. IEEE
Computer Society.
Park, Y., Lee, J. W., Kim, D., Jeong, J. J., and Kim, S W. (2010). Mathematical formuation of rfid
tag floor based localization and performance analysis for tag placement. ICARCV
2010, Singapore.
Patwari, N. and Hero III, A. (2003). Using proximity and quantized RSS for sensor localization
in wireless networks. In Proceedings of the 2nd ACM international conference on Wireless
sensor networks and applications, pages 20–29. ACM.
Priyantha, N. (2005). The cricket indoor location system. Ph.D. thesis, Citeseer.
RFID journal (n.d.). Frequently asked questions: The cost of rfid equipment.
http://www.rfidjournal.com/faq/20.
Sasiadek, J., Wang, Q., and Zeremba, M. (2000). Fuzzy adaptive Kalman filtering for INS/GPS
data fusion. In Proceedings of the 15th IEEE International Symposium on Intelligent
Control, pages 17–19. Rio, Patras, GREECE.
Senta, Y., Kimuro, Y., Takarabe, S., and Hasegawa, T. (2007). Machine learning approach to
self-localization of mobile robots using rfid tag. pages 1 –6.
Shih, S T., Hsieh, K., and Chen, P Y. (2006). An improvement approach of indoor location
sensing using active rfid. Innovative Computing ,Information and Control, International
Conference on, 2, 453–456.
Sue, K., Tsai, C., and Lin, M. (2006). FLEXOR: A flexible localization scheme based on RFID.
Information Networking. Advances in Data Communications and Wireless Networks, pages
306–316.
Zhao, Y., Liu, Y., and Ni, L. M. (2007). Vire: Active rfid-based localization using virtual
reference elimination. Parallel Processing, International Conference on,0,56.
Zhou, Y. and Liu, W. (2007). Preliminary research on indoor mobile robot localization using
laser-activated rfid. pages 78 –85.
Zhou, Y., Liu, W., and Huang, P. (2007). Laser-activated rfid-based indoor localization system
for mobile robots. pages 4600 –4605.
206
Advanced Radio Frequency Identification Design and Applications
11
Pseudorandom Tag Arrangement for
Accurate RFID based Mobile Robot Localization
Sungbok Kim and Hyunbin Kim
Department of Digital Information Engineering
Hankuk University of Foreign Studies
Republic of Korea
1. Introduction
The localization of a mobile robot is one key ingredient for autonomous navigation, along
with map building and obstacle detection/avoidance (Borenstein, J., et al., 1996). Several
sensors have long been used for mobile robot localization, but all of them are confronted
with their own inherent limitations. Encoder suffers from error accumulation,
ultrasonic/laser sensor demands the line of sight, camera expends complicated processing,
and GPS works at low resolution. To cope with these problems of typical sensors, new
attempts have been made, which use the RFID system consisting of tags, antenna, and
reader for mobile robot localization (Finkenzeller, K., 2000).
There have been two different research groups of working on the RFID based mobile robot
localization. Both groups assume that a set of tags storing the absolute positional
information are deployed throughout a navigation environment. In one group, either active
or passive tags are installed along the wall and they are used as beacons or landmarks to
guide the navigation of a mobile robot (Kubitz, O., et al., 1997; Kantor, G., et al., 2002;
Hahnel, D., et al., 2004; Kulyukin, V., et al., 2004; Penttila, K., et al., 2004; Yamano, K., et al.,
2004; Kim, B.K., et al., 2006; Vorst, P., et al., 2008). However, in the other group, passive tags
are installed on the floor and they are used to indicate the current position of a mobile robot
(Bohn, J., et al., 2004; Choi, J., et al., 2006; Kim, B.K., et al., 2006; Han, S., et al., 2007; Kodaka,
K., et al., 2008). This paper belongs to the latter group.
When an antenna senses a tag on the floor, there involves the positional uncertainty within
the sensing range, which degrades the performance of RFID based mobile robot localization.
One simple way of alleviating such a limitation may be to increase the tag distribution
density on the floor. If more than one tag is sensed by an antenna at one instant, the current
position of a mobile robot can be estimated more accurately by utilizing multiple tag
readings (Han, S., et al., 2007; Kodaka, K., et al., 2008). However, the increased tag
distribution density may be accompanied by the economical problem of high tag installation
cost and the technical problem of incorrect tag readings.
For a given tag distribution density, the performance of RFID based mobile robot
localization is affected by how a set of tags are arranged over the floor. There have been a
variety of tag arrangements considered so far, which can be categorized into three repetitive
arrangements, including square, parallelogram, and tilted square. Depending on the
Advanced Radio Frequency Identification Design and Applications
208
localization method, the tag arrangement can be optimized for improved localization
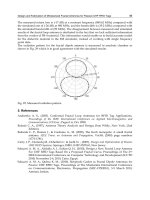
performance. It is claimed that the triangular pattern is optimal in (Han, S., et al, 2007).
In this paper, we present a pseudorandom RFID tag arrangement for improved performance
of mobile robot localization. This paper is organized as follows. With the underlying
assumptions, Section 2 describes a mobile robot localization method using spatial and
temporal information. Section 3 examines four repetitive tag arrangements, including
square, parallelogram, tilted square, and equilateral triangle, in terms of tag installation and
tag invisibility. Inspired from the Sudoku puzzle, Section 4 proposes the pseudorandom tag
arrangement for reduced tag invisibility without increased installation difficulty. Section 5
gives some experimental results. Finally, the conclusion is made in Section 6.
2. Mobile robot localization
In RFID based mobile robot localization, a mobile robot equipped with an antenna at the
bottom navigates over the floor covered with a set of tags. As a mobile robot moves around,
an antenna often senses tags that are located within the sensing range. For simplicity, let us
assume that the sensing range of an antenna is circular and the shape of a tag is a point. For
explanation, it is convenient to exchange the roles between antenna and tag, in such a way
that a point shape antenna passes through the circular range of a sensed tag. This is
illustrated in Fig. 1.
Fig. 1. Mobile robot trajectory over the floor covered with tags
The number of tags sensed by an antenna at one instant is assumed to be either one or zero.
This assumption of low tag distribution density will be valid especially for lower end
personal/service robots in home/office environments. Next, a mobile robot is assumed to
travel along a trajectory consisting of a series of linear segments, as shown in Fig. 1. For each
linear segment, a mobile robot standing still at the beginning changes the steering angle,
then forwards at a constant speed, and finally stops at the end. It is also assumed that a
mobile robot moves at a human walking speed, so that the time required for self-rotation or
acceleration/deceleration is negligible compared with the constant speed line traveling time
along the linear segment.