Wind Tunnels and Experimental Fluid Dynamics Research Part 9 ppt
Bạn đang xem bản rút gọn của tài liệu. Xem và tải ngay bản đầy đủ của tài liệu tại đây (3.93 MB, 40 trang )
Wind Tunnels and Experimental Fluid Dynamics Research
308
Fig. 3. Mean Wind Speed Profile, Turbulence Intensity Profiles, and Wind Spectra (L is the
Integral Scale)
Fig. 4. Two Different Configurations were used
Tall Buildings Under Multidirectional Winds: Response Prediction and Reduction
309
Fig. 5. Pressures on the Outer Surfaces of a Scaled 1:100 Model were Obtained from a Wind
Tunnel Test: (a) Pressure Tap Distribution (Elevation and Side View), (b) Mean Surface
Pressure Coefficient Distribution (for 292.5 deg)
Fig. 6. Wind Load Estimation from Pressure Data: The Tributary Area of Floor N was
Divided into Smaller Areas; Pressure Forces Acting on each Smaller Area, A
i,j
, were
Calculated Based on Pressure Data at the Nearest Pressure Tap, m
Wind Tunnels and Experimental Fluid Dynamics Research
310
The state equation of the ROS that corresponds to the full order system (FOS) in Eq. (8) can
be expressed as
f=++
(10)
in which
[; ]
′′
=
is the 32-dimensional state vector, is a vector of the in-plane
displacements of floors 3, 6, 9, 12, 16, 19, 22, 26, 29, 32, 35, 38, 41, 44 and 48 in addition to the
displacement of the inertial mass of the damper. is a (32×32) system matrix, is a 32
location vector, and is a 32 excitation vector. In this reduced system, the wind loads acting
on each of the 15 floors are computed from the wind loads acting on each of the 48 floors
by lumping wind forces on adjacent floors at the locations that correspond to the 15 DOF
model.
The controlled output vector,
c
, and the measured output,
m
, of the ROS described by Eq.
(10) can be expressed as
cc c cx
mm m mx
f
f
ν
=+ +
=+ + +
(11)
where
c
,
c
, F
c
,
m
,
m
and
m
are matrices with appropriate dimensions and ν is the
measurement noise vector. The model used for controller design was further reduced as
follows:
rrrrrx
cr cr r cr cr x
mr mr r mr mr x r
f
f
f
ν
=++
=++
=+++
(12)
where
r
is a 6-dimensional state vector of the reduced order system;
cr
is a controlled
output vector identical of
c
defined by Eq. (11);
mr
is the measured output vector; ν
r
is the
measurement noise and
cr
,
cr
,
cr
,
mr
,
mr
and
mr
are appropriate matrices.
3. Controllers and limitations
In this study, both TMDs and ATMDs are used for the reduction of the lateral responses of
the building. However, in order to make the design of such control systems more realistic
and applicable, the following restrictions and assumption were applied:
• The mass of the TMD in the x-direction is 100 ton, while the mass of the TMD in the y-
direction is 150 ton. Such restrictions are applied to avoid excessive weight on the roof
(the overall mass on the roof is about 0.625% of the overall building’s mass).
• The TMDs are tuned to the first vibrational mode in each corresponding lateral
direction. The damping factor is taken to be 20% of the critical. This amount of damping
is selected higher than the optimal value for the sake of restricting the stroke of the
ATMDs.
• The maximum stroke of the actuators is restricted to 1.5 m.
• The maximum control force of the actuator in the y-direction is restricted to 100 kN, and
that in the x-direction is restricted to 25 kN.
• The computational delay and the sampling rate of the digital controller are 0.001 s.
• Three acceleration measurements are available for each lateral direction.
Tall Buildings Under Multidirectional Winds: Response Prediction and Reduction
311
Note that the tower required a TMD with heavier mass and ATMD with higher control force
in one lateral direction than the other, which was basically attributed to geometry.
A Linear-quadratic regulator (LQR) design with output weighting is selected to give the
desired control force using the MATLAB function (lqry.m). The state-feedback law f =
r
minimizes the cost function
0
() ( )
mr mr
Jf f fdt
∞
′′
=+
(13)
where is the feedback gain matrix, z
r
is a 6-dimensional state vector of the reduced order
system, y
mr
is the measured output vector, the symbol (‘) denotes transpose, and are
weighting matrices. Parametric studies were performed with various weighting matrices ,
corresponding to various regulated output vectors. The results of these parametric studies
indicated that an effective controller could be designed by selecting a vector of regulated
responses to include the velocities of each floor.
For comparison reasons, fuzzy logic controllers are used in this study to command the
actuators of the ATMDs (see Nguyen et al. 2003). From a design point of view, fuzzy logic
controllers do not require the complexity of a traditional control system. The measured
accelerations can be used directly as input to the fuzzy controller. The main advantages of
using a fuzzy control algorithm are summarized in Battaini, et al. (1998) and Samali, et al.
(2004). According to Samali, et al. (2004), uncertainties of input data are treated in a much
easier way by fuzzy control theory than by classical control theory. Since fuzzy controllers are
based on linguistic synthesis, they possess inherent robustness. Fuzzy controllers can be easily
implemented in a fuzzy chip with immediate reaction time and autonomous power supply.
Furthermore, the design of fuzzy controller does not require state reduction or concerning
about observers. Only two acceleration measurements were used (floor 30 and roof).
The input variables to the fuzzy controller were selected as accelerations of floors 30 and 48,
and the output as the control force. The membership functions for the inputs were defined
and selected as seven triangles with overlaps as shown in Fig. 7. For the output, they were
defined and selected as nine triangles with overlaps as shown in Fig. 8. The fuzzy variables
used to define the fuzzy space are ZR (zero), PVS (positive very small), PS (positive small),
PM (positive medium), PL (positive large), PVL (positive very large), NVS (negative very
small), NS (negative small), NM (negative medium), NL (negative large), and NVL
(negative very large). The rule-base for computing the desired current is presented in Table
2 (Samali, et al. 2004).
Acceleration of
48th floor
Acceleration of 30th floor
NL NM NS ZR PS PM PL
NL
NM
NS
ZR
PS
PM
PL
PVL PVL PL PVS ZR ZR ZR
PL PL PM PVS ZR ZR ZR
ZR NVS PM PS PVS ZR ZR
ZR ZR NVS ZR PVS ZR ZR
ZR ZR NVS NS NM PVS ZR
ZR ZR ZR NVS NM NL NL
ZR ZR ZR NVS NL NVL NVL
Table 2. Control Rule Base (Samali, et al. 2004)
Wind Tunnels and Experimental Fluid Dynamics Research
312
Fig. 7. Membership Functions for the Input Measured Accelerations in the x-direction (Acc-
x-30, Acc-x-48) and the y-direction (Acc-y-30, Acc-y-48)
Fig. 8. Membership Functions for the Output Control Force in the x-direction (Force-x) and
the y-direction (Force-y)
Tall Buildings Under Multidirectional Winds: Response Prediction and Reduction
313
4. Results and discussion
Table 3 gives the response of the top corner of the building in the y-direction for an incident
angle of 0° under different consideration of mode shapes. It is shown that the displacement
response of this building is dominated by the first lateral mode in the y-direction (modes 1:2 in
the table). Nevertheless, this underestimates the displacement response by 3 % to 4.4 % and the
acceleration response by about 12 % to 17 %. Note that the aspect ratio of this building in the y-
direction is about 11. This means that for very slender buildings, solo consideration of the first
lateral mode may lead to significant error in the estimation of the response, especially for the
acceleration response. Table 4 lists the response of the top corner of the tower in the x-direction
for an incident angle of 90° under different consideration of mode shapes. It is shown that the
displacement and acceleration response are dominated by the first lateral mode in the x-
direction (modes 1 in the table). Note that the aspect ratio of this building in the x-direction is
about 3.6. This means that for buildings with low aspect ratio, solo consideration of the first
lateral mode may be sufficient for the estimation of the response. Fig. 9 shows the power spectra
of the acceleration response of the top corner of the building in the two lateral directions. The
figure shows that the third mode (torsion) contributes significantly to the acceleration in the y-
direction. In general, results given by Table 3, Table 4, and Fig. 9 show that the responses of tall
buildings under winds are dominated by the first few modes (for this specific building, the first
two lateral modes and the first torsional mode can be sufficient).
Mode
RMS-disp.
(m)
Max-disp.
(m)
RMS-accel.
(m/s
2
)
Max-accel.
(m/s
2
)
1 0.000 (-100 %) 0.001 (-99.8 %) 0.000 (100 %) 0.001 (-99.9 %)
1:2 0.129 (-4.4 %) 0.587 (-2.8 %) 0.199 (-17.1 %) 0.855 (-11.8 %)
1:3 0.136 (0.7 %) 0.613 (1.5 %) 0.238 (-0.8 %) 0.980 (1.1 %)
1:4 0.136 (0.7 %) 0.613 (1.5 %) 0.238 (-0.8 %) 0.980 (1.1 %)
1:5 0.135 (0 %) 0.606 (0.3 %) 0.239 (-0.4 %) 0.966 (-0.3 %)
1:6 0.135 (0 %) 0.604 (0 %) 0.240 (0 %) 0.969 (0 %)
Table 3. Response of the Top Corner of the Tower in the y-direction for an Incident Angle of 0°
Mode
RMS-disp.
(m)
Max-disp.
(m)
RMS-accel.
(m/s
2
)
Max-accel.
(m/s
2
)
1
0.188 (1.1 %) 0.646 (-0.5 %) 0.203 (-0.5 %) 0.654 (-3.5 %)
1:2 0.188 (1.1 %) 0.646 (-0.5 %) 0.203 (-0.5 %) 0.654 (-3.5 %)
1:3 0.187 (0.5 %) 0.648 (-0.2 %) 0.204 (0 %) 0.653 (-3.7 %)
1:4 0.186 (0 %) 0.649 (0 %) 0.204 (0 %) 0.676 (-0.3 %)
1:5 0.186 (0 %) 0.649 (0 %) 0.204 (0 %) 0.676 (-0.3 %)
1:6 0.186 (0 %) 0.649 (0 %) 0.204 (0 %) 0.678 (0 %)
Table 4. Response of the Top Corner of the Tower in the x-direction for an Incident Angle of 90°
Wind Tunnels and Experimental Fluid Dynamics Research
314
Fig. 9. Power Spectra of the Acceleration Response of the Top Corner of the Building in the
Two Lateral Directions
Fig. 10 gives displacement and acceleration responses of a point at the top corner of the
building for the FEM, the 3D full order system (3D-FOS), and the 3D reduced order system
(3D-ROS). The figure shows that the response in terms of displacements and accelerations
for the three types of modeling are very much the same. This means that FE modeling, 3D
lumped mass modeling, and 3D reduced order modeling of tall buildings under wind loads
can give an accurate assessment of the response provided that the first dominant modes are
retained. The figure shows also that the cross-wind response is higher than the along-wind
response. This reveals the importance of the procedure proposed in this study as many
design codes and formula may provide accurate estimate of the along-wind response but
less guidance for the estimation of the critical cross-wind and torsional response. The results
show that the building is very much vulnerable to wind loads. This may be due to its low
weight along with low dominant frequencies.
The building required a TMD with heavier mass and ATMD with higher control force in one
lateral direction than the other. This may be attributed to geometry. Figures 11-14 show the
controlled and uncontrolled responses of the tower under wind loads for two test
configurations at different incident angles. Two examples of control are considered, TMDs
and ATMDs with LQR and fuzzy logic controllers. For each example, the controlled
responses in the x and y directions are plotted with the uncontrolled responses. The
controlled and uncontrolled responses of the tower are evaluated by simulations (MATLAB
2008). Four evaluation criteria are used to examine the performance of the proposed
controllers. Evaluation criteria include: rms-displacements, maximum displacements, rms-
accelerations, and maximum accelerations of the top corner of the tower in the two lateral
directions. The figures are superimposed by ellipses indicating the position of the most
unfavourable responses (uncontrolled, with TMDs, with ATMDs [LQR], and with ATMDs
[fuzzy]) over the two configurations in both x and y directions. The percentage of reduction
in the highest response achieved by TMDs and ATMDs over the worst uncontrolled
response is indicated in the figures.
Tall Buildings Under Multidirectional Winds: Response Prediction and Reduction
315
Fig. 10. Displacement and Acceleration Responses of a Point at the Top Corner for FEM, 3D
Full Order System (3D-FOS), and 3D Reduced Order System (3D-ROS)
Wind Tunnels and Experimental Fluid Dynamics Research
316
Fig. 11. RMS-Displacements of the Top Corner of the Tower
Tall Buildings Under Multidirectional Winds: Response Prediction and Reduction
317
Fig. 12. Maximum Displacements of the Top Corner of the Tower
Wind Tunnels and Experimental Fluid Dynamics Research
318
Fig. 13. RMS-accelerations of the Top Corner of the Tower
Tall Buildings Under Multidirectional Winds: Response Prediction and Reduction
319
Fig. 14. Maximum Accelerations of the Top Corner of the Tower
Wind Tunnels and Experimental Fluid Dynamics Research
320
Figures 11 and 12 give controlled and uncontrolled rms-displacements and max-
displacements of the top corner of the tower in both the x and y directions. It is shown that
TMDs have a great effect on the reduction of the displacement response of the building.
Reductions achieved by TMDs in the displacements responses range from 22-30 % over the
worst uncontrolled response. Generally, TMDs are able to give good reduction in the rms-
displacements in both the x and y directions for all wind incident angles. Reductions
achieved by ATMDs in the displacement responses range from 29-43 % over the worst
uncontrolled response. ATMDs with fuzzy logic controllers are able to enhance the
reduction in the displacement responses over LQR most of the time (by about 1% to 5%).
They also have a general similar trend over all of the wind attack angles.
Figures 13 and 14 give controlled and uncontrolled rms-accelerations and maximum
accelerations of the top corner of the tower in both the x and y directions. It is shown that
the TMDs have a significant effect on the reduction of the acceleration response of the
building. Reductions achieved by TMDs in the acceleration responses range from 16-30 %
over the worst uncontrolled response.
Generally, TMDs are able to give good reduction in the rms-displacements in both the x and
y directions for all of the wind incident angles. However, the performance is limited in
reducing the along-wind maximum acceleration of the tower in the y-direction under
Config. # 2, when the wind attack angle is 90
o
. This may be due to the interference effects of
two high-rise buildings in the oncoming wind (see Fig. 4). Results also show that ATMDs
are able to enhance the reduction in the responses. Reductions achieved by ATMDs in the
acceleration responses range from 21-43 % over the worst uncontrolled response. ATMDs
with fuzzy logic controllers are able to enhance the reduction in the acceleration responses
like LQR, and in general, they have a similar trend over all of the wind incident angles.
As a general comment on Figures 11-14, one can see that the performance of the controllers
is much better in the x-direction. In addition, the capability of the controllers to reduce the
responses (especially maximum accelerations at angles 0
o
and 180
o
) in the y-direction is
limited. This may be due to the effect of vortex shedding on the across-wind responses.
Moreover, the structure is slender in x-direction (see Fig. 2). The structure is also stiffer in
the y-direction (see Table 1 for natural frequencies). However, the procedure presented in
this study permits the response of tall buildings to be assessed and controlled in the
preliminary design stages which can help decision makers, involved in the design process,
to choose among innovative design solutions like structural control, considering several
damping techniques, modifying geometry, or even changing materials (e.g., from steel to
concrete).
5. Conclusions
This chapter presents practical procedure for the response prediction and reduction in high-
rise buildings under wind loads. To show the applicability of the procedure, aerodynamic
loads acting on a quasi-rectangular high-rise building based on an experimental approach
(surface pressure measurement) are used with a mathematical model of the structure for the
response prediction and reduction. The building represents a case study of an engineered
design of a very slender tower that is instructive. The conclusions can be summarized as
follows:
1.
The methodology based on HFPI and FEM proposed for the estimation of the response
of high-rise buildings under wind loads has the advantage of combining lateral along-
Tall Buildings Under Multidirectional Winds: Response Prediction and Reduction
321
wind, lateral cross-wind, and torsional responses altogether. The technique allows for
the consideration of any number of modes.
2.
Results show that the responses of tall buildings under winds are dominated by the first
few modes. Consequently, FEM, 3D lumped mass modeling, and reduced order 3D
modeling of tall buildings under wind loads give an accurate assessment of the
response provided that the first dominant modes are retained.
3.
Results show that the response of tall buildings in the cross-wind direction (lateral
response combined simultaneously with torsion) can be higher than the response in the
along-wind direction. This reveals the importance of the procedure proposed in this
study as many design codes and formula may provide accurate estimate of the along-
wind response but less guidance for the estimation of the critical cross-wind and
torsional response.
4.
The building represents an engineered steel design of a structure that is very much
vulnerable to wind loads. This may be due to its low weight as well as high flexibility
related to the low dominant frequencies and the high aspect ratio.
5.
The building demands TMD with heavier mass and ATMD with higher control force in
one lateral direction than the other. This may be attributed to geometry.
6.
For the purpose of the use of active control, LQR and fuzzy logic controllers are shown
to be effective in enhancing the response reduction over the TMD. ATMDs with fuzzy
logic controllers show similar trend like LQR controllers under multidirectional wind
loads. In addition, from a design point of view, fuzzy logic controllers do not require
the complexity of traditional control systems.
7.
The procedure presented in this chapter permits the response of tall buildings to be
assessed and controlled in the preliminary design stages. This can help decision makers,
involved in the design process, to choose among innovative design solutions like
structural control, considering several damping techniques, modifying geometry, or
even changing materials.
6. Acknowledgements
The authors would like to express appreciation to the work team at the Wind Tunnel of
Politecnico di Milano, Milan, Italy. The first author wishes to thank Ms Corey Ginsberg,
Florida International University, for her helpful comments.
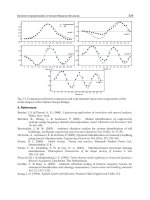
7. References
Aly, A.M. (2009). On the dynamics of buildings under winds and earthquakes: Response
Prediction and Reduction. Ph.D. Dissertation, Department of Mechanical
Engineering, Politecnico di Milano, Milan.
Aly, A.M. and Christenson, R.E. (2008a), “On the evaluation of the efficacy of a smart
damper: a new equivalent energy-based probabilistic approach”, Smart Mater.
Struct., 17 045008 (11pp). DOI: 10.1088/0964-1726/17/4/045008
Aly, A.M., Resta, F. and Zasso, A. (2008b), “Active Control in a High-Rise Building under
Multidirectional Wind Loads”, SEI 2008 Structures Congress, Vancouver, Canada.
DOI: 10.1061/41016(314)285
Wind Tunnels and Experimental Fluid Dynamics Research
322
Aly, A.M., Zasso, A. and Resta, F. (2011), “On the dynamics of a very slender building under
winds: response reduction using MR dampers with lever mechanism”, Struct. Des.
Tall Spec. Build., 20(5), 541-553. DOI: 10.1002/tal.646
ASCE 7-05 (2006) Minimum design loads for buildings and other structures. American
Society of Civil Engineers, 424 pages. ISBN: 0784408092
Attaway S. (2009). Matlab: A Practical Introduction to Programming and Problem Solving.
Butterworth-Heinemann: Amsterdam.
Battaini, M., Casciati, F. and Faravelli, L. (1998), “Control algorithm and sensor location,”
Proc., 2nd World Conf. on Structural Control, Kyoto, Japan, 1391–1398.
Chen, S.X. (2010), “A More Precise Computation of Along Wind Dynamic Response
Analysis for Tall Buildings Built in Urban Areas”, Engineering, 2, 290-298.
DOI: 10.4236/eng.2010.24038
Davison, E.J. (1966) “A method for simplifying linear dynamic systems”, IEEE Transactions
on Automatic Control, AC-11(1), 93–101.
Diana, G., De Ponte, S., Falco, M. and Zasso, A. (1998), “New large wind tunnel for civil
environmental and aeronautical applications”, J. Wind Eng. Ind. Aerodyn., (74-76),
553-565. DOI: 10.1016/S0167-6105(98)00050-6
Eurocode 1. (2004). Actions on structures - Part 1-4: General actions - Wind actions. prEN
1991-1-4, European Standard.
Facioni, R.J., Kwok, K.C.S. and Samali, B. (1995), “Wind tunnel investigation of active
vibration control of tall buildings”, J. Wind Eng. Ind. Aerodyn., (54-55), 397-412.
DOI: 10.1016/0167-6105(94)00056-J
Gu, M. and Peng, F. (2002), “An experimental study of active control of wind-induced
vibration of super-tall buildings,” J. Wind Eng. Ind. Aerodyn., 90, 1919-1931. DOI:
10.1016/S0167-6105(02)00298-2
Homma, S., Maeda, J., Hanada, N. (2009), “The damping efficiency of vortex-induced
vibration by tuned-mass damper of a tower-supported steel stack”, Wind Struct.,
An Int. Journal, 12(4), 333-347.
Housner, G.W., Bergman, L.A., Caughey, T.K., Chassiakos, A.G., Claus, R.O., Masri, S.F.,
Skelton, R.E., Soong, T.T., Spencer, B.F., J., Yao, T.P. (1997), “Structural control:
Past, present, and future”, J. of Eng. Mech ASCE, 123(9), 897-971. DOI:
10.1061/(ASCE)0733-9399(1997)123:9(897)
Huang, M.F., Tse, K.T., Chan, C.M., Kwok, K.C.S., Hitchcock, P.A., Lou, W.J., Li, G. (2010),
“An integrated design technique of advanced linear-mode-shape method and
serviceability drift optimization for tall buildings with lateral–torsional modes”,
Eng. Struct., 32(8), 2146-2156. DOI: 10.1016/j.engstruct.2010.03.017
Kwon, D., Kijewski-Correa, T., Kareem, A. (2008). “e-Analysis of High-Rise Buildings
Subjected to Wind Loads”, J. Struct. Eng ASCE, 134(7), 1139-1153. DOI:
10.1061/(ASCE)0733-9445(2008)134:7(1139)
Lam, K.M. and Li, A. (2009), “Mode shape correction for wind-induced dynamic responses
of tall buildings using time-domain computation and wind tunnel tests”, J. Sound
Vibr., 322(Issues 4-5), 740-755. DOI: 10.1016/j.jsv.2008.11.049
Li, C., Han, B., Zhang, J., Qu, Y. and Li, J. (2009), “Active Multiple Tuned Mass Dampers for
Reduction of Undesirable Oscillations of Structures under Wind Loads”, Int. J.
Struct. Stab. Dyn., 9(1), 127-149.
Tall Buildings Under Multidirectional Winds: Response Prediction and Reduction
323
DOI: 10.1142/S0219455409002928
Lu, L.T., Chiang, W.L., Tang, J.P., Liu, M.Y. and Chen, C.W. (2003), “Active control for a
benchmark building under wind excitations”, J. Wind Eng. Ind. Aerodyn., 91(4), 469-
493. DOI: 10.1016/S0167-6105(02)00431-2MATLAB, User Guide. The MathWorks,
Inc, 2008.
McNamara, R.J. (1977) “Tuned Mass Dampers for Buildings”, J. of Struct. Division, ASCE,
103(9), 1785-1798.
Mohtat, A., Yousefi-Koma, A. and Dehghan-Niri, E. (2010), “Active vibration control of
seismically excited structures by ATMDs: Stability and performance robustness
perspective”, Int. J. Struct. Stab. Dyn., 10(3), 501-527. DOI:
10.1142/S0219455410003592
Nguyen, H.T., Nadipuram, R.P., Walker, C.L. and Walker, E.A. (2003), A first course in
fuzzy and neural control, Chaoman & Hall/CRC, Boca Raton, FL.
Park, S.J., Lee, J., Jung, H.J., Jang, D.D. and Kim, S.D. (2009), “Numerical and experimental
investigation of control performance of active mass damper system to high-rise
building in use”, Wind Struct., An Int. Journal, 12(4), 313-332.
Samali, B., Al-Dawod, M., Kwok, K.C. and Naghdy, F. (2004), “Active control of cross wind
response of 76-story tall building using a fuzzy controller”, J. of Eng. Mech ASCE,
130, p. 492-498.
DOI: 10.1061/(ASCE)0733-9399(2004)130:4(492)
Simiu, E. (2009), “Wind loading codification in the Americas: Fundamentals for a renewal”,
Proceedings of 11
th
Americas Conference on Wind Engineering, San Juan, PR, USA, June
22-26.
Simiu, E., Gabbai, R.D. and Fritz, W.P. (2008), “Wind-induced tall building response: a
time-domain approach”, Wind Struct., An Int. Journal, 11(6), 427-440.
Soong, T.T. (1990). Active Structural Control. Theory and Practice. Longman.
Tse, K.T., Hitchcock, P.A. and Kwok, K.C.S. (2009), “Mode shape linearization for HFBB
analysis of wind-excited complex tall buildings”, Eng. Struct., 31(3), 675-685. DOI:
10.1016/j.engstruct.2008.11.012
Wu, J. R., Li, Q.S. and Tuan, A.Y. (2008), “Wind-induced lateral-torsional coupled responses
of tall buildings”, Wind Struct., An Int. Journal, 11(2), 153-178.
Wu, J.C. and Pan, B.C. (2002), “Wind tunnel verification of actively controlled high-rise
building in along-wind motion”, J. Wind Eng. Ind. Aerodyn., 90(12-15), 1933-1950.
DOI: 10.1016/S0167-6105(02)00299-4
Wu, J.C., Yang, J.N., Schmitendorf, W. (1998), “Reduced-order H∞ and LQR control for
wind-excited tall buildings,” J. Eng. Struct., 20(3), 222-236.
Yao, J.T.P. (1972), “Concept of Structural Control”, J. of Struct. Division, ASCE, 98(7), 1567-
1574.
Zasso, A., Giappino, S., Muggiasca, S. and Rosa, L. (2005), “Optimization of the boundary
layer characteristics simulated at Politecnico di Milano Boundary Layer Wind
Tunnel in a wide scale ratio ranger”, The Sixth Asia-Pacific Conf. on Wind Eng.,
Seoul, Korea.
Zhou, Y., Kijewski, T., Kareem, A. (2003), “Aerodynamic Loads on Tall Buildings:
Interactive Database”, J. Struct. Eng ASCE, 129(3), 394-404. DOI:
10.1061/(ASCE)0733-9445(2003)129:3(394)
Wind Tunnels and Experimental Fluid Dynamics Research
324
Zhou, Y, Wang, D.Y. and Deng, X.S. (2008), “Optimum study on wind-induced vibration
control of high-rise buildings with viscous dampers”, Wind Struct., An Int. Journal,
11(6), 497-512.
15
Wind Tunnel Tests on the
Horn-Shaped Membrane Roof
Yuki Nagai, Akira Okada, Naoya Miyasato and Masao Saitoh
College of Science and Technology, Nihon University
Japan
1. Introduction
Membrane structure is tensile surface structure consisted by textile. The materials used for
architectural membranes generally consist of a woven fabric coated with a polymeric resin
(Seidel & David, 2009). For example, PVC coated polyester fabrics and PTFE coated glass
fabrics are commonly used. Membrane structures provide widespan enclosures of great
spatial interest and variety require minimal supporting elements of "hard" structure and
provide very good overall levels of natural daylight. Membrane structures create various
forms. In the architecture and civil engineering area, membrane forms and systems are
divided into two categories, namely “pneumatic membrane” and “tensile membrane”
shown in figure 1 (Saitoh, 2003). The pneumatic membrane such as “BC Place (1983)”
Fig. 1. Structural Systems and forms of Membrane structures
Wind Tunnels and Experimental Fluid Dynamics Research
326
(Janberg, 2011a) and “Tokyo Dome (1988)” (Shinkenchiku-Sha Co. Ltd., 1988) is supported
by internal pressure. On the other hand, the tensile membrane keeps stabile by form and
tensile force of itself. For example, “high point surfaces”, which are called “horn-shaped
membrane” in this paper, are pulled to one or more high points from inside or outside.
A Wind load is the most dominant load for light-weight structures such as the membrane
structures. Therefore, verification against wind load is important for membrane structures.
The engineer usually use the wind tunnel test and CFD simulation to evaluate the wind load
for membrane structures. In recent years, the CFD simulation becomes major with the
development of computers. But the wind tunnel test for membrane is sometimes useful to
evaluate the wind pressure, because the membrane structure has complex form.
From this points of view, this paper describes about wind tunnel tests of a membrane roof
focusing on the horn-shaped membrane roof.
The horn-shaped membrane roof divides into ‘stand-alone type’ and ‘multi-bay type’ as
shown in figure 2. The stand-alone type is consisted by one unit horn-shaped membrane,
and it is often used as temporally space without wall. On the other hand, the multi-bay type
consists several horn units, and it is used as roofs of parking spaces, stands without wall,
and as roofs of gymnasium hall with wall. These horn shaped membrane structures are
supported by cables, struts, and so on.
In general, there are three types of wind-tunnel test on the membrane roof, namely “Local
Pressures Test”, “Area and Overall Wind Loads Tests” and “Aeroelastic Tests” as shown in
figure 3 (Cermak & Isyumov, 1998).
According to American Society of Civil Engineers (ASCE), “local pressure tests” use scaled
static models instrumented with pressure taps (see figure 3(a)). These tests provide
information on the mean and fluctuating local pressures on cladding and roof components.
“Area and overall wind loads tests” are tests of wind load on specific tributary areas, using
scaled static models and spatial or time averaging of the simultaneously acting local
pressures (see figure 3(b)). These tests provide information on mean and fluctuating wind
load on particular tributary area due to external or internal pressures, or both. “Local
pressure tests” and “area and overall wind loads tests” measure wind pressures and wind
forces acting on buildings around buildings. These wind tunnel tests need to consider the
model scale depending on wind scale and time scale.
On the other hand, “aeroelastic tests” use dynamically scaled models of buildings and
structures (see figure 3(c)). These tests provide information on the wind-induced response of
buildings and structures due to all wind-induced force, including those which are
experienced by objects that move relative to the wind. In addition, these tests measure the
overall mean and dynamic loads and response of buildings and structures, including
displacements, rotations and accelerations. These tests have to consider stiffness scale in
addition to model scale. This paper focuses on the local pressures tests. The wind local
pressure around membrane roof was measured by scaled static models, and then wind
pressure coefficients were calculated by dynamic pressure.
In these tests, it is important to model the wind in the wind tunnel in order to obtain wind-
effect data representative of full-scale conditions. In general, natural wind around buildings
is duplicated using turbulent boundary layer flow which simulates a velocity scale, an
aerodynamic roughness length of terrain, a gradient wind height of boundary-layer, and a
scale of turbulence. The methods of modeling wind and similarly model are shown in
guidelines and building standards of each country.
This paper reports results under a uniform flow in the chapter 4 and 5, because of
comparing effects for the model scale, the velocity and etc. as simply as possible. And then,
chapter 6 presents the result under a turbulent boundary layer flow.
Wind Tunnel Tests on the Horn-Shaped Membrane Roof
327
Tsukuba Expo., Japan(1985) Rest Dome, Japan(1989)
(a)
Stand-alone Type
Fig. 2. Examples of the horn-shaped membrane roof (Saitoh & Kuroki, 1989; Janberg, 2011b;
Shinkenchiku-Sha Co. Ltd., 1992; Shinkenchiku-Sha Co. Ltd., 2007)
Hyper Dome E, Japan (1990)
Kashiwa no Mori, Japa
n
(2008)
(b) Multi-bay Type
Lord’s Cricket Ground, UK (1987)
Wind Tunnels and Experimental Fluid Dynamics Research
328
Fig. 3. Three types of the wind tunnel tests for membrane roofs
1.1 Past research about the wind tunnel on the horn shaped membrane structures
Wind pressure coefficients of typical building type such as box-type are defined in
guidelines and standards in each country, but wind pressure coefficients of complicated
shapes such as the horn-shaped membrane roof have not been sufficiently reported yet.
The basic studies, which were about the theory and the analysis method, on the horn-
shaped membrane roof were reported by F. Otto, M. Saitoh et al and also shown the wind-
pressure coefficients of the horn-shaped membrane roof under regulated conditions in
several reports and books (Otto, 1969; Saitoh & Kuroki, 1989; Nerdinger, 2005). In the resent
years, studies on the numerical simulation against the horn-shaped membrane roof were
reported by J. Ma, C. Wang et al (Ma et al., 2007; Wang et al., 2007). Furthermore,
dissertation by U. Kaiser indicated wind effects on weak prestressed membrane structure
which is 30m horn shaped membrane by aeroelastic models (Kaiser, 2004).
There are many other references on this field. However, the basic date for the wind-force
coefficient of the stand-alone and the multi-bay horn-shaped membrane roof has not been
sufficiently reported yet.
1.2 The composition of this paper
This paper composes nine chapters and three main parts as shown in figure 4. This paper
describes three types of test. Before these tests, chapter 2 shows a form of the horn-shaped
membrane roof and example of a technique to find this shape. Chapter 3 shows definitions
of symbols and calculation formulas on this paper. Chapter 4 and 5 show wind tunnel tests
under the uniform flow; stand-alone model tests parameterized model scales and velocity in
chapter 4, and multi-bay models parameterized the number of the horn-unit in chapter 5.
These tests indicate mean wind pressures around the horn-shaped membrane structures
under the uniform flow. Chapter 6 shows wind tunnel tests of the stand-alone model under
the turbulent boundary layer flow. In this chapter indicate mean wind pressures and peak
wind pressures and compare these results with the results under the uniform flow.
(
a
)
Local Pressures Test
(
c
)
Aeroelastic Tests
(
b
)
Area and Overall Wind Loads Tests
(
b
)
Area and Overall Wind Loads Tests
Wind Tunnel Tests on the Horn-Shaped Membrane Roof
329
Fig. 4. The composition of this paper
2. Form of the horn-shaped membrane roof
The horn-shaped membrane roofs have several kind of planar shape, namely a circle, a
square and a hexagon based horn-shaped membrane roof. This paper describes about the
square based horn-shaped membrane roof. In general, the membrane structure needs to find
appropriate forms to resist external force. ‘European Design Guide for Tensile Surface’ by
TensiNet presents some methods of form-finding for the membrane structures (Forster &
Mollaert, 2004). This paper used nonlinear finite element method to find the appropriate
form on the square based horn-shaped membrane.
In this paper, the membrane material was defined as low stiffness material (see figure 5). On
the other hand, a strut was defined as high stiffness material. A strut was transferred point B
from point A in order to get the appropriate form using FEM analysis. A rise-span ratio H/L
Fig. 5. Form finding method on the horn-shaped membrane structures
Uniform flow
Turbulent boundar
y
la
y
er flow
Stand-alone model Parameter; model scale, velocity in the wind tunnel
Chapter 4
Multi-bay model Parameter; the number of the horn-unit Chapter 5
Stand-alone model Chapter 6
Wind Tunnels and Experimental Fluid Dynamics Research
330
was defined as the ratio of a span L to a height of the horn-shaped roof H, and an
appropriate form of H/L=0.2 was obtained by finite element method with geometrical
nonlinear in this paper. Additionally, the top of strut was L/10 and there wasn’t a hole on
the middle of the horn-shaped roof. The final shape get three-dimensional curved surface.
3. Definitions of symbols and calculation formula on this paper
The wind pressure coefficient was calculated based on The Building Standard Law of Japan
(The building Center of Japan, 2004), Recommendations for Load on Buildings 2004
(Architectural Institute of Japan, 2004) and ASCE Manuals (Cermak & Isyumov, 1998).
Definitions of the symbols in this paper are shown in figure 6. As for the signs of wind
pressure coefficient, the positive (+) means positive pressure against the roof and the
negative (-) means negative pressure against the roof.
Fig. 6. The definitions of symbols in this paper
The wind pressure coefficient is obtained from follows;
p
jpojpijCC C
(1)
ij
pij
z
PPs
C
q
,
oj
poj
z
PPs
C
q
(2)
2
1
2
zzqv
(3)
in which Cpj is the wind pressure coefficient at measurement pressure tap j, C
poj
is the
external wind pressure coefficient at measurement tap j, C
pij
is the internal wind pressure
coefficient at measurement tap j, P
ij
is the internal pressure at measurement tap j, P
o
is the
external pressure at measurement tap j, P
s
is the static, or the barometric, pressure at a
reference location,
z
q
is the mean value of dynamic pressure at the reference location z, ρ is
the density of the air, and
zv
is the mean value of wind velocity at the reference location z.
In this paper, the reference location z with the uniform flow means the position of the pitot
tube. On the other hand, the reference location z with the turbulent boundary layer flow was
obtained from the following equations;
Wind Tunnel Tests on the Horn-Shaped Membrane Roof
331
2
H
zh
(4)
in which h is the eave height of the roof, and H is the rise of the horn-shaped roof.
Particularly, the mean value of wind pressure coefficient C
p_mean
and the peak value of wind
pressure coefficient C
p_peak
are expressed respectively as follows;
___
p
mean po mean pi meanCC C
(5)
_,max _,max _,min
_ , min _ , min _ , max
p peak po peak pi peak
ppeak popeak pipeak
CCC
CCC
(6)
in which C
po_mean
and C
pi_mean
are the mean value of external and internal wind pressure
coefficient, C
po_peak
and C
pi_peak
are the tip value of external and internal wind pressure
coefficient.
Additionally, C
pi_mean
, C
po_mean
, C
po_peak
and C
pi_peak
are given by the following equations;
_
_
imean
pi peak
z
P
C
q
,
_
_
mean
po peak
z
Po
C
q
(7)
_
_
imean
pi mean
z
P
C
q
,
_
_
omean
po mean
z
P
C
q
(8)
in which P
i_mean
and P
o_mean
are the mean value of internal and external wind pressure on the
pressure measurement tap respectively, and P
i_peak
and P
o_peak
are the tip value of internal and
external wind pressure on the tap. In case of the enclosed type which is constructed with
side walls, P
i
is neglected on these calculations.
4. The wind tunnel test on the stand-alone model under the uniform flow
In this chapter, the authors focus on Reynolds number, i.e. the model scale and the wind
velocity, under the uniform flow on the stand-alone model. This study aims to clarify about
the relationship between Reynolds number and the wind pressure coefficients obtained
from wind tunnel tests.
Generally, the Reynolds number Re is shown by the following equation and it is closely
related to the aerodynamic characteristics (Cook, 1990).
e R
B
UL
(9)
in which U is characteristic wind velocity, L
B
is characteristic building dimension,
is
kinematic viscosity of the air; ν=0.145×10
-4
[m
2
/sec] at 15 degrees. Several studies have
reported about Reynolds number around a cylinder as shown in figure 7 and these studies
indicated influence of Reynolds number on the curved surface shape. The horn-shaped
membrane roof has three-dimensional curved surface. Therefore, the authors presume that
the aerodynamic characteristics around the horn-shaped membrane roof show some effect
depending on changes of Reynolds number. From the point of view, this chapter examine
the influence of Reynolds number on the horn-shaped membrane roofs.