Wind Tunnels and Experimental Fluid Dynamics Research Part 15 ppt
Bạn đang xem bản rút gọn của tài liệu. Xem và tải ngay bản đầy đủ của tài liệu tại đây (4.15 MB, 40 trang )
Wind Tunnels and Experimental Fluid Dynamics Research
548
For the present qualitative analysis two dimensional computations carried out over the
model symmetry plane are taken under consideration; in particular the conditions H
0
=35
MJ/kg, P
0
=2 bar are analyzed (this condition corresponding to the lower freestream
Knudsen number: 1.47*10
-3
) by comparing the results obtained with a classical Navier-
Stokes approach and DSMC method, in order to check possible local effects of rarefaction.
Note that for this high enthalpy case it has been decided to not perform the CFD slip
computation since more accurate DSMC calculations are not strongly CPU-time demanding
due to the reduced number of needed particles. Specifically, this test case is characterized by
the following flow properties M
∞
= 12.94, Re
∞
/m = 9.03 × 10
3
, T
∞
= 240 K and a model
attitude of 12 deg. A grid-independence study for CFD simulations
has been carried out as
well as a study of DSMC solution sensitivity to the number of particles (not shown).
A preliminary analysis has been carried out considering the wall at fixed temperature of 300
K, and the following Fig. 13 and Fig. 14 show the Mach number contours and the
streamlines for the two performed computations. Figures show the strong bow shock wave
ahead of the model, that is more inclined, as expected, in the case of DSMC simulation, the
strong expansion on the bottom part of the model, and finally the shock wave boundary
layer interaction around the corner and the subsequent recirculation bubble, that is in
incipient conditions in the case of rarefied flow simulation.
Fig. 13. CFD: Mach number contours and streamlines
Evaluation of Local Effects of Transitional
Knudsen Number on Shock Wave Boundary Layer Interactions
549
Fig. 14. DSMC: Mach number contours and streamlines
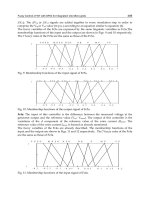
The Fig. 15 exhibits the slip velocity wall distribution predicted by DSMC calculation
showing a peak value of about 1,3% of freestream velocity in correspondence of the
beginning of the flat plate downstream of the model nose. It can be underlined that these
low values of slip velocity were expected since, differently from the validation test case (i.e.
the hollow cylinder flare), no sharp leading edge is present in this PWT model, therefore
continuum regime flow conditions are predicted around the nose. Looking also at Fig. 15 , it
can be observed that the same qualitative cuspid-like distribution has been predicted in
correspondence of the corner, where a separation (or incipient separation like in this case)
occurs.
Fig. 15. Slip velocity distribution
Wind Tunnels and Experimental Fluid Dynamics Research
550
By carefully examining Fig. 16 and Fig. 17, and remembering the analysis performed for the
validation test case, the same considerations apply to the present applicative case in high
enthalpy conditions. In particular, a reduction of separation extent is observed with DSMC
calculation (see Fig. 13 and Fig. 14), as well as a slight reduction of the mechanical load
acting on the flap (see Fig. 16).
Finally, also looking at Fig. 15, in correspondence of the section where the maximum of slip
velocity occurs, i.e. X=0.1 m, the local Knudsen number is:
2
1005.4
−
×≈=
δλ
δ
Kn
and this value justifies the occurrence of local effects of rarefaction on the prediction of
important aspects of shock wave boundary layer interaction as well as the extent of
separation region.
Fig. 16. Pressure coefficient distribution
Evaluation of Local Effects of Transitional
Knudsen Number on Shock Wave Boundary Layer Interactions
551
Fig. 17. Skin friction coefficient distribution
As a conclusion, it must be stressed the fact that local rarefaction effects must be taken into
account when designing plasma wind tunnel tests at limit conditions of the facility
envelope, in particular for very low pressures and high enthalpies as in the present case.
This is particularly true when plasma test requirements are represented by the reproduction
on the test model (or on parts of it) of given values of mechanical and thermal loads, as well
as of shock wave boundary layer interaction characteristics (i.e. separation length, peak of
pressure, peak of heat flux, etc.).
4. Conclusion
Local effects of rarefaction on Shock-Wave-Boundary-Layer-Interaction have been studied
by using both the continuum approach with the slip flow boundary conditions and the
kinetic one by means of a DSMC code.
The hollow cylinder flare test case for ONERA R5Ch wind tunnel conditions was
numerically rebuilt in order to validate the methodologies. The free stream Knudsen
number for the selected test case implies that much of the flow is in continuum conditions,
even though local effects of rarefaction have been checked. In particular, the comparison
with experimental data has shown that rarefactions effects are not negligible in prediction of
the separation length. The CFD code with slip flow boundary conditions has shown good
predicting capabilities of the size of the recirculation bubble, and the analysis of the density
profiles inside boundary layer has shown a good agreement between DSMC and CFD with
slip conditions in different sections along the body. Definitively, the present wind tunnel
test case, simulated with the three different methodologies (classics CFD, CFD with slip flow
boundary conditions and DSMC), has shown that local rarefaction effects are significant for
the prediction of important aspects of shock wave boundary layer interaction as the sizing
of recirculation bubble and it has been also shown that CFD with slip flow boundary
conditions is, in this case, a good compromise between computational cost and accuracy.
Wind Tunnels and Experimental Fluid Dynamics Research
552
The same considerations apply to a CIRA Plasma Wind Tunnel test case, where significant
rarefactions effects were found on the SWBLI phenomenon; therefore they must be taken
into account when designing plasma wind tunnel tests at limit conditions of the facility
envelope, in particular for very low pressures and high enthalpies as in the present case.
5. References
Bird, G. A., Molecular Gas Dynamics and the Direct Simulation of Gas Flows, Clarendon,
Oxford, 1994.
Bird, G. A., “The DS2V/3V Program Suite for DSMC Calculations” Rarefied Gas Dynamics,
24th International Symposium, Vol. 762 edited by M. Capitelli, American Inst. Of
Physics, NY, 2005, pp. 541-546, February, 1995.
Borrelli S., Pandolfi M., “An Upwind Formulation for the Numerical Prediction of Non
Equilibrium Hypersonic Flows”, 12th International Conference on Numerical Methods
in Fluid Dynamics, Oxford, United Kingdom, 1990.
Chanetz, B., Benay, R., Bousquet, J., M.,Bur, R., Pot, T., Grasso, F., Moss, J., Experimental and
Numerical Study of the Laminar Separation in Hypersonic Flow", Aerospace
Science and Technology, No. 3, pp. 205-218, 1998.
Di Clemente M., Marini M., Schettino A., “Shock Wave Boundary Layer Interaction in
EXPERT Flight Conditions and Scirocco PWT”, 13th AIAA/CIRA International
Space Planes and Hypersonics Systems and Technologies Conference, Capua, Italy,
2005.
Kogan N. M., Rarefied Gas Dynamics, Plenum, New York, 1969.
Markelov, G., N., Kudryavtsev A. N., Ivanov, M., S., “Continuum and Kinetic Simulation of
Laminar Separated Flow at Hypersonic Speeds”, The Journal of Spacecraft and
Rockets, Vol. 37 No. 4, July-August 2000.
Marini, M., “H09 Viscous Interaction at a Cylinder/Flare Junction”, Third FLOWNET
Workshop, , Marseille, 2002.
Millikan R.C., White D.R., “Systematic of Vibrational Relaxation”, The Journal of Chemical
Physics, Vol. 39 No.12, pp. 3209-3213, 1963.
Park C., “A Review of Reaction Rates in High Temperature Air”, AIAA paper 89-1740, June
1989.
Park C., Lee S.H., “Validation of Multi-Temperature Nozzle Flow Code NOZNT”, AIAA
Paper 93-2862, 1993.
Ranuzzi, G., Borreca, S., “CLAE Project. H3NS: Code Development Verification and
Validation”, CIRA-CF-06-1017, 2006.
Yun K.S., Mason E. A., “Collision Integrals for the Transport Properties of Dissociating Air
at High Temperatures”, The Physics of Fluids, Vol. 39 No.12, pp. 3209-3213, 1962.
27
Investigation on Oblique Shock Wave Control
by Surface Arc Discharge in a Mach 2.2
Supersonic Wind Tunnel
Yinghong Li
1
and Jian Wang
2
1
Engineering College, Air Force Engineering University
2
Army Aviation Institute
China
1. Introduction
A shock wave is a typical aerodynamic phenomenon in a supersonic flow, and if controlled
effectively, a series of potential applications can be achieved in aerospace fields, such as
reducing wave drag and sonic boom of the supersonic vehicle, optimizing shock waves of
the supersonic inlet in off-design operation states, decreasing pressure loss induced by
shock waves in the supersonic wind tunnel or aeroengine internal duct, controlling shock
waves of the wave rider, changing shock wave symmetry to achieve flight control and
inducing shock waves in the aeroengine nozzle to achieve thrust vector control.
Shock wave control can be achieved by many mechanical or gas dynamic methods, such as
the ramp angle control in supersonic inlet and the holl/cavum control in self-adapted
transonic wing. Because the structural configurations of these methods are somewhat
complex and the flow control response is also slow, plasma flow control based on gas
discharge physics and electromagnetohydrodynamics (EMHD) theory has been developed
recently in the shock wave control field. Using this method, substantial thermal energy can
be added in the shock wave adjacent areas, then the angle and intensity of shock wave
change subsequently.
Meyer et al investigated whether shock wave control by plasma aerodynamic actuation is a
thermal mechanism or an ionization mechanism, and the experimental results demonstrated
that the thermal mechanism dominates the shock wave control process [1, 2]. Miles et al
investigated the shock wave control by laser energy addition experimentally and
numerically, and the research results showed that when the oblique shock wave passed by
the thermal spot induced by laser ionization, the shock wave shape distorted and the shock
wave intensity reduced [3]. Macheret et al proposed a new method of virtual cowl induced
by plasma flow control which can optimize the shock waves of supersonic inlet when its
operation Mach number is lower than the design Mach number [4]. Meanwhile, they used
the combination method of e-beam ionization and magnetohydrodynamic (MHD) flow
control to optimize the shock waves of supersonic inlet when operating in off-design states,
and the research results demonstrated that the shock waves can reintersect in the cowl
adjacent area in different off-design operation states with the MHD acceleration method and
the MHD power generation method, respectively [5]. Leonov et al used a quasi-dc
Wind Tunnels and Experimental Fluid Dynamics Research
554
filamentary electrical discharge, and the experimental results showed that shock wave
induction, shock wave angle transformation and shock wave intensity reduction, etc could
all be achieved by plasma flow control [6-8]. Other than oblique shock wave control, the
bow shock wave control by plasma aerodynamic actuation was also studied by
Kolesnichenko et al [9], Ganiev et al [10], and Shang et al [11] for the purpose of reducing
peak thermal load and wave drag.
This paper used the arc discharge plasma aerodynamic actuation, and the wedge oblique
shock wave control by this plasma aerodynamic actuation method was investigated in a
small-scale short-duration supersonic wind tunnel. The change laws of shock wave control
by plasma aerodynamic actuation were obtained in the experiments. Moreover, a magnetic
field was applied to enhance the plasma actuation effects on a shock wave. Finally, a
qualitative physical model was proposed to explain the mechanism of shock wave control
by plasma aerodynamic actuation in a cold supersonic flow.
2. Experimental setup
The design Mach number of the small-scale short-duration supersonic wind tunnel is 2.2
and its steady operation time is about 30-60 s. The test section is rectangular with a width of
80mm and a height of 30 mm. The gas static pressure and static temperature in the test
section are 0.5 atm and 152 K, respectively. The groove in the test section lower wall is
designed for the plasma aerodynamic actuator fabrication.
The power supply consists of a high-voltage pulse circuit and a high-voltage dc circuit. The
output voltage of the pulse circuit can reach 90 kV, which is used for electrical breakdown of
the gas. The dc circuit is the 3 kV-4 kW power source, which is used to ignite the arc
discharge.
The plasma aerodynamic actuator consists of graphite electrodes and boron-nitride (BN)
ceramic dielectric material. Three pairs of graphite electrodes are designed with the cathode-
anode interval of 5mm and the individual electrode is designed as a cylindrical structure
which is embedded in the BN ceramic. The upper gas flow surface of electrodes and ceramic
must be a plate to ensure no unintentional shock wave generation in the test section. The
controlled oblique shock wave is generated by a wedge with an angle of 20
◦
. As shown in
figure 1, the plasma aerodynamic actuator is embedded in poly-methyl-methacrylate
(PMMA) and then inserted into the groove of the test section lower wall. There are 10
pressure dots with a diameter of 0.5mm along the flow direction for the gas pressure
measurement.
As shown in figure 2, the static magnetic field is generated by a rubidium-iron-boron
magnet which consists of four pieces. Two pieces construct the N pole and the other two
pieces construct the S pole. The magnetic field strength in the zone of interaction is about 0.4
T. Based on the MHD theory, the main purpose of adding magnetic field is applying a
Lorentz body force to the charged particles in the arc plasma, which can influence the
plasma actuation effects on shock wave.
The test systems consist of a gas pressure measurement system, a schlieren photography
system and an arc discharge voltage-current measurement system. The gas pressure
measurement system is used to measure and compute the oblique shock wave intensity with
the data-acquisition frequency of 1 kHz and the acquisition time of 3-10 s. The schlieren
photography system is used to photograph the configuration of the oblique shock wave. It
uses the Optronis® high-speed CCD camera with the maximum framing rate of 200 000 Hz.
Investigation on Oblique Shock Wave Control
by Surface Arc Discharge in a Mach 2.2 Supersonic Wind Tunnel
555
For the purpose of acquiring the pulsed arc discharge process in the flow, the framing rate
in this paper is selected as 8000 Hz with an exposure time of 0.0001 s and a resolution of 512
× 218 pixels. The arc discharge voltage and current are monitored by a voltage probe
(P6015A, Tektronix Inc.) and a current probe with a signal amplifier (TCP312+TCPA300,
Tektronix Inc.), respectively. The two signals are measured by a four-channel digital
oscilloscope (TDS4104, Tektronix Inc.).
Fig. 1. Sketch of arc discharge plasma aerodynamic actuator.
Fig. 2. Sketch of magnet fabrication on the wind tunnel test section.
Wind Tunnels and Experimental Fluid Dynamics Research
556
3. Test results and discussion
3.1 Electrical characteristics
Under the test conditions of Mach 2.2, the arc discharge is a pulsed periodical process with a
period of 2-3 ms, and the discharge time only occupies 1/20 approximately in a period. The
discharge voltage-current curves including several discharge periods are shown in figure
4(a). It can be seen that the discharge intensity is unsteady with some periods strong but
some other periods weak. The discharge voltage-current-power curves in a single period are
shown in figure 4(b). The discharge process in a single period can be divided into three
steps. The first step is the pulse breakdown process. When the gas breakdown takes place,
the discharge voltage and the current can reach as high as 13 kV and 18 A, respectively, and
the discharge power reaches hundreds of kilowatts. However, this step lasts for an
extremely short time of about 1μs, which indicates that it is a typical strong pulse
breakdown process. The second step is the dc hold-up process. After the pulse breakdown
process, arc discharge starts immediately. The discharge voltage decreases from 3 kV to 300-
500V and the discharge current increases to 3-3.5A correspondingly. The discharge power is
maintained at 1-1.5 kW. This step lasts for a long time of about 80μs. The third step is the
discharge attenuation process. Because the supersonic flow blows the plasma channel of the
arc discharge downstream strongly, the Joule heating energy provided by the power supply
dissipates in the surrounding gas flow intensively. As a result, the discharge voltage
increases gradually. Both the discharge current and power decrease. When the power
supply cannot provide the discharge voltage, the discharge extinguishes. After some time,
the next period of discharge will start again. This attenuation step lasts for about 20μs. The
time-averaged discharge power of the above three steps within 100μs is about 1.3kW.
From figure 3 we can see that the arc discharge plasma is strongly bounded near the wall
surface and blown downstream by the supersonic flow. The arc discharge is transformed
from a large-volume discharge under static atmospheric conditions to a large-surface
discharge under supersonic flow conditions.
Fig. 3. Arc discharge picture in the supersonic flow.
3.2 The wedge oblique shock wave control by typical plasma aerodynamic actuation
Three pairs of electrodes discharge simultaneously in the experiments. Under the conditions
of an input voltage of 3 kV and an upwind-direction magnetic control, the wedge oblique
shock wave control by this plasma aerodynamic actuation was investigated in detail.
Because of the fabrication error and actuator surface roughness, there are some
unintentional shock waves in the test section before the wedge. The wedge in the supersonic
flow generates a strong oblique shock wave, which can be seen from figure 5(a). Because the
boundary layer in the test section lower wall before the wedge is somewhat thick with a
thickness of about 3-4 mm, the start segment of the oblique shock wave is composed of
many weak compression waves, which intersect in the main flow to form the strong oblique
shock wave.
Investigation on Oblique Shock Wave Control
by Surface Arc Discharge in a Mach 2.2 Supersonic Wind Tunnel
557
(a)
(b)
Fig. 4. Electrical characteristics of arc discharge in supersonic flow. (a) Discharge voltage-
current curves including several discharge periods. (b) Discharge voltage-current-power
curves in a single period.
Wind Tunnels and Experimental Fluid Dynamics Research
558
When applying plasma aerodynamic actuation, the schlieren test results showed that the
structure of the wedge oblique shock wave changed distinctly. Within the discharge time,
the intensity of the shock wave change was from weak to strong and then to weak again,
which indicated that the shock wave control was a dynamic process, which was consistent
with the unsteady characteristics of the three discharge steps discussed in section 3.1.
However, within the extinction time, the shock wave recovered to the undisturbed state as
before, which demonstrated that the arc discharge control on shock wave was a pulsed
periodical process. The mostly strong shock wave control effect within the discharge time is
shown in figure 5(b). We can see that the start segment of the wedge oblique shock wave is
transformed from a narrow strong wave to a series of wide weak waves, and the start point
of the shock wave shifts 4mm upstream, its angle decreases from 35
◦
to 32
◦
absolutely and
8.6% relatively, and its intensity weakens as well. This phenomenon is somewhat similar to
the supersonic inlet design method of transforming a strong shock wave to a series of weak
shock waves for the purpose of reducing flow pressure loss.
(a)
(b)
Fig. 5. Influence of plasma aerodynamic actuation on the structure of wedge oblique shock
wave. (a) Schlieren picture without plasma aerodynamic actuation. (b) Schlieren picture
with plasma aerodynamic actuation.
Confined by the upper limit 1 kHz of data-acquisition frequency, the pressure measurement
system cannot precisely distinguish the pulsed process of shock wave control, so the
pressure data in this paper are just the macro time-averaged description of plasma flow
control on shock wave. The intensity of wedge oblique shock wave is defined as the
pressure ratio of shock wave downstream flow (pressure dot 10) on shock wave upstream
flow (pressure dot 7). Because of flow turbulence and unsteadiness in the wind tunnel test
section, the pressure data have a little fluctuation with the intensity less than 1%. As seen
from figure 6, when applying plasma aerodynamic actuation, the shock wave intensity
greatly decreases with the time-averaged intensity from 2.40 to 2.19 absolutely and 8.8%
relatively. Hence, we can conclude that the plasma aerodynamic actuation controls the
wedge oblique shock wave effectively.
Investigation on Oblique Shock Wave Control
by Surface Arc Discharge in a Mach 2.2 Supersonic Wind Tunnel
559
Fig. 6. Influence of plasma aerodynamic actuation on the intensity of wedge oblique shock
wave.
3.3 Magnetic control on shock wave
The basic principle of magnetic control is applying the Lorentz body force to the arc
discharge current. The mathematical expression is
FjB=´
, where
j
refers to the
discharge current density vector,
B
refers to the magnetic field intensity vector and
F
refers
to the Lorentz body force vector. By changing the direction of the discharge current, both the
upwind-direction and the downwind-direction Lorentz force can be achieved, as shown in
figure 7.
Fig. 7. Basic principle of magnetic control on gas discharge.
From the shock wave intensity measurements in figure 8, we can see that magnetic control
greatly intensifies the shock wave control effects. When applying plasma aerodynamic
actuation without magnetic control, the intensity of the wedge oblique shock wave
Wind Tunnels and Experimental Fluid Dynamics Research
560
decreases only by 1.5%, but when applying the upwind-direction magnetic control, it
decreases by 8.8%. Moreover, when applying the downwind-direction magnetic control, it
decreases by 11.6%. The experimental results showed that the maximum shock wave
intensity decrease is 20.2%. Hence we can conclude that magnetic control greatly intensifies
the shock wave control effects and the downwind-direction magnetic control is better than
the upwind-direction magnetic control.
Fig. 8. Influence of magnetic control on shock wave intensity.
Then the mechanism of enhancement of plasma actuation effects on the shock wave by
magnetic field is discussed. The discharge characteristics without or with magnetic field
under the conditions of no flow are measured and the results demonstrate that they are very
different. The voltage, current and power measurements without magnetic field are shown
in figure 9. The gas breakdown voltage between the graphite electrodes is about 2 kV and
when the input voltage provided by the power supply exceeds this value, arc discharge
happens. At the instant of gas breakdown, voltage decreases from 2 kV to about 300 V and
current increases to about 1 A. The discharge power is calculated as 300 W. Then the voltage
holds at 300 V, but the current decreases gradually. After about 0.5 s, the current sustains at
about 440 mA and the discharge power holds at about 130 W. Until now, the steady state of
arc discharge is achieved. The above discharge characteristics demonstrate that the arc
discharge without magnetic field can be separated into two phases, which correspond to the
strong pulsed breakdown process and the steady discharge process, respectively.
When the magnetic field is applied, the discharge characteristics are shown in figure 10 and
we can see that the arc discharge transitions from the continuous mode to the pulsed
periodical mode. The discharge period is very unstable from tens of milliseconds to several
seconds. In a typical discharge period, the discharge time only occupies several
milliseconds, which demonstrates that the discharge extinguishes within most time of a
period. At the instant of pulsed discharge, voltage decreases to about 500 V and current
increases to about 1.2 A. The discharge power is calculated to be about 600 W. These
discharge characteristics with magnetic field are very similar to the conditions in the flow
Investigation on Oblique Shock Wave Control
by Surface Arc Discharge in a Mach 2.2 Supersonic Wind Tunnel
561
and show great differences under the conditions without the magnetic field. Two
remarkable differences are concluded.
Fig. 9. Electrical characteristics of arc discharge under the conditions of no magnetic field
and no flow.
Fig. 10. Electrical characteristics of arc discharge under the conditions of magnetic field and
no flow.
Wind Tunnels and Experimental Fluid Dynamics Research
562
Firstly, the arc discharge transitions from the continuous mode to the pulsed periodical
mode. When the arc discharge reaches the steady state, the Joule heating energy provided
by the power supply must balance the dissipated energy, such as convection loss,
conduction loss and radiation loss. Under the conditions of no magnetic field and no flow,
convection loss mainly refers to the energy loss of natural convection process that the hot arc
plasma transfers thermal energy to the cold surrounding air. Conduction loss mainly refers
that the hot arc plasma transfers the thermal energy to the cold electrodes and the ceramic
surfaces. As the Joule heating energy can balance the dissipated energy, the arc discharge
can reach the steady state. However, under the condition of magnetic field, the plasma
channel of the arc discharge is greatly deflected by the Lorentz body force, which is shown
in figure 11. Besides the natural convection process, the arc plasma also endures intensive
constrained convection process, which dissipates the Joule heating energy substantially.
Therefore, the Joule heating energy provided by the power supply cannot balance the
dissipated energy, so the discharge extinguishes quickly.
Fig. 11. Sketch of plasma channel deflection by Lorentz force under the condition of
magnetic field.
Secondly, the discharge power increases. At the instant of gas breakdown, the power
deposition by the arc discharge increases from 300 to 600 W under the condition of magnetic
field. So we can deduce the preliminary fact that the power deposition in the flow also
increases after the application of the magnetic field. Therefore, the shock wave control effect
is intensified by the magnetic field as measured in the experiments. So we suppose that the
observed enhancement of discharge effect in the magnetic field is due to the rise in power
release but not the proposed EMHD interaction! This important conclusion is very different
from the authors’ initial intentions to use a magnetic field in the experiments.
3.4 Discussion on shock wave control mechanisms
A qualitative physical model is proposed in this section to explain the mechanism of shock
wave control by surface arc discharge. The sketch of physical problem for modeling is
shown in figure 12, and the phenomenon can be simplified as a 2-D problem. In order to
generate an oblique shock wave, a wedge is placed at the lower wall surface in the cold
supersonic flow duct. The arc discharge electrodes are mounted in front of the wedge. The
surface arc discharge plasma is generated and blown downstream by the cold supersonic
flow, which can be seen from figure 3. From the discharge picture in experiments, the arc
Investigation on Oblique Shock Wave Control
by Surface Arc Discharge in a Mach 2.2 Supersonic Wind Tunnel
563
discharge plasma covers large areas in front of the wedge and we suppose that the height of
arc discharge plasma is less than the height of wedge. Flow viscosity is disregarded, so the
boundary layer effects can be neglected. Because we just deduce the qualitative change laws
of oblique shock wave control by arc discharge, the parameters quantities are not set
concretely in this physical model.
Fig. 12. Sketch of physical problem for modelling.
In the 1-D, steady and ideal gas flow, heating can accelerate the gas and decrease the gas
pressure. As a result, the mass flux density of gas flow decreases, which is the mechanism of
thermal choking phenomenon in the flow system. The influence of thermal choking effect on
gas flow can be described as parameter
heat
unheat
0
0
1
1
p
m
m
s
cT
e ==
+
(1)
where e is the ratio of mass flux density,
heat
m
and
unheat
m
are the mass flux density with
and without gas heating respectively,
0
s is the amount of gas heating with unit mass,
p
c and
0
T are the specific heat coefficient with constant pressure and gas static temperature
without heating respectively, and
0p
cT is the gas static enthalpy without heating. Defining
nondimensional parameter
0
0
e
p
s
H
cT
=
and it’s the energy ratio of gas heating on initial
static enthalpy with unit mass. Because
0
0s > , 0
e
H > and 1e < , which indicates that gas
heating decreases the mass flux density of 1-D flow. When
e
H ¥,0e , which indicates
that if the amount of gas heating is extremely large, the mass flux density will decrease to
zero and the gas flow will be totally choked. As arc discharge plasma can increase the gas
temperature of cold supersonic flow from the level below 200 K to kilos of K rapidly, the
amount of gas heating is very large, and the thermal choking phenomenon must be very
remarkable in the flow duct.
Then we broaden the above 1-D analysis to the 2-D problem of shock wave control by arc
discharge plasma. If the height of arc discharge plasma along the flow direction doesn’t
change, the flow area can be separated into two distinct regions with region
a that
corresponds to the cold supersonic flow area between arc discharge plasma and upper duct
wall, and region
b that corresponds to the high-temperature area of arc discharge plasma.
The sketch is shown in figure 13. As the gas pressure of cold supersonic flow is about the
high level of 10
4
Pa, arc discharge plasma often reaches the Local Thermal Equilibrium (LTE)
Wind Tunnels and Experimental Fluid Dynamics Research
564
state approximately which indicates that the electron temperature equals to the ion and
neutral gas temperature. Therefore, we can use one temperature to describe the thermal
characteristics of arc discharge plasma.
Fig. 13. Sketch of bow shock wave induction by arc discharge plasma.
When gas flows through the thermal area of arc discharge plasma, the mass flux will
decrease because of thermal choking effect, then part of gas will pass to the cold gas flow
area and the streamline will bend upward at section
1. When the uniform flow reaches
section 1, we suppose that the mass flux of region
a and b will rearrange, so the 2-D problem
is reduced to 1-D again after the flow passing through section 1. The gas pressure at the
cross section of region
a and b reaches equilibrium. Based on the above hypothesis, the mass
flux density of region
a and b can be described as
(
)
022
a,unheat
a
PPP
m
RT
-
=
(2)
(
)
022
b,heat
b
PPP
m
RT
-
=
(3)
where
a
m
and
b
m
are the mass flux density of region a and b respectively,
0
P and
2
P are the
gas pressure of section
0 and 2 respectively,
a,unheat
T and
b,heat
T are the gas temperature of
region
a and b respectively and R is the universal gas constant. From equation (2) and (3),
the mass flux density ratio of two regions is
b,heat
a,unheat
a
b
T
m
mT
=
(4)
So the mass flux ratio of two regions is
b,heat
a,unheat
aa
b
b
T
MA
AT
M
=
(5)
Investigation on Oblique Shock Wave Control
by Surface Arc Discharge in a Mach 2.2 Supersonic Wind Tunnel
565
where
a
A and
b
A are the cross section area of region a and b respectively,
a
M
and
b
M
are the
mass flux of region
a and b respectively.
Supposing the height of region
a and b are 30mm and 2mm, respectively, so 15
ab
AA= . In
our experiments, the Mach number and gas stagnation temperature of the cold supersonic
flow are 2.2 and 300 K, respectively. From the gas stagnation-static temperature equation
2
1
1
2
TT M
g
*
æö
+
÷
ç
=+
÷
ç
÷
÷
ç
èø
(6)
The gas static temperature is about 152 K, so
a,unheat
152TK= . From the measurement in
reference [8], the temperature of arc discharge plasma in the above cold supersonic flow can be
estimated as 3000 K, so
b,heat
3000TK= . Then 67
ab
MM»
is acquired, which indicates that
when cold supersonic gas meets the arc discharge plasma area, only little gas passes through
the thermal area and most of the gas passes to the cold area. Therefore, we can conclude that
the arc discharge plasma area can be regarded as a solid obstacle approximately and the gas
flow cannot pass through it. Because the height of arc discharge plasma area is set constant in
figure 6, the plasma area can be regarded as a rectangular blunt obstacle, which will induce a
bow shock wave in the supersonic flow. However, in real conditions, the arc discharge plasma
is streamlined by flow and the height of arc discharge plasma area increases from zero to
larger value gradually, so the plasma area seems as a solid wedge, which can be called ‘plasma
wedge’. As a result, the plasma wedge will induce an oblique shock wave instead of a bow
shock wave, which is shown in figure 14.
Fig. 14. Sketch of oblique shock wave control by arc discharge plasma.
Based on the above judgment of new shock wave induction by arc discharge plasma in cold
supersonic flow, the wedge oblique shock wave control by arc discharge plasma is
discussed as follows, which can be seen from figure 14. The wedge angle is designated as
q .
Without arc discharge, the angle and intensity of wedge oblique shock wave are designated
as
b and
s
p , respectively. After arc discharge, the plasma wedge will induce a new oblique
shock wave in front of it and the old wedge oblique shock wave will disappear. Because the
height of plasma wedge is less than the height of solid wedge, there is a secondary shock
wave formed at the intersection point of plasma wedge and solid wedge. The plasma wedge
angle is designated as
*
q . The angle and intensity of the induced oblique shock wave are
designated as
b
*
and
s
p
*
, respectively. As
*
<
and on the condition of constant Mach
number, the relationships of
bb
*
< and
ss
pp
*
< can be concluded based on the oblique
shock wave relations of
(~~)Ma qb.
Wind Tunnels and Experimental Fluid Dynamics Research
566
Therefore, based on the above thermal choking model, we can conclude that the change
laws of oblique shock wave control by arc discharge plasma are (1) the start point of shock
wave will shift upstream, (2) the shock wave angle will decrease and (3) the shock wave
intensity will weaken. The deduced theoretical result is consistent with the experimental
result which demonstrates that the thermal choking model is rational to explain the problem
of shock wave control by surface arc discharge.
4. Numerical simulation
Based on thermal mechanism, the arc discharge plasma is simplified as a thermal source term
and added to the Navier-Stokes equations. The nonlinear partial difference equations are
solved in ANSYS FLUENT
®
software. The flow modelling software is a widely used powerful
computational fluid dynamics program based on finite volume method. It contains the broad
physical modelling capabilities to model flow, turbulence, heat transfer, and reactions for
industrial applications. It has excellent ability to simulate compressible flows. A user-defined
function written in the C programming language is developed to define the thermal source
term. The thermal source term uses the form of temperature distribution. The geometric shape
of thermal source areas is supposed as rectangular and the gas temperature is uniform (3000
K). 2D coupled implicit difference method and k-epsilon two-equation turbulence models are
used. The inlet flow conditions are consistent with the test conditions. As shown in figure 15,
the width and height of rectangular thermal source area are 2 and 1 mm, respectively.
According to the test condition of three pairs of electrodes discharging simultaneously, there
are three pairs of thermal source areas with interval 2 mm.
Fig. 15. Sketch of the numerical model.
As shown in figure 16(a), an oblique shock wave generates in front of the wedge, which
matches the experimental results. After thermal energy addition to the supersonic flow field,
we can see that the rectangular thermal source areas are blown downstream by the
supersonic flow, which is shown in figure 16(b). It is consistent with the actual arc discharge
picture in experiments. The geometric shape of the thermal area looks like a new wedge in
front of the solid wedge and it is similar to the plasma wedge in the theoretical analysis. The
influence of thermal energy addition on the wedge oblique shock wave is shown in figure
16(c). We can see that the start point of shock wave shifts upstream to the new wedge apex
point and the shock wave angle decreases. The comparison curves of shock wave intensity
are shown in figure 16(d), and we can see that the shock wave intensity decreases. These
changes in shock wave are consistent with the experimental and theoretical results, which
Investigation on Oblique Shock Wave Control
by Surface Arc Discharge in a Mach 2.2 Supersonic Wind Tunnel
567
demonstrate that the numerical method is reasonable. Also the thermal mechanism and
thermal choking model are both validated.
Fig. 16. Simulation results of oblique shock wave control by thermal energy addition. (a)
Static pressure (Pa) contours without thermal energy addition. (b) Static temperature (K)
contours with thermal energy addition. (c) Static pressure (Pa) contours with thermal energy
addition. (d) Comparison curves of gas pressures along the centreline flow direction.
5. Conclusion
The wind tunnel experimental results demonstrate that the arc discharge plasma
aerodynamic actuation controls the wedge oblique shock wave effectively, which shifts the
start point of shock wave upstream, decreases the shock wave angle and weakens the shock
wave intensity. Moreover, when applying magnetic control, the above shock wave control
effect is greatly intensified. Under the typical plasma aerodynamic actuation conditions, the
start point of the shock wave shifts 4 mm upstream, the shock wave angle decreases by 8.6%
and its intensity weakens by 8.8%. Then the thermal choking model is proposed to explain
Wind Tunnels and Experimental Fluid Dynamics Research
568
the thermal mechanism of shock wave control by plasma aerodynamic actuation. As the arc
discharge adds substantial thermal energy to the cold supersonic flow field, the plasma area
can be seen as a solid obstacle, which is called the
‘plasma wedge’. Then the shock wave
angle and the intensity change. The change laws of shock wave deduced by the thermal
choking model are consistent with the experimental results, which demonstrate that the
thermal choking model can effectively forecast the plasma actuation effects on a shock wave
in a cold supersonic flow. Based on thermal mechanism, the arc discharge plasma was
simplified as a thermal source term that added to the Navier-Stokes equations. The
simulation results of the change in oblique shock wave were consistent with the test results,
so the thermal mechanism indeed dominates the oblique shock wave control process.
6. References
Meyer, R., Palm, P. & Plonjes, E. (2001). The Effect of a Nonequilibrium RF Discharge
Plasma on a Conical Shock Wave in a M=2.5 Flow,
32nd AIAA Plasmadynamics and
Lasers Conference
, pp. 2-10, Anaheim, CA, USA, June 11-14, 2001
Merriman, S., Plonjes, E. & Palm, P. (2001). Shock Wave Control by Nonequilibrium Plasmas
in Cold Supersonic Gas Flows,
AIAA Journal, Vol.39, No.8, (August 2001), pp. 1547-
1552, ISSN 0001-1452
Miles, R., Macheret, S. & Martinelli, L. (2001). Plasma Control of Shock Waves in
Aerodynamics and Sonic Boom Mitigation,
32nd AIAA Plasmadynamics and Lasers
Conference
, pp. 1-8, Anaheim, CA, USA, June 11-14, 2001
Macheret, S., Shneider, M. & Miles, R. (2003). Scramjet Inlet Control by Off-body Energy
Addition: a Virtual Cowl,
41st AIAA Aerospace Sciences Meeting and Exhibit, pp. 1-15,
Reno, Nevada, USA, January 6-9, 2003
Shneider, M., Macheret, S. & Miles, R. (2003). Comparative Analysis of MHD and Plasma
Methods of Scramjet Inlet Control,
41st AIAA Aerospace Sciences Meeting and Exhibit,
pp. 1-12, Reno, Nevada, USA, January 6-9, 2003
Leonov, S., Yarantsev, D. & Soloviev, V. (2006). High-speed Inlet Customization by Surface
Electric Discharge,
44th AIAA Aerospace Sciences Meeting and Exhibit, pp. 1-9, Reno,
Nevada, USA, January 9-12, 2006
Leonov, S., Bityurin, V. & Yarantsev, D. (2005). High-speed Flow Control Due to Interaction
with Electrical Discharges,
AIAA/CIRA 13th International Space Planes and
Hypersonics Systems Technologies Conference
, pp. 1-12, Capua, Italy, May 16-20, 2005
Leonov, S., Yarantsev, D. & Isaenkov, Y. (2005). Properties of Filamentary Electrical
Discharge in High-enthalpy Flow,
43rd AIAA Aerospace Sciences Meeting and Exhibit,
pp. 1-14, Reno, Nevada, USA, January 10-13, 2005
Kolesnichenko, Y., Brovkin, V. & Leonov, S. (2001). Investigation of AD-body Interaction
with Microwave Discharge Region in Supersonic Flows,
39th AIAA Aerospace
Sciences Meeting and Exhibit
, pp. 1-12, Reno, Nevada, USA, January 8-11, 2001
Bletzinger, P., Ganguly, B. & VanWie, D. (2005). Plasmas in High Speed Aerodynamics,
Journal of Physics D: Applied Physics, Vol.38, No.4, (April 2005), pp. R33–57, ISSN
0022-3727
Ganiev, Y., Gordeev, V. & Krasilnikov, A. (2000). Aerodynamic Drag Reduction by Plasma
and Hot-gas Injection,
Journal of Thermophysics and Heat Transfer, Vol.14, No.1,
(January-March 2000), pp. 10-17, ISSN 0887-8722
Shang, J. (2002). Plasma Injection for Hypersonic Blunt-body Drag Reduction,
AIAA Journal,
Vol.40, No.6, (June 2002), pp. 1178-1186, ISSN 0001-1452
28
Investigations of Supersonic Flow
around a Long Axisymmetric Body
M.R. Heidari, M. Farahani, M.R. Soltani and M. Taeibi-Rahni
Garmsar Branch of Islamic Azad University,
Sharif University of Technology
Iran
1. Introduction
One of the most important parameters affecting missiles’ length and diameter is the
required space for their apparatus, systems, etc. Increasing this space causes an increase in
both the body length and the missile’s fineness ratio, L/d (Fleeman, 2001). For such bodies,
the problems of flow separation and boundary layer growth at various flight conditions are
very important. Of course, the boundary layer growth and its separation, affect the
aerodynamic characteristics, particularly the drag force and the stability criterion. Both of
these have important roles in the missile performance and its mission implementations.
Also, the performance of various control surfaces (especially those located close to the end
of the body) varies with flow separation (Cebeci, 1986).
For some rockets and missiles, the after body cross-section changes longitudinally
(particularly in space vehicles). Furthermore, due to the lack of sufficient space for arranging
the systems (e.g., actuator of controlled fins, avionics, etc.), it is necessary to increase the
body cross section near those systems. The lack of space may also appear when controlled
fins are installed on the motor surface. Hence, in many occasions the body cross-section
needs to be increased (Chin, 1965; Soltani et al., 2002).
However, the computation of the flow parameters and their variations for non-zero angles
of attack, when bodies are tapered, is not an easy task, e.g., it takes a considerable amount of
memory and CPU time to compute the flow over such bodies. In addition, as the angle of
attack increases, the flow over a portion of the body may separate, making the flow more
complicated. Moreover, experimental data for flow properties along tapered bodies to
validate CFD codes are rare (Soltani et al., 2002; Perkins & Jorgensen, 1975).
The computational simulation of flow over complex geometries usually requires structured
multi-block grids. On the other hand, the geometric complexity requires more blocks and
also more grid points. Even though, the computer programming (using multi-block grid for
such flows) is very troublesome, it is computationally very efficient and quick. On the other
hand, suitable grid generation plays the first and the most important role, when using multi-
block grid.
Grid generation needs to be consistent with flow solution. In some methods, the
discritization error increases due to the inaccurate adoption of the grid boundaries with the
real flow boundaries, which could be due to the non-orthogonality of the grid lines,
especially near the walls.
Wind Tunnels and Experimental Fluid Dynamics Research
570
There have been many research performed on the areas of generation and use of multi-block
grids, grid generation techniques, data management methods in different blocks, production
of grid generation softwares which optimally require less trained users, and quicker grid
generation, especially for complex geometries (Amdahl, 1988; Sorenson & McCann, 1990).
The different steps to compute the flow using multi-block grid are: 1. geometric recognition
and setting a suitable block structure, 2. grid generation inside each block and finding the
nodes on the block boundaries, and 3. solving the flow inside each block and then in the
whole domain. Also, multi-block grid generation has four steps, namely, dividing the flow
domain into different blocks, determining the exact geometric characteristics of each block,
grid generation in each block, and optimization of the overall grid (Boerstoel et al., 1989).
The situation and the location of the boundaries between the blocks are very important and
thus an inefficient structuring can lead to the divergence of the overall solution. The flow
physics, such as shock waves and separated flow regions, determine the required number of
blocks and how they are distributed.
In the present work, a series of wind tunnel tests on a long axisymmetric body were
performed to investigate the pressure distribution, the boundary layer profile, and other
flow characteristics at various angles of attack and at a constant supersonic Mach number of
1.6. Because of low maneuverability of high fineness ratio missiles, the range of angles of
attack for the present study was chosen to be moderate. Then, the effects of the cross
sectional area variations on the surface static pressure distribution and on the boundary
layer profiles were thoroughly investigated. This was performed by installing two belts
(strips) having different cut-off angles on the cylindrical portion of the model. One of these
belts was installed at the beginning of the after body part (x/d=7.5), while the other was
located near the end (x/d=13.25). By changing the belt leading edge angles, different bodies
were generated and thus the effects of varying the body cross-section were studied.
In the numerical part of this work, a stationary turbulent supersonic axisymmetric flow over
the same body at zero angle of attack (in the absence of body forces and heat sources) was
investigated using the computer code developed in this work (MBTLNS). Adiabatic wall
with negligible variations of the viscous fluxes in the streamwise direction was assumed.
Also, the flow domain was blocked in streamwise direction and patched method was used
in the block boundaries. In each block, the thin layer Navier-Stokes (TLNS) equations were
solved, using the implicit delta form finite difference method with Beam and Warming
central differencing scheme (Beam, & Warming, 1978). For turbulence modeling, the
algebraic two-layer Baldwin-Lomax model was used and the shock waves were captured
using shock capturing technique. In each iteration of the overall solution, the flow domain is
swept from the first block at the nose to the last block at the end of the body. The
computational results for zero angle of attack, Mach number of 1.6, and Reynolds number of
8×10⁶ for flow over an axisymmetric ogive-cylinder with two sets of strips with angles 5
and
15 degrees were compared with the related experimental results obtain in this work. The
most important ability of the present software is that, it can solve the flow around complex
geometries, using a personal computer with relatively small memory.
2. Experimental equipments and tests
All tests were conducted in the trisonic wind tunnel of QRC. The equipments used for this
investigation include: Schlieren visualization system, A/D board, traversing mechanism,
rake, vacuum pump, manometer, computer, data acquisition software, pressure transducer,
and multiplexer board.
Investigations of Supersonic Flow around a Long Axisymmetric Body
571
The QRC wind tunnel is an open-circuit blow down tunnel and operates continuously
between Mach numbers 0.4-2.2, via engine RPM and nozzle adjustments. It has a test section
of 60×60×120 cm3 and is equipped with various internal strain gauge balances for force and
moment measurements, pressure transducers, Schlieren visualization system, etc. (Masdari,
2003).
The model used in this study had a fineness ratio of 2.5 and a circular-arc, ogival nose
tangent to a cylindrical after body with L/d=15 (Fig. 1.a). It was equipped with 36 static
pressure ports located both longitudinally and circumferentially. To study the effects of
cross section changes, two belts with various leading edge angles were installed on the
model (Fig. 1.b). Here, the first model is used when talking about the main or simple model
(the one without belts), the second model for the one with (5, 5) degrees belts, and the third
model for the one with (15, 12) degrees belts.
a) Simple model
b) Model with belts
Fig. 1. Schematic of different models used.
The traversing mechanism, which was designed and built particularly for this study, is
capable of moving the rake perpendicular to the body axis with small steps of about 0.003
mm in z direction. This system was installed on the α-mechanism base such that, the tubes
(pitot total pressure) of the rake were always parallel to the model. Note, the entire
traversing mechanism was fully controlled by a computer.
Various tests were conducted to study the flow characteristics along the model. The free
stream Mach number was 1.6, while the angle of attack was varied between -2 and 6
degrees. At each angle of attack and for all models, the rake at several longitudinal stations
for at least 11 locations in z direction obtained the total pressure data. An accurate linear
potentiometer was used to determine the distances between the body surface and the rake.
Note, all experimental data shown here are ensemble averaged of several hundred data
taken several times to ensure repeatability.
3. Governing equations and computational methodology
In the present study, a turbulent supersonic flow over a long axisymmetric body at zero
angle of attack was computationally simulated. The Reynolds averaged TLNS equations
were solved using Beam and Warming central differencing and Baldwin-Lomax turbulence
model. This model is frequently used, because of its simplicity and its reliability. Even