Wind Farm Impact in Power System and Alternatives to Improve the Integration Part 8 doc
Bạn đang xem bản rút gọn của tài liệu. Xem và tải ngay bản đầy đủ của tài liệu tại đây (580.41 KB, 20 trang )
Wind Energy Assessment of the Sidi Daoud Wind Farm - Tunisia
129
5. Characterization of installed aerogenerators and evaluation of the energetic
efficiencies
5.1 Aerodynamic efficiency of the aerogenerators
In this part, we are interested in the four types of aerogenerators MADE AE-32, AE-46, AE-
52 and AE-61 with horizontal axis, installed in the Sidi Daoud wind farm.
According to the technical document of the manufacturer, the characteristics of the
machines studied are given by Table 9.
Aerogenera-
tors MADE
Regula-
tion type
Genera-
tor speed
Nominal
power
(kW)
Multiplic-
ation
coefficient
Rotor
diameter
(m)
Speeds (m/s)
Cut in nominal Cut out
V
d
V
n
V
c
AE-32
AE-46
AE-52
AE-61
Stall
Stall
Pitch
Stall
1 speed
2 speeds
variable
2 speeds
330
660
800
1320
44.4
59.5
58.3
80.8
32
46
52
61
4
3
3
3
13
15
12
17
25
"
"
"
Table 9. Technical data of the aerogenerators.
Fig. 12. illustrates the variation of the electric power of each machine in function of the wind
speed. The machines start from the same speed of 3 m/s (except the AE-32 which begins to
4 m/s) and must stop at 25 m/s. Beyond nominal speed, the power provided by
synchronous machine AE-52 remains constant; on the other hand, that provided by
asynchronous machines AE-32, AE-46 and AE-61 decreases slightly with the wind speed.
0 5 10 15 20 25
0
200
400
600
800
1000
1200
1400
Wind speed (m/s)
Power (kW)
AE-32
AE-61
AE-52
AE-46
Constructor
Model
Fig. 12. Power curves of the aerogenerators.
Wind Farm – Technical Regulations, Potential Estimation and Siting Assessment
130
The aerodynamic efficiency of the wind rotor defined by its power coefficient C
p
is written:
3
()
1
2
s
p
m
g
PV
C
SV
ρμμ
=
⋅⋅⋅
(10)
where
m
μ
and
g
μ
respectively represent the gearbox efficiency and the
g
enerator efficienc
y
.
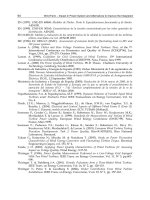
This dimensionless parameter, which expresses the aerodynamic effectiveness of rotor of the
various aerogenerators [20-21], is represented by Fig. 13. For such an aerogenerator, this
coefficient is a function the wind speed wind, the chock angle and the rotational speed of
rotor. The maximum theoretical value of
C
p
given by Betz limit is 59.3%.
For the four machines, this coefficient reaches its maximum at the optimal wind speed
V
opt
=
9 m/s (Table 11). This maximum varies from 45.51% (AE-61) to 49.07% (AE-32). For low
speeds, the curve of the power coefficient progresses quickly towards the optimum
operating point. Beyond this point, we observe degradation slower of
C
p
towards a limiting
value of the order 4% which corresponds at the cut out speed of the machine.
0 5 10 15 20 25 30
0
0.05
0.1
0.15
0.2
0.25
0.3
0.35
0.4
0.45
0.5
C
p
Aerogenerator Made AE-32
Wind speed (m/s)
Constructor
Model
0 5 10 15 20 25 30
0
0.05
0.1
0.15
0.2
0.25
0.3
0.35
0.4
0.45
0.5
Aerogenerator Made AE-46
Wind speed (m/s)
C
p
Constructor
Model
0 5 10 15 20 25 30
0
0.05
0.1
0.15
0.2
0.25
0.3
0.35
0.4
0.45
0.5
Aerogenerator Made AE-52
Wind speed (m/s)
C
p
Constructor
Model
0 5 10 15 20 25 30
0
0.05
0.1
0.15
0.2
0.25
0.3
0.35
0.4
0.45
0.5
Aerogenerator Made AE-61
Wind speed (m/s)
C
p
Constructor
Model
Fig. 13. Curves of aerodynamic efficiency
C
p
=f(V) of the various aerogenerators.
Wind Energy Assessment of the Sidi Daoud Wind Farm - Tunisia
131
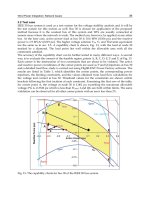
In addition to the estimate of produced annual energy, it is interesting to know the annual
time of the wind turbine production. Fig. 14 illustrates the site frequency-speed histograms
and the machines reduced power curve. We observe that during 22 % (respectively 10%, 8%
and 9.5%) of the annual time, the wind speed is insufficient to operate the wind turbine AE-
32 (respectively AE-46, AE-52 and AE-61) and it blows sufficiently to obtain the full
efficiency during 6 % (respectively 2%, 9% and 1.5%) of the annual time. The remaining time
of value 72 % (respectively 88%, 83% and 89%), the efficiency varies with the wind speed.
Also, we have plotted the power-duration curve of each aerogenerator indicating the time
percentage when the wind turbine provides a power higher than a given threshold (Fig. 15).
Thus, the machine AE-32 (respectively AE-46, AE-52 and AE-61) will produce its maximum
power only for 526 h/year (respectively 175 h/year, 788 h/year and 131 h/year) of the
annual time; which accounts for approximately 7.7% (respectively 2.2%, 9.8% and 1.7%) of
its operating annual time. We notice that the four aerogenerators most of the time function
below their nominal capacities.
0 5 10 15 20 25 30
0
20
40
60
80
100
120
140
Wind speed (m/s)
Frequency (‰) ; P
s
/P
n
(%)
2004-2007
Mast 1
Mast 2
Power curve of Made AE-32
0 5 10 15 20 25 30
0
20
40
60
80
100
120
140
Wind speed (m/s)
Frequency (‰) ; P
s
/P
n
(%)
2004 - 2007
Mast 3
Mast 4
Power curve of Made AE-46
0 5 10 15 20 25 30
0
20
40
60
80
100
120
140
Wind s
p
eed
(
m/s
)
Frequency (‰) ; P
s
/P
n
(%)
2004 - 2007
Mast 3
Power curve of Made AE-52
0 5 10 15 20 25 30
0
20
40
60
80
100
120
140
Wind speed (m/s)
Frequency (‰) ; P
s
/P
n
(%)
2004 - 2007
Mast 4
Power curve of Made AE-61
Fig. 14. Annual frequency–speed histograms of the site.
Wind Farm – Technical Regulations, Potential Estimation and Siting Assessment
132
0 10 20 30 40 50 60 70 80 90 100
0
50
100
150
200
250
300
350
Duration (%)
Power (kW)
Made AE-32
Mast 1
Mast 2
0 10 20 30 40 50 60 70 80 90 100
0
100
200
300
400
500
600
700
Duration (%)
Power (kW)
Made AE-46
Mast 3
Mast 4
0 10 20 30 40 50 60 70 80 90 100
0
100
200
300
400
500
600
700
800
900
Duration (%)
Power (kW)
Made AE-52
Mast 3
0 10 20 30 40 50 60 70 80 90 100
0
200
400
600
800
1000
1200
1400
Duration (%)
Power (kW)
Made AE-61
Mast 4
Fig. 15. Annual power–duration curves of the aerogenerators.
5.2 Annual energy produced by the various aerogenerators
The available energy really usable
E
u
that can be received by the aerogenerator is
proportional to the cube of the wind speed and the wind distribution in the site [28-35].
Knowing the wind mode, this usable energy is given by the following expression:
33
1
8,76 ()()( ) ()
2
nc
uiini
id in
ESV
f
VV
f
V
ρ
==
=⋅ ⋅⋅⋅ +
(11)
where
2
SR
π
=
is the rotor swept surface of radius R.
In the same way, recoverable energy
E
r
on the aerogenerator outlet
(rotor+gearbox+generator) is given by the machine power curve and the wind statistical
distribution.
8,76 ()()
c
riSi
id
EfVPV
=
=⋅
(12)
Wind Energy Assessment of the Sidi Daoud Wind Farm - Tunisia
133
where
()
si
PV is the electric power on the aerogenerator outlet.
We notice that the calculation of recoverable energy by the Weibull and Rayleigh analytical
methods necessitates of modeling the power curve P
s
(V) by an analytical expression. The
Boltzman theoretical model allows reproducing this curve correctly. It is written as follows:
12
2
0
()
()
1exp
s
AA
PV A
VV
ω
−
=+
−
+
(13)
The parameters V
0
, A
1
, A
2
and
ω
of each aerogenerator are identified by the software
"Origin 5.0" and their optimal numerical values are determined by minimizing the quality
criterion
χ
2
(Table 10).
Aerogenerators AE-32 AE-46 AE-52 AE-61
Parameters
3 ≤ V ≤ 13 13 ≤ V ≤ 25 3 ≤ V ≤ 15 15 ≤ V ≤ 25 3 ≤ V ≤ 12 12 ≤ V ≤ 25 3 ≤ V ≤ 17 17 ≤ V ≤ 25
A
1
381.89 241.133 -13.38 672.75 -27.93
P
s
(V) = 800
kW
-32.405 1334.8
A
2
-22.464 338.249 688.25 563.45 1045.5 1354.9 1175.2
V
0
9.3116 19.4191 9.2317 18.227 9.6543 9.6006 19.86
ω
-1.852 -2.136 1.6999 1.484 1.861 1.8287 1.221
Table 10. Boltzman theoretical model parameters of the power curve of each aerogenerator.
Fig. 16 represents the variation of annual energies (available, usable and recoverable) in
function of the wind speed for the various masts and aerogenerators. We see that the
maxima of the three energies curves pass approximately by the same wind speed, which
shows the good adaptation of the aerogenerators to the Sidi Daoud site.
We notice that the annual wind power produced by each wind turbine represents
approximately one-third of the total available energy in the site.
5.3 Energy efficiencies of the aerogenerators
Using the computed energies, the wind turbine mean efficiency relating to the available
energy is estimated by the expression [28-35]:
3
() ()
()
1
()
2
ri Si
di
di
i
EV PV
V
EV
SV
μ
ρ
==
⋅⋅⋅
(14)
The wind turbine mean efficiency relating to usable energy can also be defined by the
following expression:
3
3
()
1
()
()
2
()
()
()
1
()
2
Si
din
i
ri
ui
Si
ui
nic
n
PV
p
our V V V
SV
EV
V
PV
EV
p
our V V V
SV
ρ
μ
ρ
≤≤
⋅⋅⋅
==
≤≤
⋅⋅⋅
(15)
These two ratios of energy represent the product of the mechanical efficiency (gearbox and
generator) and the rotor aerodynamic efficiency.
Wind Farm – Technical Regulations, Potential Estimation and Siting Assessment
134
0 5 10 15 20 25 30
0
50
100
150
200
250
300
Energy (kwh/m²/year)
Wind speed (m/s)
Mast 1 - 30 m
Availabe energy
Usable energy
Recoverable energy
of AE-32
0 5 10 15 20 25 30
0
50
100
150
200
250
300
Wind speed (m/s)
Energy (kwh/m²/year)
Mast 2 - 30m
Available energy
Usable energy
Recoverable energy
of AE-32
0 5 10 15 20 25
0
50
100
150
200
250
300
Wind speed (m/s)
Energy (kwh/m²/year)
Mast 3 - 45 m
Available energy
Usable energy
Recoverable energy
of AE-46
0 5 10 15 20 25 30
0
50
100
150
200
250
300
Wind speed (m/s)
Energy (kwh/m²/year)
Mast 4 - 45 m
Available energy
Usable energy
Recoverable energy
of AE-46
0 5 10 15 20 25 30
0
50
100
150
200
250
300
Wind speed (m/s)
Energy (kwh/m²/year)
Mast 3 - 50 m
Available energy
Usable energy
Recoverable energy
of AE-52
0 5 10 15 20 25 30
0
50
100
150
200
250
300
350
Wind speed (m/s)
Energy (kwh/m²/year)
Mast 4 - 60 m
Available energy
Usable energy
Recoverable energy
of AE-61
Fig. 16. Energies curves calculated by the meteorological method.
Fig. 17 represents the variation of these mean efficiencies as a function of the classified speed
for the various aerogenerators. It is noted that the mean efficiencies pass by the same
maximum
μ
max
for a wind speed of approximately 9 m/s. This maximum varies from 41.92
% (AE-61) to 44.8 % (AE-32) (Table 11). It is significant to notice that this mean efficiency
remains superior to 0.4 in the wind speed zone included between 6.8 m/s and 11.2 m/s for
the AE-32, between 7.7 m/s and 10.25 m/s for the AE-46, between 6.5 m/s and 11.25 m/s
for the AE-52 and between 7.8 m/s and 10.45 m/s for the AE-61.
Wind Energy Assessment of the Sidi Daoud Wind Farm - Tunisia
135
0 5 10 15 20 25 30
0
0.05
0.1
0.15
0.2
0.25
0.3
0.35
0.4
0.45
2004-2007
Wind s
p
eed
(
m/s
)
µ
d
Made AE-32
Made AE-46
Made AE-52
Made AE-61
0 5 10 15 20 25 30
0
0.05
0.1
0.15
0.2
0.25
0.3
0.35
0.4
0.45
Wind speed (m/s)
µ
u
2004-2007
Made AE-32
Made AE-46
Made AE-52
Made AE-61
a)
μ
d
= f (V) b)
μ
u
= f (V)
Fig. 17. Mean efficiencies curves of the aerogenerators calculated by the meteorological method.
Aerogenerators
C
pmax
(%)
μ
max
(%)
V
opt
(m/s)
AE-32 49.07 44.83 9
AE-46 45.77 42.05 9
AE-52 47.44 42.92 9
AE-61 45.51 41.92 9
Table 11. Optimum operating point of wind turbines.
In addition, the annual mean efficiency of each wind turbine is defined by:
r
d
E
E
μ
=
(16)
The numerical results obtained by the three methods are comparable and indicate that the
annual mean efficiency remains higher than 30% for the various machines (Table 12).
Consequently, the energy produced by each machine is important and reaches the 1/3 of the
site available energy.
Aerogenerator AE-32 AE-46 AE-52 AE-61
Mast 1 2 3 4 3 4
Meteorological 29.54 31.74 31.52 30.61 32.18 30.31
Weibull 30.53 32.10 32.45 31.73 34.63 31.09
Rayleigh 32.96 33.75 32.75 32.32 34.53 31.64
Table 12. Annual mean efficiency
μ
(in %) of each aerogenerator.
Wind Farm – Technical Regulations, Potential Estimation and Siting Assessment
136
In practice, a maximum energy efficiency of wind turbine is ensured by an optimal
aerodynamic efficiency of rotor. To optimize this efficiency, the control of the aerogenerator
must be made so that the rotational rotor speed adapts to the site wind speed.
5.4 Use factor and availability rate
However, the wind turbine cannot function with full power all the time (maintenance,
breakdowns, wind availability, etc.). To quantify the recovered power by each
aerogenerator, it is interesting to calculate its annual use factor
UF which is defined by the
ratio of the produced electric power on the installed power [28-35]:
()()
(%) 100
c
iSi
id
n
f
VPV
UF
P
=
=⋅
(17)
According to the relation (16), we note that this factor UF depends only on the wind
frequency (at the nacelle height) for such an aerogenerator. Table 13 shows that the
machine AE-52, which has the lowest nominal speed (
V
n
=12m/s), presents the best use
factor.
Aerogenerator AE-32 AE-46 AE-52 AE-61
Mast 1 2 3 4 3 4
Meteorological 26.65 25.18 24.23 24.90 27.58 26.04
Weibull 28.00 25.92 25.01 26.22 30.08 26.79
Rayleigh 26.90 24.99 23.70 25.19 29.04 26.11
Table 13. Annual use factor UF (in %) of each aerogenerator.
Based on the results of the annual energy recovered by each machine, we note that the use
factor of the whole wind farm (70 aerogenerators of an installed power generation capacity
of 53.6 MW) is about 25.87%; what shows that the maximum annual energy production of
the wind power station is approximately 121.5 GWh/an.
To estimate the operation duration of an aerogenerator, we define the availability rate
AF
which depends on the machine characteristics and the wind potential in the site. For such a
wind turbine having a cut in speed
V
d
and a cut out speed V
c
, the availability rate AF is the
probability P calculated by the following equation [28-35]:
()
[
]
(%) 100 100 ( ) ( )
dc dc
A
FPVVVFVFV=⋅ ≤≤=⋅ −
(18)
In general, this factor rises when the difference (V
c
-V
d
) and the mean wind speed increase.
The obtained values for the various aerogenerators are excellent (Table 14) and show that
the production time exceeds 90% of annual time for machines AE-46, AE-52 and AE-61 and
about 80% for the AE-32.
Wind Energy Assessment of the Sidi Daoud Wind Farm - Tunisia
137
Aerogenerator AE-32 AE-46 AE-52 AE-61
Mast 1 2 3 4 3 4
Meteorological 79.01 78.24 90.18 90.76 91.86 90.86
Weibull 73.41 82.94 92.66 92.81 93.44 93.47
Rayleigh 74.87 84.06 92.42 92.66 92.77 93.48
Table 14. Annual availability rate AF (in %) of each aerogenerator.
Consequently, to completely describe the energetic profitability of an aerogenerator, it is
necessary to take account simultaneously of these four factors: the aerodynamic efficiency,
the mean efficiency, the use factor and the availability rate.
6. Conclusion
This study has presented the development of the wind power use in Tunisia for the electricity
production. The main contribution of this chapter is the energy performance evaluation of the
first wind farm installed in Sidi Daoud - Tuinisia, particularly the effectiveness of various
aerogenerators (MADE AE-32, AE-45, AE-52 and AE-61) implanted on the site, by the
meteorological experimental method and the Weibull and Rayleigh analytical methods.
The data treated in this study are the measurements recorded in four places (masts 1, 2, 3
and 4) of the site at altitudes which correspond to the heights of the aerogenerators hubs (30,
45, 50 and 60 m above ground level) (Tab. 2). These measurements are spread out over a
four-year period (2004-2007).
The principal results of this study are:
Concerning the wind resource of the site,
- The Sidi Daoud site has an important and stable wind potential. Indeed, the power
density calculated at the various heights (30, 45, 50 and 60 m) varies from 180 to 230
W/m² according to the measurement mast place. The mean speed also varies from 6.3
to 6.8 m/s. The dominant directions of the wind are the west and south-east sectors.
- The identified parameters of the two distribution functions (
A, k and V
m
) show that the
two models are quasi-equivalent. Indeed, the values of the statistical analysis
parameters (R², RMSE and
χ
2
) indicate a better adjustment of the meteorological data by
the two models.
- The modeling of the wind vertical profile by the logarithmic and power laws is applied to
the mast 4 place. The extrapolation of the height 30 to 100 m enables us to obtain a gain on
the mean speed of 30% and a gain on the power density of 116%.
Concerning the aerogenerators performance,
- The maximum power coefficient
C
pmax
varies from 45.51% (AE-61) to 49.07% (AE-32) for
the same optimal wind speed
V
opt
= 9 m/s.
- The annual mean efficiency remains superior to 30% for the various machines. Indeed,
recoverable energy is important and it is about the 1/3 of the available energy in the site.
- The use factor
UF varies from 23 to 28% according to the type and place of the
aerogenerator. It is about 25.87% on average for the whole wind farm.
- The availability rate
AF is excellent and exceeds 90% of annual time for aerogenerators
AE-46, AE-52 and AE-61 and about 80% for the AE-32.
- The aerogenerator AE-52 presents the energetic performances higher than those of the
other machines.
Wind Farm – Technical Regulations, Potential Estimation and Siting Assessment
138
7. Nomenclature
V
Wind speed (m/s)
F(V) Cumulated frequency
f(V) Occurrence frequency
n
Number of wind-speed classes
V
m
Mean speed (m/s)
V
f
Most frequent speed (m/s)
V
e
Most energetic speed (m/s)
P
d
Power density at Betz limit (W/m²)
E
d
Available energy at Betz limit (kWh/m²/year)
E
u
Usable energy (kWh/m²/year)
E
r
Recoverable energy (kWh/m²/year)
P
s
P
n
Electric power on the aerogenerator outlet (W)
Nominal power of the aerogenerator (W)
P
d(M)
Mean power density calculated from the meteorological method (W/m²)
P
d(W,R)
Mean power density calculated from the Weibull and Rayleigh functions (W/m²)
μ
d
Mean efficiency relating to the available energy
μ
u
Mean efficiency relating to the usable energy
μ
Mean efficiency
μ
m
Gearbox efficiency (96%)
μ
g
u*
Z
0
α
H
Generator efficiency (96.2%)
Friction speed (m/s)
Ground roughness (m)
Shear coefficient
Measurement height (m)
C
p
UF
Power coefficient
Use factor
AF
Availability rate
A
Paramètre d’échelle de Weibull (m/s)
k
K
Weibull scale factor
Von-Karman constant (
K=0.4)
S
Rotor area (m²)
ρ
Air density (1.225 kg/m
3
)
σ
(M,W,R)
Standard deviation calculated from the meteorological, Weibull and Rayleigh
methods (m/s)
R
2
Determination coefficient
χ
2
Chi-square coefficient
RMSE
Root mean square error
y
i
ith measured value
y
ic
ith calculated value
y
m
Mean value
Γ
Gamma function
M
Meteorological method
W
Weibull method
R
Rayleigh method
Wind Energy Assessment of the Sidi Daoud Wind Farm - Tunisia
139
8. References
[1] Agence Nationale des Energies Renouvelables (ANER). Etude Stratégique pour le
développement des Energies Renouvelables en Tunisie. Rapport final, Alcor –
Axenne, juillet 2003.
/>ouvelables/1_-_Bilan_des_realisations.pdf
[2] Ben Jannet Allal H. Energie et Ecodéveloppement en Tunisie. Report of Helio
International,
/
[3] Société Tunisienne de l’Electricité et du Gaz (STEG). Projet Eolien de Sidi Daoud : Etude
d’impact sur l’environnement de la 3ème tranche de la centrale éolienne.
Gouvernerat de Nabeul, 31 Novembre 2009.
[4] Société Tunisienne de l’Electricité et du Gaz (STEG). Réalisation d’une ligne électrique
aérienne 90 KV/Sidi Daoud/Menzel Temime, ETUDE D’IMPACT SUR
L’ENVIRONNEMENT. Gouvernerat de Nabeul, 31 Juillet 2009.
[5] T. P. Chang, Estimation of wind energy potential using different probability density
functions. Applied Energy 88 (2011) 1848–1856.
[6] V. Lo Brano, A. Orioli, G. Ciulla, S. Culotta, Quality of wind speed fitting distributions
for the urban area of Palermo, Italy. Renewable Energy 36 (2011) 1026-1039.
[7] B. Safari, Modeling wind speed and wind power distributions in Rwanda. Renewable
and Sustainable Energy Reviews 15 (2011) 925–935.
[8] J. Zhou, E. Erdem, G. Li, J. Shi. Comprehensive evaluation of wind speed distribution
models: A case study for North Dakota sites. Energy Conversion and Management
51 (2010) 1449–1458.
[9] J.A. Carta, P. Ramirez, S. Velaiquez, A review of wind speed probability distributions
used in wind energy analysis Case studies in the Canary Islands. Renewable and
Sustainable Energy Reviews 13 (2009) 933–955.
[10] Y.Q. Xiao, Q.S. Lia, Z.N. Li, Y.W. Chow, G.Q. Li, Probability distributions of extreme
wind speed and its occurrence interval. Engineering Structures 28 (2006) 1173–1181.
[11] M. Li, X. Li, On the probabilistic distribution of wind speeds: theoretical development
and comparison with data. Int. J. Exergy, Vol. 1, No. 2, 2004.
[12] Celik AN. A statistical analysis of wind power density based on the Weibull and
Rayleigh models at the southern region of Turkey. Renewable Energy 29 (2003)
593–604.
[13] S. Akpinar, E. K. Akpinar, Estimation of wind energy potential using finite
mixture distribution models. Energy Conversion and Management 50 (2009) 877–
884.
[14] Elamouri M, Ben Amar F. Wind energy potential in Tunisia. Renewable Energy 33
(2008) 758–768.
[15] Belu Radian, Koracin Darko. Wind characteristics and wind energy potential in western
Nevada. Renewable Energy 34 (2009) 2246–2251.
[16] Zhou W, Yang H, Fang Z. Wind power potential and characteristic analysis of the Pearl
river delta region China. Renewable Energy 31 (2006) 739–753.
[17] Jewer P, Iqbal MT, Khan MJ. Wind energy resource map of Labrador. Renewable
Energy 30 (2005) 989–1004.
Wind Farm – Technical Regulations, Potential Estimation and Siting Assessment
140
[18] M. Li, X. Li, Investigation of wind characteristics and assessment of wind energy
potential for Waterloo region, Canada, Energy Conversion and Management 46
(2005) 3014–3033.
[19] Akpinar EK, Akpinar S. Determination of the wind energy potential for Maden-Elazig,
Turkey. Energy Conversion Management 45 (2004) 2901–2914.
[20] J.Coriton : Energie éolienne et conversion en chaleur. Etude bibliographique. Centre
Scientifique & Technique du Batiment (CSTB), Division climatologie, EN-CLI
82.9.R 1982.
[21] Duchene-Marullaz PH, Sacre CH. Guide d’implantation des petites éoliennes. Centre
Scientifique & Technique du Batiment (CSTB), Division climatologie, EN-CLI 84.4.
L 1984.
[22] Elamouri M, Ben Amar F, Trabelsi A. Vertical characterization of the wind mode and its
effect on the wind farm profitability of Sidi Daoud – Tunisia. Energy Conversion
and Management 52 (2011) 1539–1549.
[23] Giannini L, Argentini S, Mastrantonio G, Rossini G. Estimation of flux parameters from
sodar wind profiles. Atmospheric environment 31 (1997) 1307-1313.
[24] Rehman S, Al-Abbadi NM. Wind shear coefficients and their effect on energy
production. Energy Conversion and Management 46 (2005) 2578–2591.
[25] Perez IA, Garcia MA, Sanchez ML, de Torre B. Analysis of height variations of sodar-
derived wind speeds in Northern Spain. J Wind Eng Ind Aerodynamics 92 (2004)
875–894.
[26] Farrugia RN. The wind shear exponent in a Mediterranean island climate. Renewable
Energy 28 (2003) 647–653.
[27] Hussain M. Dependence of power law index on surface wind speed. Energy Conversion
and Management 43 (2002) 467–472.
[28] F. Ben Amar, M.Elamouri, R. Dhifaoui : Energy assessment of the first wind farm
section of Sidi Daoud, Tunisia. Renewable Energy 33 (2008) 2311-2321.
[29] Chang TJ, Wu YT, Hsu HY, Chu CR, Liao CM. Assessment of wind characteristics and
wind turbine characteristics in Taiwan. Renewable Energy 28 (2003) 851–871.
[30] Acker TL, Williams SK, Duque EPN, Brummels G, Buechler J. Wind resource
assessment in the state of Arizona: inventory capacity factor and cost. Renewable
Energy 32 (2007) 1453–1466.
[31] Abderrazzaq MH. Energy production assessment of small wind farms. Renewable
Energy 29 (2004) 2261–2272.
[32] E. Kavak Akpinar, S. Akpinar : An assessment on seasonal analysis of wind energy
characteristics and wind turbine characteristics. Energy Conversion and
Management 46 (2005) 1848–1867.
[33] Johnson GL. Wind energy systems. Electronic Edition. December 10, 2001. Manhattan,
KS.
[34] Henderson-Sellers B. Plume rise modelling: the effects of including a wind shear and a
variable surface roughness. Ecological Modelling 37 (1987) 269–286.
[35] Cliff WC. The effect of generalized wind characteristics on annual power estimates from
wind turbine generators. Report PNL-2436, 1977. US Department of Energy.
6
Wind Farms and Their Impact
on the Environment
Vladimír Lapčík
Institute of Environmental Engineering, Faculty of Mining and Geology
VSB – Technical University of Ostrava
Czech Republic
1. Introduction
This chapter summarizes author´s experience with environmental impact assessment in
branch of wind farms. The introductory part of chapter describes history and development
of wind power utilization world-wide and in the Czech Republic. Next part of chapter deals
with technology of wind turbines and their development. The final part of chapter deals
with experience with environmental impacts of wind farms and implementation of the
environmental impact assessment process (pursuant to the Act No. 100/2001 Coll. on
environmental impact assessment, as amended) in the field of wind power in the Czech
Republic.
2. History and development of wind power utilization
2.1 Significance of wind energy as a renewable source
A direct impetus for the development of wind energetics in Europe was the energy crisis in
1973 caused by an embargo enforced by OPEC on the oil export into developed countries.
Pressured by a sharp increase in the world-wide prices of oil, countries with own limited
classical energy sources began to search for a possible utilization of renewable energy
sources, including wind, in a wider scale. Denmark was the pioneer in the development of
wind energetics in Europe as they started to construct the first wind farms at the end of the
1980s (Štekl et al., 1993).
Wind energetics uses inexhaustible kinetic energy of the wind, totally for free, and thus it is
not subject to inflation. In this manner, it reduces the dependence on the import of raw
materials for power generation, namely from regions characteristic for their political
instability. The principle of inexhaustibility of the wind gains on importance when compared
with the brown coal reserves in the Czech Republic (CR). Adhering to the territorial
environmental limits set by 1991 government decree, between 2040 and 2050 the extraction of
brown coal shall drop below the level of the coal fired power plant needs (Štekl, 2008).
Wind energetics is most environmentally friendly, which is currently extraordinarily
important in the climate protection by means of reducing the production of greenhouse
gases, particularly carbon dioxide (Cetkovský et al., 2010).
Another argument in favour of wind farms is the fact that the energy return on energy
invested is much faster in wind farms than in case of nuclear or coal fired power plants. The
Wind Farm – Technical Regulations, Potential Estimation and Siting Assessment
142
time when a WF generates the same amount energy as expended to construct it ranges from
6 to 12 months at the WF lifespan of 20 years (Mathew, 2006).
Building a WF strains the site in a minimum manner and, roughly, it is a question of one
month. Dismantling of the structure takes 2-3 days and the structure hardly leaves any
traces in the ground. Wind farms are excellent examples of multifunctional utilization of
areas, which means that they permit utilization of agricultural land almost in the original
extent both for plant growing as well as for pasturage.
Thanks to reducing specific costs of a generated kWh from wind it may be expected that in
the next few years the price of electric power generated from wind and brown coal shall
level off (Mathew, 2006).
2.2 Utilization of wind power within the Czech Republic in the past
The first mention of a windmill in Europe comes from 833. Historical sources relate the
construction of the first windmill within the territory of the Czech Republic to the year of
1277, namely in the garden of the Strahov Monastery in Prague. The oldest reference from
Moravia and Silesia comes from the Opava region and dates back to 1340. Before the 17
th
century the mentions of windmills are sporadic. In the 18
th
century the development of wind
millery was stimulated by a court decree on the establishment of windmills of 1784, which
pursued the objective for each community to have a windmill. As a result, there were thirty
windmills registered in Moravia and Silesia. The boom of wind millery in Bohemia is
connected with the first half or the first two thirds of the 19
th
century (Pokorný, 1973). In
total, 198 localities with windmills were documented in Bohemia then. In Moravia and
Silesia the boom occurred later, namely in the second half or last third of the 19
th
century
and beginning of the 20
th
century. Within Moravia and Silesia there is a documented
existence of 681 windmills (Burian, 1965). In total, within the territory of the CR there was a
proven existence of 879 windmills (Cetkovský et al., 2010).
2.3 Development of wind energetics world-wide and in the Czech Republic
Along with cumulative problems in connection with fossil fuel utilization and
environmental protection, wind energetics is getting into the forefront of interest and a
formerly marginal and low prospective branch is gradually becoming one of the major
trends of the world-wide power engineering.
There are registered attempts of wind exploitation for power generation from the very
beginning of electroenergetics as such. However, a more systematic development in the
sphere of wind energy may be dated approximately into the second half of the 1970s. Oil
shocks at that time brought attention to limited classical sources of energy and led to a
search for alternatives, wind energy being one of those. As in the nature of new
technologies, the beginnings were not easy and for a long time wind energy appeared as
interesting but expensive, and not a very utilizable option in a wider scale.
Nevertheless, development continued especially after a strong impulse from California
which introduced a temporary generous support for wind energy in the 1980s. From today’s
point of view of miniature wind farms this era is responsible for the famous arrays in the
Californian passes of Tehachapi or Altamont. The technology was in its infancy then and not
all the attempts brought success. However, the “Californian boom” contributed to testing
various technological concepts and an elimination of diverse development dead ends.
The following years were characteristic for a slow but more organized development under a
systematic support, particularly from the part of Denmark and, to a smaller extent, some
Wind Farms and Their Impact on the Environment
143
other European countries (particularly Denmark much benefited from the support and, as a
result, it has currently become a technological leader in the field and wind energetics
represents a considerable contribution within the national economy). The basic
technological principle of wind farms does not change much nowadays, but it is their
reliability, efficiency and last but not least their size that grow gradually. This jointly
contributes to lower costs per unit of energy produced and permits a meaningful
construction of wind farms also outside prominent localities on the sea coast (Cetkovský et
al., 2010).
A country which also takes advantage of the opportunity apart from Denmark is Germany.
In connection with introducing favourable and transparent conditions for wind energy
purchase and granting permissions for wind farm constructions there was an
unprecedented development in the construction of wind farms, which started
approximately in the mid 1990s and peaked in the early 21
st
century. At that time wind
energetics turned out to be a considerably inexpensive method how to generate clean energy
from home sources and not a mere inconvenient “alternative” technology.
Fig. 1. Participation of the individual countries on the total wind farm output (left) and on
the increase in the installed power capacity (right) in 2008 (according to GWEC - Global
Wind Energy Council data)
Globally, the present times may be seen as a vast boom in the construction of wind farms.
This trend is given by having perfected the technology compared to the past (lower break-
down rate and noisiness of the wind farms, higher outputs), a significant drop in their cost
and higher interest in the exploitation of wind energy due to high and unstable oil prices as
well as growing urgency of environmental issues and forthcoming climatic changes.
While the first surge of wind farm erection concerned a rather narrow number of countries
with Denmark and Germany leading the list (including Spain since 2000), since 2005 there
has been a massive expansion of wind energetics across the continents. Recently, wind
energy has been systematically supported in the USA and China and nowadays also in a
number of European countries (e.g. France, Great Britain, Portugal, Italy) as well as in extra-
European countries (traditionally India, followed by Canada, Japan, etc.). The United States
along with China have become leaders as for the countries with newly installed power
Wind Farm – Technical Regulations, Potential Estimation and Siting Assessment
144
capacities, even if much smaller Germany and Spain (behind the USA) still maintain strong
positions as for the so far installed power capacity thanks to their head start.
Overall, in 2008 the world-wide installed capacity of wind farms reached the level of 120
GW, out of which 26 GW were gained last year (for a better idea: the total installed capacity
of all the power plants in the Czech Republic is about 17.5 GW). The appreciable significance
of wind energetics is documented by the fact that within the European Union energy from
wind covered 4.2 % of electric energy consumption in 2008 and that year wind farms
achieved the highest increase ever in the installed capacity among all the energetic sources.
As for the future development, a decrease in constructions may be expected in the regions
where power energetics broke through as first, i.e. particularly in Germany and Spain. The
construction of wind farms is slowly facing a shortage of suitable inland localities and
power system limits as for the generated power transmission. However, an intense
development will continue in other European countries, particularly in the extra-European
ones and globally the existing record growth of wind energetics is likely to be beaten. In the
near future, we should also live to see a more extensive construction of off-shore wind
farms, mainly in the area of the North Sea. It is in case of the “off-shore” wind farms where
major technological innovations may be expected and in all probability, for example,
floating wind farms to be erected in deep waters or huge off-shore wind farms with an
output of over 10 MW may even be anticipated (Cetkovský et al., 2010).
The Czech Republic cannot be included among advanced states as for wind energy
exploitation even if the historical development may suggest otherwise. The fact that a lot of
attention was paid to wind energetics in the Czech Republic in the past is evidenced by a
book by František Kašpar (Kašpar, 1948). The modern development of wind energetics
proceeded in two stages in the Czech Republic. The first stage is related to the period of
1990-1995. Then 24 wind turbines were constructed with a total installed nominal output of
8.22 MW. Before 2001 the wind energy purchase prices fluctuated from 0.9 to 1.13
CZK/kWh, which did not make a profit-making operation of WF possible.
The second stage of the development of wind energetics was started by the Energy
Regulatory Office price decision for 2002, and gradually also for 2003, which set the
minimum purchase price of power generated from wind for the amount of 3 000
CZK/MWh. This price went gradually down to 2 340 CZK/MWh in 2009 and to 2230
CZK/MWh in 2010 and nowadays, but still permits a profit-making construction and
operation of wind farm projects.
Since then, the construction of wind farms has been rising slowly. Currently, there are wind
farms predominantly in the region of the Ore Mountains (Krušné hory), less in the Drahany
Upland (Drahanská vrchovina) or in the Nízký Jeseník Mountains (Czech Republic). The
individual wind farms or small wind farms are operated also in other parts of the Czech
Republic. The largest wind farm in the CR was erected in 2007 near Měděnec and the water
reservoir of Přísečnice in the Ore Mountains. In total, there are nowadays 24 wind turbines
of a total output of 49.5 MW, which thus account for more than a third of the overall wind
farm output in the CR. The construction of this wind farm resulted in a rather sharp increase
in the installed capacity in 2007 (Cetkovský et al., 2010).
In 2008 an increase in the installed capacity was not that significant, namely due to
prolonged delivery dates of wind turbines, blocking the capacities to supply the output
into the electric network (wind farm projects and projects of other types of renewable
energy sources) and growing obstructions from the part of certain state administration
authorities.
Wind Farms and Their Impact on the Environment
145
By the end of 2008 there were 111 wind turbines in operation in the Czech Republic of an
overall output of 145 MW. In 2008 wind participated by 0.29 % on the power generation in
the CR. The capacity factor (efficiency) of the majority of the wind farms ranges from 20 to
25 %; rarely, however, wind farms in exposed sites achieve much higher values.
The future development of wind energetics in the Czech Republic is unclear. On one hand,
there is a favourable purchase price in favour of constructing wind farms and in many
localities of the Czech Republic there are quite good wind conditions. On the other hand, the
construction is rather slowed down by a complicated and non-transparent permission-
granting process and inconsistent public administration’s attitude. The most probable
scenario for the next few years is a further but slow increase in new wind farms with annual
output increases at the level of about 50 MW (in 2010 mere 20 MW – Lapčík, 2010).
However, the real development shall predominantly depend on the support from the part of
the political representation which is rather unenthusiastic despite the international
agreements and national joint responsibility for a dismal development of the earth’s climate.
The Czech Republic’s wind energy interests are defended by the Czech Wind Energy
Association, a voluntary organization of physical and legal entities who are active in the
field of wind energy exploitation or are interested in the issue.
3. Technology of wind turbines and their development
A wind turbine is a machine that converts kinetic energy from the wind into electric energy.
In dependence on the rotor diameter, defining an area S swept by the rotating blades, the
machines are divided into small, medium-sized and large wind turbines (WT).
Among small wind turbines (SWT) there are turbines with a nominal output below 60 kW and
blade diameter up to 16 m. The most significant category is small SWT with a nominal
output below 10 kW, which dominate in producers’ catalogues. This group may be divided
into two subgroups (Štekl, 2007).
They are micro-sources of a rough output up to 2 or 2.5 kW, the assortment of which is the
widest as for the producers. They are small WT with a blade diameter from 0.5 to 3 m,
which are solely designed for charging batteries. Such accumulated energy may be used to
power communication systems, radio and televisions receivers, fridges and other electrical
appliances and light. Small WT have come much useful on sea yachts as energy sources for
radio stations, navigation systems, maintaining capacities of starter batteries and lighting.
Such devices usually operate with a direct current 12 ÷ 24 V.
The second subgroup of the SWT category are machines with a nominal output from 2.5 to 10
kW. These are turbines with a blade diameter from 3 to 8 m, which similarly to the machines of
the previous group operate in the stand-alone regime (are not connected to the grid). Such
machines have a usual output voltage of 48 to 220 V and they are offered for the house heating
or moderate heating purposes, water heating or to drive engines. A published analysis back in
2002 (Štekl, 2002) proved that power generation by such sources for the needs of houses or
small farms, which may be connected to the power grid, is not profitable. From the economic
point of view, they are justifiable only in places without a possible connection to the grid and a
minimum mean annual wind rate of 4.5 m/s at the altitude of 10 m. Power generation by SWT
in order to sell energy to power distributors is not economical due to significantly higher
specific costs (by as much as several tens of percents).
Thanks to the growing dimensions of new wind turbine blades, the former category of large
WT split into two categories, namely medium sized wind turbines with a blade diameter from
Wind Farm – Technical Regulations, Potential Estimation and Siting Assessment
146
16 to 45 m and a nominal output ranging from 60 ÷ 750 kW and large wind turbines with a
blade diameter from 45 to 128 m and a nominal output of the turbines from 750 to 6 400 kW.
The largest WTs with a nominal output over 3 000 kW are mostly facilities designed for
offshore operations. Producers sporadically offer WT with a nominal output up to 300 kW
or WT with outputs ranging 300 ÷ 750 kW. The widest line of products concerns the output
ranges from 1 500 to 3 000 kW. Keeping to this fact, the highest number of WT is in this
category (40 %) out of all the constructed WT in Germany before 2005 generating 66 % of the
German annual WF energy production. The mean output of all the WF constructed before
2005 in Germany was 1723 kW (Ender, 2006).
3.1 Technical solution of wind turbines
3.1.1 Wind turbine rotors
Apart from the meteorological parameters, the output gained from the flowing air depends
on the WT rotor swept area and power ratio value (See the Chapter 3.2). Therefore, rotors
are the cardinal components of a WT and they have experienced a surprising development
for the past 30 years, as for their size, aerodynamic characteristics and operation regimes.
For example, back in 2004 there were 90% of WT with a rotor diameter below 60 m in
Germany. A lot produced wind turbines used to be three-bladed, mostly with a “pitch”
system rotor regulation and a variable number of revolutions. Growing dimensions of the
rotors lay high demands on the construction and used materials in order to ensure reliability
of operation. Large blades suffer from considerable loads, e.g. at the moment when a large
mass of the blades is halted rearranging the blades into a so-called flag position. Apart from
small-scale turbulence, possibly huge vertical wind speed gradients, which may in extreme
cases reach up to 10 m/s per 100 m, have a negative impact on the lifespan of the material of
large blades (Štekl, 2007).
To prevent an increase in the wind speed, which leads to a rise in output, from causing any
damage to the generator, a suitable method must be used how to limit the output supplied
by the rotor. There are various methods of the rotor output regulation, which are
characteristic for the individual types of WT. In principle, there are three methods of control:
a. regulation when the rotor blades with a constant angle of blades setting cause flow
separation, the so-called “stall“ regulation,
b. regulation by pitching the rotor blades into larger angles and reducing the lift force and
output, the so-called “pitch“ regulation,
c. regulation by setting the rotor blades into smaller angles and thus reducing the lift
force, increasing the resistance and causing a drop in output, the so-called “active stall“
regulation.
The turbines regulated by the “stall“ regime are simpler in their construction than the
turbines with “pitch“ regulation, as they do not have a technical system changing the rotor
blades setting. When compared to “pitch“ regulated wind turbines, technically the “stall“
regulation of output has the advantages below:
• simple construction,
• undemanding maintenance with respect to a lower number of mobile parts,
• high reliability of the output regulation.
What is a disadvantage of the regulation method is the fact that the rotor output falls at high
speeds, and thus its efficiency decreases too, which happens in case when the wind energy
is at its top. Another drawback of the method is the necessary fine adjusting of the blades
Wind Farms and Their Impact on the Environment
147
frequently after the pilot operation in the given locality. Another disadvantage of the rotor is
its inability to start on itself, which is secured by an electric motor. Currently, producers offer
the “stall“ regulation regime in WT of a nominal output roughly below 1 000 kW, and
exceptionally with larger ones.
The “pitch“ regulation represents an active system which works with an input signal about
the generator’s output. Always when the generator’s nominal output is exceeded, the rotor
blades change the stagger angle towards the flow, which causes a reduction in the drive and
aerodynamic forces as well as it limits the utilization of the turbine output. For all the wind
speeds over the “nominal“ speed which is vital to achieve the nominal output, the angle of
attack is set so that the turbine provided the required output. Wind turbines with the
“pitch“ regulation are more sophisticated than the “stall“ regulation turbines as the rotor
blades setting changes continuously. The “pitch“ regulation has the following advantages:
• it permits an active output control within the overall wind speed range,
• when compared to the “stall“ regulation, it provides a higher production of energy
under the same conditions,
• a simple start of the turbine’s rotor changing the setting of the angle of attack,
• it does not require any strong brakes for a sudden halt of the rotor,
• it limits the rotor blade load at higher wind speeds over the ”nominal speed“,
• a favourable position of the rotor blades with respect to a low load in case of extreme
wind speeds.
The drawback of this type of regulation is a more complicated and significantly more
expensive rotor shafts which must carry enormous force exerted on the blades and, at the
same time, ensure a possible pitching of the blade around the blade’s linear axis.
In the initial regimes, the regulation “active stall“ is identical to the previous type of
regulation, i.e. the “pitch“ one. It differs in the last regime when maintaining the constant
output is not achieved by increasing the blade setting angle but decreasing this angle. In
such a regime it is the case of separation control on the blades, thus “active stall“. The
advantage of this type of regulation, compared to the previous one, is lower sensitivity to
the surface pollution on the blade’s leading edges (insects).
3.1.2 Wind turbines with/without a gearbox
Besides the traditional technology with a mechanic gearbox ensuring a transmission of a
rotor’s low speed into much faster rotation speed of conventional generators, wind turbines
without a gearbox are also produced. So far both types of wind turbines have been
successful in the international market. Enercon is one of the leaders in the gearbox-free
technology. Both the types have their advantages and disadvantages. A decision whether to
make wind turbines with or without a gearbox is often a matter of philosophy from the part
of the individual producers, while it is the brand’s tradition, development targets and
economic analyses that play an important role too.
The gearbox free solution is based on the exploitation of multi-pole low-speed generators.
However, they have rather big dimensions, which may cause problems during transport,
especially in the megawatt class. On the other hand, there are a significantly lower number
of the machine components. There is no need for a large gearbox, connecting parts, there is a
fewer number of rotating elements, simpler nacelle and, after all, the maintenance is easier
as well. Both in “stall“ as well as in power controlled “pitch“ regulation and in power
controlled system of gondola turning no hydraulic oils are required, which is a great
Wind Farm – Technical Regulations, Potential Estimation and Siting Assessment
148
advantage both for the operation and maintenance. An argument that special generators
made only for wind farms in small series are expensive when compared to classical
generators is out of place. Along with higher outputs and dimensions of wind turbines, the
classical generators and gearboxes are manufactured in small numbers too, which means
that a lower price with respect to mass production is not probable.
Traditional constructions of wind turbines are grounded in the use of a drive shaft, bearings,
gears and couplings. Technically, all the components are common machinery components
that may be supplied by specialized producers. This way it is possible to guarantee a high
quality of products at low costs and a possible replacement of a component supplier in
order to improve the quality or lower the price. Thanks to the current manufacturing
standards of gearboxes, the noise caused by a gearbox does not give cause to construct wind
turbines without one. Nowadays, gearboxes are able to last twenty years, while lubricating
oil need not be changed that often. The overall machine unit of the gondola is divided into
compact components which enable for an easy transport and assembly on site even in the
megawatt class.
3.1.3 Wind turbine towers
As clear from company catalogues, the most widespread wind turbine towers are slightly
conical steel tubes. Along with a rise in the turbine outputs, towers are becoming higher, as
high as 100 to 120 m. Therefore, certain suppliers offer concrete towers for heights over 100
m (e.g. Enercon 4.5 MW near Magdeburg, Germany) and towers in the form of a lattice
construction (Štekl, 23007). Lattice towers are perceived adversely due to their “non-
aesthetic” appearance and many environmentalists have stigmatized them for damaging the
face of the landscape. Other oppose the criticism and say that when compared with the tube
towers, the lattice towers have the following advantages in the landscape:
• transparentness, which means that the lattice towers better blend in the landscape,
particularly looking from a greater distance,
• minute reflexion of incident light,
• suitable planting into a specific face of the landscape, e.g. forest landscape,
• incorporation into the landscape with already erected structures of such a character
(e.g. line masts).
Another advantage of the lattice towers when compared to the tube ones is a lower
consumption of steel, which means that at identical costs the produced lattice tower is 20 %
higher than the tube one. For instance, the company of Nordex offers a steel tower of 100 m
at 319 t and a lattice tower of 105 m at 185 t. The company of Fuhrländer even offers a lattice
tower which is 160 m high (weight of 350 t). The assembly of a lattice tower and the
transport of its components is simpler, which constitutes a great plus in the construction of
wind farms in the mountainous conditions. Having finished the lattice tower by zinc coating
a 40-year lifespan is guaranteed, which means no painting the steel tube towers is required.
3.1.4 Wind turbine Vestas V90 – 2.0 MW
Another example is a wind turbine by Vestas Wind Systems A/S, type Vestas V90 – 2.0 MW,
which is a characteristic representative of the wind turbine group with a gearbox (from the
rotor the mechanical energy is carried by the main shaft via a gear unit onto the generator).
Such wind turbines are produced in a mass scale and at present are erected both in the EU
countries as well as outside the EU (in the USA, Mexico, Australia, etc.). It must be pointed