Wind Farm Impact in Power System and Alternatives to Improve the Integration Part 9 doc
Bạn đang xem bản rút gọn của tài liệu. Xem và tải ngay bản đầy đủ của tài liệu tại đây (4.61 MB, 20 trang )
Wind Farms and Their Impact on the Environment
149
out that as for the basic parameters, wind turbines with a gearbox from other producers do
not much differ from the Vestas machines, which still belong to the most experienced
producers in the field.
Fig. 2. Wind turbine power curve (Vestas V90)
A Vestas V90-2.0 MW wind turbine has a 45 m long rotor blade (rotor diameter is 90 m – See
Figures 3 and 4). It is a slow-circulating machine with revolutions from 9 ÷ 14.9 rev/min.
The cut-in wind speed is 2.5 m/s, the wind nominal speed is 13 m/s (See Fig. 2), and the
cut-out (maximum) wind speed is 21 m/s. Exceeding this speed the machine automatically
brakes and shuts down.
The wind turbine is regulated by pitching the blades (“pitch“ regulation) by means of an
OptiTip
®
device by Vestas with an active steering the rotor up the wind. By means of
OptiTip
®
the rotor blade setting angles are under permanent control and thus the blade
setting angle is always adjusted to the prevailing wind conditions. In this manner, power
generation is optimized and noise is minimized.
The rotor blades (Fig. 4, Lapčík, 2009) are made from epoxy resin reinforced by glass fibre
(laminate). Each rotor blade is made up from two halves glued together by a carrier profile.
Special steel anchoring fills join the rotor blades to a rotor blade bearing. If required, a
technology with heated rotor blades may be supplied.
The main machine room and rotor shaft segments are in Figure 6. From the rotor the
mechanical energy is carried by the main shaft via a gear unit onto the generator. The
gearbox is combined with a planet gear and spur bearing. The output transfer from the
gearbox onto the generator is carried out by means of a composite coupling that does not
require any maintenance. The generator is special as it is quadripolar, asynchronous and
with an advanced rotor.
Braking the wind turbine is conducted via arranging the rotor blades into a so-called flag
position. The parking disk brake is situated on the high-speed power shaft.
All the wind turbine functions are controlled by control units based on a microprocessor
base. This operation control system is placed in the nacelle. Changes in the rotor blade
setting angle are activated via a torque arm by a hydraulic system which allows the rotor
blades rotate axially by 95°.
Wind Farm – Technical Regulations, Potential Estimation and Siting Assessment
150
Fig. 3. Wind turbine of Vestas company – an overall view
Four power driven gearboxes are responsible for positioning the nacelle up the wind
turning the pinions that reach into the dents of a yaw bearing placed on the top of the tower.
The bearing system of positioning up the wind is a sliding bearing system with a built-in
friction and self-locking function.
The nacelle cover (Fig. 6) made of plastic reinforced by glass fibre protects all the
components inside the nacelle from rain, snow, dust, solar radiation, etc. The gondola is
accessible through a central aperture from the tower. Inside the nacelle there is a jib crane
for maintenance.
Wind Farms and Their Impact on the Environment
151
Fig. 4. View of a rotor blades, nacelle and upper section of the Vestas wind turbine tower
There has been a significant development in the wind turbine towers, which have grown
from the original 20 m to 100 or 120 m, or higher in extreme cases. The most widespread are
poles in the form of slightly conical steel tubes. Currently, at the heights over 100 m the
poles are usually made of concrete or combine steel and concrete. A possible option are
lattice construction poles which are advantageous both as for their price and construction.
However, they are refused by a group of “environmentalists” who feel that the towers
damage the face of the landscape.
A conical steel tubular tower (Vestas) is either 105 metres or 80 metres high (Fig. 3 and 4).
The diameter of the ground flange is 4.15 m (Fig. 5), the top flange diameter is 2.3 m. It is
supplied with a finish in a green-grey colour. The tower is anchored into the foundation in
the form of a ferroconcrete plate of about 16 metre diameter, height of 1.9 m (on a footing
bottom in the depth of 3 m). The foundation is placed below the ground surface and topped
with a one-metre-thick layer of ground.
The total weight of the technological part of the wind turbine (without the foundation) is
331 tons (gondola 68 t, rotor 38 t, tower 225 t).
The wind turbine is constructed for the temperatures ranging from -20 °C to +55 °C. Special
measures must be taken beyond the afore mentioned temperature range.
Beside the wind turbine there is a container concrete transformer station (in the majority of
cases there is one transformer station for three machines). The transformer is oil, two-
winding in a container version. The transfer is from 690 V to 34 kV and the nominal output
is 1.6 MVA. Nowadays most of producers place the transformer station directly inside the
wind turbine tower.
Wind Farm – Technical Regulations, Potential Estimation and Siting Assessment
152
Fig. 5. View of the anchorage of the wind turbine pole into the anchor plate (Lapčík, 2008)
3.2 Calculation of wind turbine output
The term of wind power density P is understood as the capacity which could be obtained at
hundred-percent exploitation of the kinetic energy of the wind flowing by an area per unit
perpendicularly to the flow direction. It may be determined according to the relation
3
.
2
u
P
ρ
= [W/m
2
] (1)
The wind power density passing through the plane S [m
2
] perpendicular to the flow
direction is expressed as below
3
2
S
u
PS
ρ
= [W] (2)
The power of a wind turbine removed from the blowing air through the turbine rotor P
s
is
expressed by the relation below
3
2
p
S
u
PSc
ρ
= [W] (3)
Wind Farms and Their Impact on the Environment
153
where
u …. wind speed (m/s),
ρ …. specific weight of the air (kg/m
3
),
S …. rotor swept area (m
2
),
c
p
… power coefficient (-) which is dependent on the extent to which the rotor decreases the
speed of the flowing air; the power coefficient has a theoretical maximum c
pmax
= 0.593,
really is value to 0,5.
Fig. 6. View of the wind turbine nacelle: 1 – hub controller, 2 – “pitch” control cylinders, 3 –
blade hub, 4 – gearbox, 5 – generator, 6 – high voltage transformer, 7 – hydraulic unit
(Vestas, 2009)
The dependence of power in the wind on the air density in the real atmosphere is expressed
by a function of the altitude and further on, it is a function of an aperiodic alternation of
warm and cold air masses (Štekl, 2007). Roughly, if we take as a basis a wind turbine output
at the sea level, the output will be lower by 5 % at the altitude of 500 m, at the altitude of 800
m by 7 % and at the altitude of 1200 m by 11 %.
The output produced by a wind turbine is indicated by a power curve (See Fig. 2 above),
which is a basic indication of each wind turbine type.
It is apparent from the relations above that the wind turbine output depends on wind speed
in an extraordinarily sensitive manner. It is clear that evaluating the wind potential, errors
in wind speed determination may thus project into the result in a negative way.
Pursuant to the law, the power grid operator is obligated to take electric power generated by
a wind turbine at a rate set by the Energy Regulatory Office price decision. According to this
price decision for wind farms put in operation after 1
st
January 2010, the purchase price of
Wind Farm – Technical Regulations, Potential Estimation and Siting Assessment
154
power supplied to the network is 2.23 CZK/kWh and for wind farms put in operation after
1
st
January 2009 it was 2.34 CZK/kWh. In 2008 it was 2.55 CZK/kWh, in 2007 2.62
CZK/kWh and in 2006 it was 2.67 CZK/kWh.
In 2008 the new wind turbines in Germany belonged to Enercon 52 %, Vestas 32 %,
REpower 6 %, Fuhrlander 5 %, Nordex 2 % and other companies are represented by three
percents (Ender, 2009).
The technology of wind turbines has experienced an extraordinary progress since 1980, a
beginning of the modern wind energetics in Europe. The development has been manifested
by:
• increasing the WT output per unit due to a growth in rotor diameter,
• increasing the WT tower height and reducing the adverse influence of the earth surface
roughness,
• higher quality WT demonstrated by lower break-down rates, noisiness and demands of
operation,
• lower specific costs of the generated power.
4. Environmental impacts of wind farms
Assessing the environmental impacts of wind energetics projects the following factors must
be taken mainly into consideration (Lapčík, 2008, 2009):
1. noise,
2. impacts on the face of the landscape,
3. impacts on the migration routes and bird nesting, impacts on the fauna, flora and
ecosystems,
4. stroboscopic effect,
5. impacts on the soil, surface water and ground water,
6. other impacts.
4.1 Noise
Operating a wind farm two types of noise arise. It is a mechanical noise, the source of
which is a machine room (a generator including a ventilator, gearbox, rotation mechanisms
or a brake). The amount of noise emitted into the environment depends on the construction
quality of the individual components (e.g. gearwheels) of the overall machine as well as on
the placement and enclosure of the overall machinery. All the stated parameters of the
currently lot produced wind turbines are optimized. Except for small deviations when
turning the gondola, the noise is stable.
Certain noise impacts result from the blades passing the wind turbine tower. In the past,
pole vibrations appeared in some wind turbines, which has been overcome by modern
technologies (Štekl, 2007). Next, it is an aerodynamic noise that arises due to the interaction
of flowing air and the rotor airfoil and whirl winds relaxing behind the blade edges. Its
frequency spectrum is very balanced and falls with a rise in frequency. Aerodynamic noise
is reduced by the state-of-the-art constructions of rotor blades or rotor types when at the
expense of a slight fall in the generator’s output the noise levels are reduced.
The noise spreads from the point source in dependence on the direction and speed of air
flows, in dependence on the intensity of vertical mixing of air (below the temperature
inversion the transfer of noise is prevented in the vertical direction), on the shape of the
Wind Farms and Their Impact on the Environment
155
earth surface and on the existence of obstacles to the noise spread. The noise spreading from
the point source subdues along with the distance. A simplified version deals with a drop in
the acoustic pressure along with a distance logarithm as a wind speed function. Mostly, this
simplified version of the calculation (i.e. without the influence of the wind rose, relief shape,
temperature layers, etc.) is used in model calculations to define an noise field in the
surroundings of a wind farm.
The intensity of the perception caused by noise is greatly influenced by the proportion
between its intensity and the intensity of other noises labelled as the background noise. It is
known that a noise caused by a viscous and turbulent friction of air and the earth surface
reaches high values, especially in the mountain conditions. For instance, during a
windstorm human speech becomes difficult to understand under such conditions. In the test
polygon in Dlouhá Louka in the Ore Mountains measurements were conducted that showed
that at wind speed up to 5 m/s the background noise level was within the limits 30 ÷ 40 dB,
but at the wind speed about 6 m/s the background noise was from 33 to 47 dB. At the wind
speed over 8 m/s the noise exceeded the value of 45 dB (Štekl, 2007).
Government Decree 148/2006 Coll. on health protection against negative impacts of noise
and vibrations sets the top admissible level of acoustic pressure outdoors at 50 dB during
the day (06 ÷ 22 hours) and at 40 dB at night. However, this decree does not consider the
circumstances when the background noise exceeds the noise produced by a wind farm.
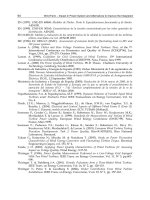
Note: Wind turbine No. 1 (in the top) is shut down at night time. Check point of noise – points No. 1, 2
and 3.
Fig. 7. Equivalent levels of noise – night operation of wind farm.
Wind Farm – Technical Regulations, Potential Estimation and Siting Assessment
156
The own assessment of acoustic situations is carried out by means of a noise study which
assesses the noise near the nearest built-up area. It happens that the admissible equivalent
noise level is not observed in the loudest night hour in the outside protected area. In such
cases, the wind farm regime is required to be limited via reducing the output, which thus
results in lowering the acoustic output (e.g. from 109.4 dB to 102.0 dB). In some cases it is
though necessary to switch off several machines at night – See Fig. 7 (Lapčík, 2006, 2007,
2009). For example, in Germany it is recommended to construct wind farms more than 300
m from a single residence and more than 500 m from an end of a settlement. Nevertheless,
the experience of the monograph author is that the minimum distance of wind farms from
any housing development should be 575 to 600 metres.
Traffic noise arising in the time of construction and operation of a wind farm is time limited
and usually negligible. In the time of construction it is important to ensure disposal of the
spoil in the volume of about 770 m
3
, delivery of concrete in the volume of about 490 m
3
per
one machine and delivery of the own technological facility (Lapčík, 2006, 2007, 2010). In the
time of operation, there are only one or two vans per week.
The impact of traffic noise and its changes in connection with construction and later
operation of wind farms mostly shows in the day in the surroundings of the access road to
the site. As the points for calculations, for which the calculation of noise from stationary
sources is carried out, are often far away from the road, it is important to describe changes
in the noise situation in a noise study changing the equivalent noise levels in a standardized
distance from roads (e.g. 7.5 m from the axis of the closest lane).
4.2 Impacts on the face of the landscape
A term of the face of the landscape has been introduced by Act 114/1992 Coll. on the
conservation of nature and landscape. Therein, the face of the landscape is defined (§ 12) as
a natural, cultural and historic characteristics of a particular site or region. The face of the
landscape is protected against activities degrading its aesthetic and natural value.
Interference with the face of the landscape, particularly as for locating and approving
structures, may occur only with regard to keeping significant landscape elements, especially
protected areas, cultural dominant features of the landscape, harmonic criteria and relations
in the landscape.
Talking of the impacts on the face of the landscape, in case of complying with measures
connected with the interests of health protection against unfavourable impacts of noise and
the interests of the nature conservation, the impact on the face of the landscape may be
defined as a dominant aspect in connection with the assessed type of project.
There is no doubt that the erection of wind farms embodies a highly visible interference
with the face of the landscape. As for the protection of the face of the landscape it is vital to
find out if the planned structure does not interfere with any natural park. Stipulated by law,
a natural park represents one of the most sensitive areas in the protection of the face of the
landscape and a construction of a wind farm should not be implemented there. Natural
parks are landscapes with concentrated significant aesthetic and natural values for the
conservation of which they have been established (in accordance with § 12 art. 3 of Act
114/1992 Coll. on the conservation of nature and landscape, as amended). It is solely the
protection of the face of the landscape which makes the core of their protection.
Visualization of wind farms is usually processed by means of computer animation and
making use of photographs of the existing landscape in order to assess the impacts on the
face of the landscape – See Figure 8 (Lapčík, 2009).
Wind Farms and Their Impact on the Environment
157
Fig. 8. A view of photo-visualized wind farm
Wind Farm – Technical Regulations, Potential Estimation and Siting Assessment
158
The site of the face of the landscape affected by the assessed wind farm plans (i.e. an area
from where wind farms can be potentially seen) is usually a vast territory. The site of the
face of the landscape, i.e. an area which may be visually influenced by the assessed
structure, is considered in terms of distance views as far as 2 to 5 km in case of a strong
visibility range and as far as 10 km in case of a clear visibility range – by course of a
Methodical Direction 8/2005 (Methodical Direction of the Ministry of the Environment
No.8, June 2005). Areas which are shaded by forming the georelief are excluded from the
ranges.
There is a frequent question whether it would be possible to generate an identical volume of
electric power by wind farms even at possible lowering of their towers and reducing the
rotor diameters as in this manner the face of the landscape would be less altered. The
calculations may be carried out on the grounds of known relations for the calculation of
wind (P
S
) power (See Chapter 3.2 above).
The calculation results though imply that shortening the wind turbine pole height from 100
metres to 70 metres (at wind speeds c = 8.5 m/s and c = 6.5 m/s) and using a rotor of 90-
metre diameter, the electric power fell from 100 % (pole height of 100 m) to 45 % (pole
height of 70 m). Using a rotor of 50-metre diameter (instead of 90 m) the electric power
would drop to 31 % (pole height of 100 m) or to 14 % (pole height of 70 m) – (Lapčík, 2006,
2007, 2008).
It is thus clear that lowering the pole height or reducing the wind turbine rotor diameter
there would be a considerable loss in the gained electric power and practically an analogous
facility with all its negative environmental impacts would have to be constructed (noise,
land required for the machine’s foundations, access roads, energy infrastructure, etc.) as if
implementing a wind turbine of 100-metre-high pole and 90-metre rotor diameter. At the
same time, the impact on the face of the landscape in smaller machines would be identical.
The facilities would only appear to be located further away from the observer than in case of
higher facilities (higher pole and wider rotor diameter).
4.3 Impacts on the migration routes and bird nesting, impacts on the fauna, flora and
ecosystems
The literature does not report any significant negative impacts of wind farms on birds. The
results of a wind farm impact research on the avifauna in the Netherlands (Winkelman,
1992) imply that no verifiable impacts on nesting birds or birds perching for food into the
vicinity of wind farms have been registered. A long-term observation of 87,000 birds in the
vicinity of wind farms show that the majority of birds completely avoided the wind farms
(97 %) and only a fraction chose to fly through a rotor. This usually results in a clash with a
blade. Despite being hit by the blade there is no inevitable rule of a serious injury or death of
the bird. The existence of a pressure field in front of the rotating blade forms a barrier which
often repels the birds.
Experience from the observation of bird behaviour close to wind farms has also been gained
in the Czech Republic. For example, in the Ore Mountains in the surroundings of the
municipality of Dlouhá Louka a detailed research in nesting bird associations in three most
significant biotopes (in the forest, on the meadow and cottage settlement) was carried out in
1993 and 1994, i.e. prior to and after the construction of a wind farm. The results presented
in the study document that the operation of the wind farm does not affect nesting of bird
associations in a significant manner.
Wind Farms and Their Impact on the Environment
159
Based on surveys, possible risks connected with wind farm operation (particularly collisions
of birds and bats with the facility) are greater than those related to an operation of other
similar structures (high towers, high voltage wires, roads, etc.). Moreover, it may be said
that in the majority of cases applying suitable technical solutions there is no reason to expect
distinct degradation of the conditions of the site suggested for the construction of wind
farms from the environmental point of view.
Nevertheless, it is convenient for wind farms to be located outside important birds’
migration routes and breeding places. This may be checked preparing a study which
assesses impacts of planned wind farms on birds and other vertebrates.
The wind farm structures are mostly situated outside the component parts of the ecological
stability zoning system, outside areas of higher degrees of ecological stability, or outside
localities with near nature ecosystems. Also, a possible impact on especially protected areas
and biotopes of specially protected animal species is negligible. In order to exclude
unfavourable impacts on the flora and fauna it is advisable to process a biological (floristic
and faunistic) assessment of the localities in question.
4.4 Stroboscopic effect
Stroboscopic effect is a phenomenon when rotating objects lit by a periodically variable light
do not seem to be moving. In case of wind farm operation it is a rather a possible effect of
gleams and shading by a mobile shade under the sunlight. The gleams of light from the
rotor blades may be eliminated by a matte finish of the rotor blades (e.g. in grey colour).
If a rotor of commonly applied wind turbines rotates within the range of 8 to 17 revolutions
per minute, the frequency of gleams is at the level of 0.4 Hz to 0.9 Hz. Safely outside the
frequency from 5 to 30 Hz, it is however on a level which could cause the so-called
photosensitive epilepsy in sensitive people found near wind farms.
Shading by a mobile shade may be observed in wind farms at optimal light conditions
within 250 to 300 metres from the wind farm. It is practically negligible at further distance.
With regard to the fact that the majority of assessed wind turbines are usually located in the
distance of 500 metres from any residence, this phenomenon appears as minor.
4.5 Impacts on the soil, surface water and ground water
One wind turbine is expected to take up an agricultural land from 0.10 to 0.13 ha, where the
own built-up area for the machine is about 200 m
2
(Lapčík, 2006, 2007, 2010). Mostly, it is
land with predominantly substandard production capacities and limited protection. Having
terminated the wind turbine operation, the land is expected to be reclaimed for possible
agricultural use. The stabilized access roads can be used as access roads for pieces of land
from the adjacent roads.
The operation of wind turbines does not produce any technological water or sewage. The
rainwater from the stabilized access road areas is mostly drained gravitationally into the
surroundings and the ditches.
The impact on the surface and ground water is not expected implementing such projects,
but it is important to adhere to all the relevant safety measures. The wind turbine facilities
do not influence surface water or the quality, water level or flow directions of the ground
water, both during construction and own operation. However, during construction of
service roads and the wind turbine facilities it is important to take such measures to prevent
Wind Farm – Technical Regulations, Potential Estimation and Siting Assessment
160
changes or worsening of water discharge, the occurrence of the manifestations of erosion or
to limit the pollution and soil drag into influent stream beds to minimum in course of
construction.
4.6 Other impacts
Within the winter operation there may be a situation when ice or ice fragments fall off the
blades. New wind turbines are expected to be equipped with signalling which recognizes
ice in time or the wind turbine is shut down. Also, technical equipment is expected which is
able to prevent the formation of ice in an effective manner (the rotor blades are produced
from such materials that prevent clinging of the ice onto the blades).
A minimum measure in this respect is an installation of panels warning about a possible risk
of injury due to falling ice off the rotor blades in a sufficient distance from wind farms
(about 250 m).
5. Conclusion
In the Czech Republic a big number of wind turbines and wind farms are being prepared to
be constructed. Nevertheless, the implementation of the approved structures is progressing
rather slowly. The total installed capacity of wind farms in the Czech Republic had been 50
MW by the end of 2006 (Koč, 2007). By the end of December in 2009 the Czech wind farms
had a total installed capacity of 192,9 MW, by the end of November in 2009 then a total
installed capacity of 212,6 MW.
Wind farms of a total installed capacity higher than 500 kW
e
or with tower height exceeding
35 meters are classified according to the Appendix 1 to Act 100/2001 Coll., as amended, into
the category II (projects requiring rogatory proceedings), article 3.2 (the project is
administered by Regional Offices). This implies that the majority of the designed wind
farms in the Czech Republic nowadays must undergo rogatory proceedings.
As a rule, a number of studies make parts of the notification processed according to
Appendix 3 to the Act. For example, they are a noise study, assessment of impacts on the
face of the landscape, assessment of wind turbine impact on birds and other vertebrates, or
the project’s impact assessment on Europe’s outstanding localities and birds’ territories
according to §45i of Act 114/1992 Coll. on the conservation of nature and landscape, as
amended. Certain notifications also contain health risk assessments, which are required by
the law processing the documentation according to Appendix 4 to Act 100/2001 Coll. on
environmental impact assessment, as amended.
Nevertheless, despite the complications (the notification actually takes the form of
documentation) in the majority of cases the process of impact assessment for wind farms is
not currently discontinued within the rogatory proceedings (in the so-called shortened
proceedings), but it must be continued in the full extent (documentation compilation,
opinion elaboration, public hearing), often with repeated supplements to the documentation
before the opinion is elaborated.
This is caused by the negative attitude of the regional offices as well as of the public to wind
energetics, who mostly hold a negative attitude to this renewable source of energy.
Nevertheless, it must be said that the public comments are frequently presented in a very
general manner and still certain types of criticisms reappear even if those have already been
discussed and disproved.
Wind Farms and Their Impact on the Environment
161
With regard to the above mentioned public and regional offices’ attitudes to wind farms, the
environmental impact assessment process for the facilities is protracted and complicated (in
the majority of cases the full assessment process must be taken into account).
6. References
Burian, V. (1965). Wind Mills in Moravia and Silesia. Proceedings of Homeland Study Institute
in Olomouc, Issue 7, 79 p. (in Czech).
Cetkovský, S., Frantál, B., Štekl, J. (2010). Wind Energy in the Czech Republic: Assessment of
Spatial Relations, Environmental Aspects and Socio-Economic Context, Czech Academy
of Sciences. 208 p. ISBN 978-80-86407-84-5. (in Czech).
Ender, C. (2006). Windenergienutzung in der Bundesrepublik Deutschland – Stand
30.6.2006. DEWI Magazin, No. 29, pp. 27-36.
Ender, C. (2009). Wind Energy Use in Germany - Status 31.12.2008. DEWI magazin, Vol. 34,
pp. 42-58.
Kašpar, F. (1948). Wind Engines and Power Stations, Part 1, Czechoslovak Electrotechnical
Union, Prague. 367 p. (in Czech).
Mathew, S. (2006). Wind energy. Fundamentals, Resource Analysis and Economics.
Koč, B. (2007). Record Year of Wind Generators in Europe, Alternative energy, Vol. 10, č. 2,
pp.32-33. (in Czech).
Lapčík, V. (2006). Notification according to Czech Act No 100/2001 Coll. on environmental
impact assessment, as amended, of project „Wind Park Potštát-Lipná“. Ostrava. 75
p. (in Czech).
Lapčík, V. (2007). Environmental Impact Assessment in Branch of Wind Power Plants and
Corresponding Studies. SEA/EIA´2007 Conference Proceedings, Ostrava, pp. 64 - 70.
Lapčík, V. (2008). Environmental Impact Assessment of Wind Generators in the Czech
Republic, Acta Montanistica Slovaca, Vol. 13, Issue 3, pp. 381 – 386. Technical
University of Košice. ISSN 1335-1788. (in Czech).
Lapčík, V. (2008). Notification according to Czech Act No 100/2001 Coll. on environmental
impact assessment, as amended, of project „Wind Park Partutovice“. Ostrava. 77 p.
(in Czech).
Lapčík, V. (2009). Industrial Technologies and their Impact on Environment. (monograph), VŠB-
Technical University, Ostrava. ISBN 978-80-248-2015-6. 362 p. (in Czech).
Lapčík, V. (2010). Documentation according to Czech Act No 100/2001 Coll. on
environmental impact assessment, as amended, of project „Wind Park Potštát-
Kyžlířov“. Ostrava. 91 p. (in Czech).
Mathew, S. (2006): Wind energy. Fundamentals, Resource Analysis and Economics.
Pokorný, O. (1973). List and Location of Wind Mills in Bohemia, Studia geographica 18,
Geographic Institute of Czech Academy of Sciences. 179 p.
Štekl, J. (1993). Wind Energy for Production of Electric Energy in the Czech Republic.
Research report for EACR, Institute of Physics of Atmosphere, Czech Academy of
Sciences. 65 p. (in Czech).
Štekl, J. et al. (2002). Final report of project VaV 320/6/00, subproject Wind Energy. Vol. 1
and 2. Prague: Institute of Physics of Atmosphere, Czech Academy of Sciences. 117
p. and 82 p. (in Czech).
Wind Farm – Technical Regulations, Potential Estimation and Siting Assessment
162
Štekl, J. et al. (2007). Renewable Energy Resources and their Possibilities of Utilization, ČEZ,
a.s. Prague, pp. 79-112 p. (in Czech).
Štekl, J. (2008). Will Apply Wind Energy also in the Czech Republic? Energie (Energy), Vol.
21, Issue 1, pp. 31-33. (in Czech).
www.vestas.com
Part 3
Siting Assessment of Wind Farms
7
Advanced Wind Resource Characterization
and Stationarity Analysis for
Improved Wind Farm Siting
Scott Greene
1,2
and Mark Morrissey
3
1
Geography and Environmental Sustainability
2
Oklahoma Wind Power Initiative
3
School of Meteorology,
University of Oklahoma
USA
1. Introduction
A fundamental question of interest is “What are the geographic patterns of the renewable
wind resources?” Knowledge of the location of local wind capacity remains vital to the
industry, yet commercially viable renewable-related geospatial products that meet the needs
of the wind and weather science industries are often suspect. There are three stages
involved with wind power project planning and operations during which accurate
characterization of the wind plays a critical role:
• Prospecting (Siting): uses historical data, retrospective forecasts, and statistical methods
to identify potential sites for wind power projects;
• Site Assessment (Micrositing): determines the placement of a wind power project; and,
• Operations: uses wind forecasts to determine available power output for hour-ahead
and day-ahead time frames.
The most critical of these is the first – identifying and characterizing the resource. This
chapter will discuss this first stage in detail, outlining the state of the art in understanding
the wind resource, and discussing the strengths and weaknesses of existing methods. For
example, appropriate statistical and modeling methods to compute the wind speed
probability density function (PDF) will be described and critically examined.
In addition, although there has been an increasing awareness of renewable energy as a
viable energy supply source, there has not been a concomitant increase in the awareness
of the impacts that any spatial and temporal trends in the resource (e.g., in the wind
speeds themselves) may have on long-term production, use, and implementation of
renewable energy and renewable energy policy. Thus, potential changes of the wind field
under a changing climate will also be discussed. As will be described in more detail
below, the main topics under examination in this paper are: 1) accurate portrayal of the
resource; and 2) potential implications of climate change on the wind resource of the
future. The overall result will be an improved understanding of how the siting process
works.
Wind Farm – Technical Regulations, Potential Estimation and Siting Assessment
166
2. Wind resource modeling
The first step in determining the amount of potential electrical generation is developing an
accurate portrayal of the resource. Thus, for an accurate representation of the wind energy at a
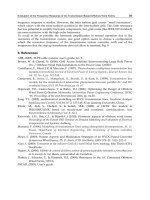
particular location, correct estimates of the wind speed are necessary. Figures 1 and 2 illustrate
the types of products that are typically used by in determining the wind resource. Figure 1
represents the wind resource at 50 m over the contiguous United States (obtained from the
US DoE Wind Powering America program;
wind_maps_none.asp), and Figure 2 is a closer look at a particular state, in this case, the
wind resource map for the state of Oklahoma (provided by the Oklahoma Wind Power
Initiative; http:www.ocgi.okstae.edu/owpi). The fundamental core of these estimates of the
resource is a model of the probability density function (PDF) of wind speed. This is
increasingly used in the wind power industry where it is required for the assessment of
power potential in different locations for wind farm and wind turbine siting (e.g.,
Hennessey 1977; Garcia-Bustamante et al. 2008; Li and Li 2005; Lackner et al. 2008). The
wind power density is required for the estimation of power potential from wind turbines
(Justus, 1978). Since it is a function of the wind speed probability density function, it is
critical that the wind speed PDF be estimated accurately from the available data. The
question then becomes how best to model the resource via fitting the wind speed or wind
power density PDF. As stated by Manwell, et al. (2002): “In general, either of two
probability distributions (or probability density functions) are used in wind analysis: (1)
Rayleigh and (2) Weibull.” (See also Conradsen, et al. (1984) for a description of the use of
Weibull distribution for determination of wind speed statistics.)
Historically, the wind PDF is most often estimated using a parametric model. These models
generally include the Weibull (Stevens and Smulder 1979), Rayleigh (Celik 2003b) and
Lognormal functions (Zaharim et al., 2009). The two parameter Weibull function has
generally been accepted, and is most often used in research and industry, as an adequate
model for the wind speed PDF (Hennessey, 1977; Justus et al., 1979; Pavia and O'Brien, 1986;
Ramirez and Carta, 2005; Monahan, 2006). However, as the Weibull distribution has become
the industry standard, there have been many attempts to improve its overall applicability
for modeling the wind speed PDF. For example, Justus and Mikhail (1976) developed an
approach to adjust Weibull shape/scale parameters to a desired height. Stewart and
Essenwanger (1978) developed a three-parameter Weibull distribution approach which
shows a better fit than a traditional two-parameter Weibull; however, there are significant
difficulties in estimating parameters, so its applicability has been limited.
It has been shown, however, that wind speed does not always have a Weibull-like
distribution (e.g., Tuller and Brett, 1984 , Jaramillo and Borja 2004; Yilmaz and Çelik 2008).
The result is that for wind power density computations, large errors in the resource
estimation will result from this imperfect Weibull approximation. This is especially true
since wind power density is a function of the expected value of the cube of the wind speed
(Petersen, et al., 1997). Therefore, there has been range of other approaches attempting to fit
the wind speed (or wind power density) PDF. These include: Lognormal (Luna and
Church, 1974); elliptical bivariate-normal (Koeppl, 1982, who describes the difficulty
translating such an approach to univariate (speed-only) distributions); and inverse Gaussian
(Bardsley, W.E., 1980, which is offered as an alternative to Weibull distribution, especially in
cases with low frequencies near zero).
Advanced Wind Resource Characterization and
Stationarity Analysis for Improved Wind Farm Siting
167
While much research has focused on parametric and related approaches to this critical
estimation of the wind speed or wind power density PDF, when a robust, smooth histogram
of the wind speed distribution can be determined from the available data, non-parametric
techniques (e.g., Izenman, 1991; Silverman 1986) can also be used given their flexibility and
the likelihood that the actual wind power density may not be adequately represented by one
of the models listed above (Jaramillo and Borja, 2004). A commonly used non-parametric
method in industry and for research is the kernel method (Silverman 1986, Juban et al.,
2007). While the kernel method is becoming increasingly popular in industry, there are
significant problems with this approach. For example, the PDF functional representation
using the Kernel has a number of terms equal to the number of data points used in the
fitting process. Thus, the kernel method is not an optimal method for estimating the wind
speed PDF, since if a PDF estimator is to be used in further mathematical computations a
tractable function with a limited number of terms is required (Hall 1980).
Fig. 1. U.S. Wind Resource Map US wind resource map provided by the Wind Powering
America Program (
There has also been recent research to utilize concepts from the field of geostatistics to
develop a transform function of the wind speed PDF as a function of scale (Morrissey, et al.,
2010a, 2010b). If knowledge of the variance of the wind speed at a given scale is known (or
Wind Farm – Technical Regulations, Potential Estimation and Siting Assessment
168
can be estimated) then the probability density function representing the required scale may
be estimated. In simple terms, the PDF from the higher resolution estimates can be
‘upscaled’ to match that from the lower resolution estimates. Thus, the PDFs can be scale-
corrected, and the problems associated with the Weibull or other approaches can be
overcome. This innovative approach uses the theoretical basis of orthogonal series
estimators, or more specifically, Hermite polynomials (Schwartz (1967), Hall (1980) and
Liebscher (1990)).
Fig. 2. Oklahoma Wind Resource Map Modeled wind resource provided by the Oklahoma
Wind Power Initiative, Classes are defined as above
with Figure 1.
To illustrate this new approach, a series of data fits were applied to a dataset of 10m
windspeeds at five-minute intervals from Boise City, Oklahoma, which is part of the
Oklahoma Mesonetwork (Brock, et al., 1995). The results are shown in Figure 3. The y-axis
in Figure 3 is a representation of wind power density. The value is normalized wind power
density per unit speed. The units are watts/square meter/meter per second divided by air
density. This value is used so that the when the integral of the curve is computed, the units
reflect a measure of the actual wind power density. Although not commonly used in
previous research, this is how the wind PDF values should be developed, as it is a more
representative value of the variable in interest (e.g., actual electrical production).
A standard Weibull fit is compared to a kernel estimator and to a new approach using a
Gauss-Hermite polynomial expansion (see Morrissey, et al., 2010a for details on the Gauss-
Hermite approach). While there is a noticeable variation in the middle of the distribution,
this is less significant in terms of the computation of the overall wind power. The Weibull
distribution performs poorly where it matters the most – at the higher wind speeds. As
might be expected, both non-parametric methods provide a better fit to the histogram than
does the Weibull. The mean squared error for the Weibull distribution is approximately 10
times higher than the value for the other model approaches. Since the upper end of the wind
speed distribution is the most significant when attempting to determine potential energy,