Wind Farm Impact in Power System and Alternatives to Improve the Integration Part 11 pdf
Bạn đang xem bản rút gọn của tài liệu. Xem và tải ngay bản đầy đủ của tài liệu tại đây (769.84 KB, 20 trang )
Spatial Diversification of Wind Farms: System Reliability and Private Incentives 15
effects (5-20 km) is likely t oo small relative to the large scale required for reducing system
volatility.
5.3 Concluding remarks
Our results show that individual wi nd developers choose sites with the highest mean wind
speed, while the system operator will trade off the increased revenue of windy sites for a
more reliable wind supply. Because wind speeds are correlated over space, individual wind
developers in a given region will choose to build on windy sites that are likely to be closely
located to one another. By contrast, the distance between wind farms built by the system
operator is likely to be larger in order to capture the benefits of a reliable supply of wind
power from less correlated wind farms.
These results raise further questions about the reliability benefits of spatial diversification.
Further work could be done to estimate the magnitude of reliability benefits (or equivalently,
the costs of intermittency), or to estimate the effect of serially-correlated, hourly wind speeds
on reliability benefits. Additionally, work could be done to more accurately calibrate the
simulation model to the real world using historical wind speed data and installed wind
capacity for a given region. Using this information, it would be possible to choose locations
that provide the most reliability benefits to the electrical grid (Choudhary et al., 2011) while
balancing g eneration and revenue considerations. Finally, another avenue of research might
examine the effect of reliability incentives on intensive and extensive margins of investment in
wind development. Internalizing the costs of reliability will decrease the private profitability
of wind power and reduce overall wind development, which may be in conflict with other
policy objectives.
6. References
Archer, C. L. & Jacobson, M. Z. (2007). Supplying baseload power and reducing transmission
requirements by interconnecting wind farms, Journal of Applied Meteorology and
Climatology 46: 1701–1717.
Beenstock, M. (1995). The stochastic economics of windpower, Energy Economics 17(1): 27–37.
Cassola, F., Burlando, M., Antonelli, M. & Ratto, C. (2008). Optimization of the regional
spatial distribution of wind power plants to minimize the variability of wind energy
input into power supply systems, Journal of Applied Meteorology and Climatology
47: 3099–3116.
Choudhary, P., Blumsack, S. & Young, G. (2011). Comparing decision rules for siting
interconnected wind farms, Proceedings of the 44th Hawaii International Conferences on
System Sciences, hicss, pp. 1–10.
Elkinton, C. N., Manwell, J. F. & McGowan, J. G. (2006). Offshore wind farm layout
optimization (owflo) project: Preliminary results, 44th AIAA Aerospace Sciences
Meeting and Exhibit.
Hof, J. G. & Joyce, L. A. (1992). Spatial optimization for wildlife and timber in managed forest
ecosystems, Forest Science 38(3): 489–508.
Kaffine, D., McBee, B. & Lieskovsky, J. (2011). Emissions savings from wind power generation:
Evidence from texas, california and the upper midwest, Working paper .
Kaffine, D. T. & Worley, C. M. (2010). The windy commons?, Environmental and Resource
Economics 47(2): 151–172.
Kagan, J., Starfield, A. & Tobalske, C. (2008). Where to put things? Spatial land management
to sustain biodiversity and economic returns, Biological Conservation 141: 1505–1524.
189
Spatial Diversification of Wind Farms: System Reliability and Private Incentives
16 Will-be-set-by-IN-TECH
Kahn, E. (1979). Reliability of distributed wind generators, Electric Power Systems Research
2(1): 1–17.
Kempton, W., Pimenta, F., Veron, D. & Colle, B. (2010). Electric power from offshore wind
via synoptic-scale interconnection, Proceedings of the National Academy of Sciences
107(16): 7240–7245.
Ligmann-Zielinska, A., Church, R. & Jankowski, P. (2008). Spatial optimization as a generative
technique for sustainable multiobjective land-use allocation, International Journal of
Geographical Information Science 22(6): 601–622.
Milligan, M. R. & Artig, R. (1999). Choosing wind power plant locations and sizes based on
electric reliability measures using multiple year wind speed measurements, Technical
report, National Renewable Energy Laboratory.
Milligan, M. R. & Factor, T. (2000). Optimizing the geographic distribution of wind plants in
iowa for maximum economic benefit and reliability, Wind Engineering 24(4): 271–290.
Milligan, M. R. & Porter, K. (2008). Determining the capacity value of wind: An updated
survey of methods and implementation, NREL/CP-500-43433 .
Natarajan, B., , Nassar, C. & Chandrasekhar, V. (2000). Generation of correlated rayleigh fading
envelopes for spread spectrum applications, IEEE Communications Letters 4(1): 9–11.
Novan, K. M. (2010). Shifting wind: The economics of moving subsidies from p ower produced
to emissions avoided, Working paper .
Segerson, K. (1988). Uncertainty and incentives for nonpoint pollution control, Journal of
Environmental Economics and Management 15: 87–98.
Tran, L. C., W ysocki, T. A., Mertins, A. & Seberry, J. (2005). A generalized algorithm for the
generation of correlated rayleigh fading envelopes in wireless channels, EURASIP
Journal on Wireless Communications and Networking 31(1): 801–815.
Worley, C. M. ( 2011). Reaping the whirlwind: Property rights and market failures in wind power,
PhD thesis, Colorado School of Mines.
190
Wind Farm – Technical Regulations, Potential Estimation and Siting Assessment
9
Geotechnical and Geophysical Studies for
Wind Farms in Earthquake Prone Areas
Ferhat Ozcep
1
, Mehmet Guzel
2
and Savas Karabulut
1
1
Istanbul University
2
MES Yeraltı Araştırma, Adana
Turkey
1. Introduction
As Redlinger et al (2002) point out, since antiquity; people have used technology to
transform the power of the wind into useful mechanical energy. Wind energy is accepted
one of the world’s oldest forms of mechanic energy. The re-emergence of the wind as a
significant source of the world’s energy must rank as one of the significant developments of
the late 20th century (Manwell et al, 2009).
Across the Earth’s surface, wind is in horizontal motion. Wind power is produced by
differences in air pressure between two regions. Wind is a product of solar energy like most
other forms of energy in use today. Wind is a clean, abundant, and renewable energy
resource that can be tapped to produce electricity. Wind site assessments include: (1) high
electricity rates, (2) rebates or tax credits from utilities or governments, (3) a good wind
resource, and (4) a long-term perspective (Chiras, 2010).
Procurement costs for critical components and subsystems are given in Table 1. The critical
components of Wind Turbines include blades, rotor shaft, nacelle, gear box, generator, and
pitch control unit. The tower, site foundation, and miscellaneous electrical and mechanical
accessories are characterized as subsystem elements. As you can see in Table 1, medium
percent cost of site and foundation is 17.3. For this reason, soil investigation should carefully
be carried out for the wind energy systems.
2. Soil investigation procedures for wind energy systems
Site investigation is part of the design process (Day, 2006). A foundation is defined as that
part of the structure that supports the weight of the structure and transmits the load to
underlying soil or rock. The purpose of the site investigation is to obtain the following
(Tomlinson, 1995):
Knowledge of the general topography of the site as it affects foundation design and
construction, e.g., surface configuration, adjacent property, the presence of
watercourses, ponds, hedges, trees, rock outcrops, etc., and the available access for
construction vehicles and materials.
The location of buried utilities such as electric power and telephone cables, water
mains, and sewers.
Wind Farm – Technical Regulations, Potential Estimation and Siting Assessment
192
The general geology of the area, with particular reference to the main geologic
formations underlying the site and the possibility of subsidence from mineral extraction
or other causes.
The previous history and use of the site, including information on any defects or
failures of existing or former buildings attributable to foundation conditions.
Any special features such as the possibility of earthquakes or climate factors such as
flooding, seasonal swelling and shrinkage, permafrost, and soil erosion.
The availability and quality of local construction materials such as concrete aggregates,
building and road stone, and water for construction purposes.
For maritime or river structures, information on tidal ranges and river levels, velocity of
tidal and river currents, and other hydrographic and meteorological data.
A detailed record of the soil and rock strata and groundwater conditions within the
zones affected by foundation bearing pressures and construction operations, or of any
deeper strata affecting the site conditions in any way.
Results of laboratory tests on soil and rock samples appropriate to the particular
foundation design or construction problems.
Results of chemical analyses on soil or groundwater to determine possible deleterious
effects of foundation structures.
Component Percent of Total System Cost
Medium Percent
Cost
Rotor blades 3 to 11.2 7.1
Gear box and generator 13.4 to 35.4 24.4
Hub, nacelle and shaft 5.3 to 3. 5 18.4
Control system elements 4.2 to 10.2 7.2
Tower 5.3 to 31.1 18.2
Site and foundation 8.4 to 26.2 17.3
Miscellaneous engineering 3.2 to 11.4 7.3
Table 1. Estimated Procurement Costs of Critical Components of Wind Turbines (Jha, 2010)
An approach for organizing a site investigation assessment is given In Table 2. Geotechnical
site characterization requires a full 3-D representation of stratigraphy (including variability),
estimates of geotechnical parameters and hydrogeological conditions and properties
(Campanella, 2008).
The natural materials that constitute the earth’s crust are rather arbitrarily divided by
engineers into two categories, soil and rock. Soil is a natural aggregate of mineral grains that
can be separated by such gentle mechanical means as agitation in water (Terzaghi and Peck,
1967). in a dynamic sense, seismic waves generated at the source of an earthquake
propagate through different soil horizons until they reach the surface at a specific site. The
travel paths of these seismic waves in the uppermost soil layers strongly affect their
characteristics, producing different effects on earthquake motion at the ground surface.
Local amplification caused by surficial soft soils is a significant factor in destructive
earthquake motion. Frequently, site conditions determine the types of damage from
moderate to large earthquakes (Bard, 1998; Pitikalis, 2004; Safak, 2001).
Geotechnical and Geophysical Studies for Wind Farms in Earthquake Prone Areas
193
Site Investigation Ground Investigation Records and reports
Planning Administration Preliminary Feasibility
Priliminary
Assesment
Planned
Strategy and
programme
contingency
proposals
Desk Study
Reconnainces Main study
Geotechnical
Evaluation
Constraints Profiling
Procurement
Method
Material and
Groundwater
characteristics
Field data
Presentation
Design
Foundation
Design
Assesment
Specialised
Studies
Geophysics as per code
Development of
Investigation
Strategy
Dynamic and
static probes
Factual /
Intraprative
Report
Programme of
Site Activity
Presurmenters
Dilatometers
Hydrographic
Table 2. Planning and Design of Site Investigations (Head, 1986)
The design of a foundation, an earth dam, or a retaining wall cannot be made intelligently
unless the designer has at least a reasonably accurate conception of the physical properties
of the soils involved. The field and laboratory investigations required to obtain this essential
information constitute soil exploration (Ozcep, 2010). There are several soil problems at local
and regional scale related to the civil engineering structures (Ozcep, F. and Zarif, H., 2009;
Ozcep, et al 2009;2010a, b, c Korkmaz and Ozcep, 2010).
2.1 Subsurface exploration
In order to obtain the detailed record of the soil/rock media and groundwater conditions at
the site, subsurface exploration is usually required. Types of subsurface exploration are the
borings, test pits, and trenches. Many different types of samplers are used to retrieve soil
and rock specimens from the borings. Common examples show three types of samplers, the
‘‘California Sampler,’’ Shelby tube sampler, and Standard Penetration Test (SPT) sampler
(Day, 2006).
Wind Farm – Technical Regulations, Potential Estimation and Siting Assessment
194
2.2 Field testing
There are many different types of tests that can be performed at the time of drilling and/or
project site. The three types of field tests are most commonly used geotechnical practice:
Standard Penetration Test (SPT), Cone Penetration Test (CPT) and Geophysical Tests.
2.2.1 Standard Penetration Test (SPT)
The Standard Penetration Test (SPT) consists of driving a thick-walled sampler into a sand
deposit. The measured SPT N value can be influenced by many testing factors and soil
conditions. For example, gravel-size particles increase the driving resistance (hence
increased N value) by becoming stuck in the SPT sampler tip or barrel. Another factor that
could influence the measured SPT N value is groundwater (Day, 2006).
2.2.2 Cone Penetration Test (CPT)
The idea for the Cone Penetration Test (CPT) is similar to that for the Standard Penetration
Test, except that instead of a thickwalled sampler being driven into the soil, a steel cone is
pushed into the soil. There are many different types of cone penetration devices, such as the
mechanical cone, mechanical-friction cone, electric cone, seismic and piezocone (Day, 2006).
2.2.3 Geophysical tests
Broadly speaking, geophysical surveys are used in one of two roles. Firstly, to aid a rapid
and economical choice between a number of alternative sites for a proposed project, prior to
detailed design investigation and, secondly, as part of the detailed site assessment at the
chosen location. Geophysical methods also have a major role to play in resource assessment
and the determination of engineering parameters. The recently issued British Code of
Practice for Site Investigations (BS 5930:1999) sets out four primary applications for
engineering geophysical methods:
1. Geological investigations: geophysical methods have a major role to play in mapping
stratigraphy, determining the thickness of superficial deposits and the depth to
engineering rockhead, establishing weathering profiles, and the study of particular
erosional and structural features (e.g. location of buried channels, faults, dykes, etc.).
2. Resources assessment: location of aquifers and determination of water quality;
exploration of sand and gravel deposits, and rock for aggregate; identification of clay
deposits.
3. Determination of engineering parameters: such as dynamic elastic moduli needed to
solve many soil-structure interaction problems; soil corrosivity for pipeline protection
studies; rock rippability and rock quality.
4. Detection of voids and buried artefacts: e.g. mineshafts, natural cavities, old
foundations, pipelines, wrecks at sea etc.
2.2.3.1 Seismic tests
Seismic tests are conventionally classified into borehole (invasive) and surface (noninvasive)
methods. They are based on the propagation of body waves [compressional (P) and/or
shear (S)] and surface waves [Rayleigh (R)], which are associated to very small strain levels
(i.e. less than 0.001 %) (Woods, 1978). Seismic surveys provide two types of information on
the rock or soil mass (McCann et al, 1997):
Geotechnical and Geophysical Studies for Wind Farms in Earthquake Prone Areas
195
Seismic refraction and reflection surveys may be carried out to investigate the
continuity of geological strata over the site and the location of major discontinuities,
such as fault zones.
From measurements of the compressional and shear wave velocities it is possible to
determine the dynamic elastic moduli of the soil/rock mass and estimate its degree of
fracturing
2.2.3.2 Electrical resistivity measurements
Electrical depth soundings are effective in horizontal stratified media, since the spatial
distribution of the electrical current in the ground and, hence, the depth of investigation
depends on the configuration of the array and the spacing of the electrodes. When using a
Standard Wenner or Schlumberger array the depth of investigation increases with the
current electrode spacing and this gives rise to an electrical resistivity depth section which
can be related to the geological structure beneath the survey line (McCann et al , 1997).
2.3 Laboratory testing
In addition to document review, subsurface exploration and filed tests, laboratory testing is
an important part of the site investigation. The laboratory testing usually begins once the
subsurface exploration and tests is complete. The first step in the laboratory testing is to log
in all of the materials (soil, rock, or groundwater) recovered from the subsurface
exploration. Then the engineer prepares a laboratory testing program, which basically
consists of assigning specific laboratory tests for the soil specimens (Day, 2006).
2.3.1 Index tests
Index tests are the most basic types of laboratory tests performed on soil samples.Index tests
include the water content (also known as moisture content), specific gravity tests, unit
weight determinations, and particle size distributions and Atterberg limits, which are used
to classify the soil (Day, 2006).
2.3.2 Soil classification tests
The purpose of soil classification is to provide the geotechnical engineer with a way to
predict the behavior of the soil for engineering projects (Day, 2006).
2.3.3 Shear strength tests
The shear strength of a soil is a basic geotechnical parameter and is required for the analysis
of foundations, earthwork, and slope stability problems (Day, 2006).
3. On geophysical and geotechnical parameters based on site-specific soil
investigations
A geotechnical study (i.e site-specific soil investigation) must be carried out for all “Wind
Farm” projects. All geotechnical designs must be based on a sufficient number of borings,
geophysical and geotechnical tests. At each foundation of Wind Energy System (WES),
integrated use of one borehole, geophysical and geotechnical tests is strongly recommended.
If some sites vary in soil features, different number of suitable boreholes is made on the
edges of the proposed foundation, based on discussions and meetings with the
Wind Farm – Technical Regulations, Potential Estimation and Siting Assessment
196
geotechnical/geophysical/geological engineers according to the local soil characteristics.
Related to the static and dynamic loads, the parameters and problems such as foundation
bearing capacity, settlement, stiffness, possible degradation, soil liquefaction and
amplification must be investigated in detail.
There are an interaction between tower stiffness, foundation stiffness and soil stiffness, and
these are formed total stiffness of Wind Energy System (WES).
Engineer requires to calculate static and dynamic coefficients of compressibility by using the
soil dynamic properties such as:
- · Gd [MN/m²] - dynamic shear modulus
- · [kg/m³] - soil density [t/m³]; the moist density of natural soil, in case of water
saturation including the water filling the pore volume, is introduced as density
- · [] - Poisson’s ratio.
The dynamic properties of the soil material are obtained by using geophysical testing. These
geophysical (spectral analysis of surface waves, seismic CPT, down-hole, seismic cross-hole
seismic refraction and reflection, suspension logging, steady-state vibration) tests are based
on the low-strain tests. It does not represent the non-linear or non-elastic stress strain
behavior of soil materials. These studies must be performed by a qualified geophysical
engineer or geophysicists.
The sampling intervals of SPT (standard penetration test) should not be in excess of 1 to
1.5m. CPT (cone penetration testing tests) is recommended, because they continuously give
the soil properties with depth. All soil layers that influence foundation of project must be
investigated.
3.1 Soil settlement criteria
The settlement analysis is taken in to consideration as immediate elastic settlements (primer)
and time-dependent consolidation (secondary) settlements. For the tower, a foundation
inclination has 3mm/m permissible value after settlement. In the case of the dynamic
analysis of the machine, it should be considered additional rotations of the tower base
during power production.
The completely vertical long-term settlement due only to the gravity weights is less than
20mm in any case. This situation should be verified by Geotechnical Engineer.
The safety factor for failure of the soil material (soil shear failure) should be min.3.
3.2 Stiffness requirements
Wind Energy Structures (WES) are subject to strong dynamic stresses. Dynamic system
properties, i.e. in particular the natural frequencies of the overall system consisting of the
foundation, tower, machine and rotor, are therefore of particular importance for load
determination.
The foundation structures in interaction with the foundation soil, is modeled by
approximation using equivalent springs (torsion and linear springs). Figure 1 provides a
comparison between wind turbine generator system and the simplified analysis model. Each
model parameter is dependent on soil properties.
Over its design lifetime, the foundation of wind energy structure must provide the
minimum levels of stiffness required in the foundation loads. The rotation of the foundation
(and resulting maximum permissible vertical settlement of the foundation soil) under the
operational forces is limited to be less than the values of rotational stiffness.
Geotechnical and Geophysical Studies for Wind Farms in Earthquake Prone Areas
197
3.3 Ground water and dewatering requirements
The two properties of a rock or soil which are most important in controlling the behaviour
of subsurface water are (a) how much water the rock or soil can hold in empty spaces within
it, and (b) how easily and rapidly the water can flow through and out of it (McLean and
Gribble, 1985).
For all required foundation excavation depths, ground water table level shall be considered.
Excavation dewatering due to high ground water levels, presence of water bearing strata or
impermeable materials (rock, clays, etc.) must be considered as required by specific site
conditions.
Fig. 1. Wind energy system and the analysis model.
3.4 Design of wind energy systems to withstand earthquakes
Earthquakes impose additional loads on to wind energy systems. The earthquake loading is
of short duration, cyclic and involves motion in the horizontal and vertical directions.
Wind energy system (The tower and foundation) need to withstand earthquake forces.
Earthquakes can affect these systems by causing any of the following:
Soil settlement and cracking
Liquefaction or loss of shear strength due to increase in pore pressures induced by the
earthquake in systems and its foundations;
Differential movements on faults passing through the foundation
Wind Farm – Technical Regulations, Potential Estimation and Siting Assessment
198
Soil amplification
Soil bearing capacity reduction
The potential for such problems depend on:
- The seismicity of the project area
- Soil / rock materials and topographic conditions at the site;
- The type and detailed construction of the wind energy system;
- The groundwater level in the wind energy system at the time of the earthquake.
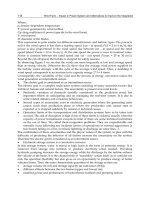
As shown in Figure 2, the focal distance from an earthquake to a point on the earth’s surface
is the three dimensional slant distance from the focus to the point, while the epicentral
distance is the horizontal distance from the epicentre to the point. Possible earthquake
magnitude and these factors (epicentral distance, focal dept and focal distance) are related to
the ground motion level at the project site.
Fig. 2. The focal distance from an earthquake to a point on the earth’s surface.
3.4.1 Evaluation of seismic hazard
For a given project site, a seismic hazard evaluation is to identify the seismic sources on
which future earthquakes are likely to occur, to estimate the magnitudes and frequency of
occurrence of earthquakes on each seismic source, and to identify the distance and
orientation of each seismic source in relation to the site. When the deterministic approach is
used to characterize the ground motions for project site, then a scenario earthquake is
usually used to represent the seismic hazard, and its frequency of occurrence does not
directly influence the level of the hazard. In the other hand, when the probabilistic approach
is used, then the ground motions from a large number of possible earthquakes are
considered and their frequencies of occurrence are key parameters in the analysis
(Somerville and Moriwaki, 2003).
3.4.1.1 Probabilistic approach
Given the uncertainty in the timing, location, and magnitude of future earthquakes, and the
uncertainty in the level of the ground motion that a specified earthquake will generate at a
Geotechnical and Geophysical Studies for Wind Farms in Earthquake Prone Areas
199
particular site, it is often appropriate to use a probabilistic approach to characterizing the
ground motion that a given site will experience in the future (Somerville and Moriwaki,
2003).
The probabilistic estimation of ground motion requires the following seismicity information
about the surrounding area:
The rate of occurrence and magnitude of earthquakes;
The relative proportion of small to large events (b value);
The maximum earthquake size expected
The spatial distribution of earthquake epicenters including delineation of faults
3.4.1.2 Seismic hazard from known active faults: deterministic approach
This method is used where faults in the vicinity of the wind farm can be identified. The
procedure will usually include:
Identification of major faults within the vicinity of the wind farm.
Assessment of whether the faults are active or potentially active, by consideration of
whether modern (including small) earthquakes have been recorded along the fault.
Assessment of the maximum earthquake magnitude on each identified fault. This will
usually be determined by considering the length and/or area of the fault and the type
of fault. The likely focal depth and, hence, focal distance are also estimated.
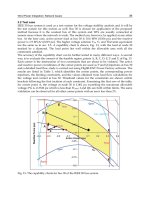
3.4.1.3 Selection of design seismic loading
There are two ways of selecting the design seismic loading: deterministic and probabilistic.
Whichever approach is taken, the bedrock ground motions need to be adjusted where
appropriate for amplification (or de-amplification) effects. The probabilistic approach to
seismic hazard characterization is very compatible with current trends in earthquake
engineering and the development of building codes. Examples of conceptual frameworks
are given in Figure 3.
Fig. 3. Seismic performance objectives for buildings (SEAOC, 1996), showing increasingly
undesirable performance characteristics from left to right on the horizontal axis and
increasing level of ground motion from top to bottom on the vertical axis. Performance
objectives for three categories of structures are shown by the diagonal lines (Hall et all,
1995).
Wind Farm – Technical Regulations, Potential Estimation and Siting Assessment
200
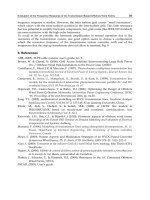
4. Bahce (Osmaniye, Turkey) case for wind energy systems
(from Ozcep et al, 2010)
4.1 Introduction
Geological observations, geophysical measurements, soil explorations, in-situ tests and
laboratory tests have been performed over the study area. This survey has been realized in
order to be able to decide basic systems in an element, which is one of the turbine locations
of Wind Power Plant (135 MW) that is planned to be constructed in Bahçe county of
Osmaniye province and in order to be used as a basis for the superstructure loads to be
transferred to the soil in detail. Presentation of the location map of the site with several
cities and main seismogenetic fault described in Figure 4.1a.
Fig. 4.1a. Presentation of the location map of the site with several cities and main
seismogenetic fault
4.1.1 Geological framework
From the structural point of view; Amanos Mountain is located over the intersections of the
tectonic zones or within the impact area of these zones which are well known world wide.
At Nur Mountain, characteristic folding and faulting properties are being observed.
Overturned, overthrust and canted folding in different scales are observed. Spring water
Geotechnical and Geophysical Studies for Wind Farms in Earthquake Prone Areas
201
and percolating water are becoming dense in the western part and are being observed over
discontinuity zones depending on the structural geology. These springs and percolations
have resulted important amount of decomposition over the main rock. The engineering
properties of the geological units differ from one region to another depending on the
structure and hydro-geology and types of rocks. Study area is near the Eastern Anatolia
Fault zone which is strike slip fault zone. Eastern Anatolia Fault has not been formed of only
one single fault but has been formed of as a complex fault system or zone.
4.1.2 Seismic hazard analysis of region
Seismic hazard analyses aim at assessing the probability that the ground motion parameter
at a site due to the earthquakes from potential seismic sources will exceed a certain value in
a given time period (Erdik et al, 1999, Erdik and Durukal, 2004). Deterministic and
Probabilistic approaches are used in developing ground motions in professional practice.
The deterministic approach is based on selected scenario earthquakes and specified ground
motion probability level, which is usually median ground motion or median-plus-one
standard deviation. The probabilistic approach encompasses all possible earthquake
scenarios, all ground motion probabilities and computes the probability of the ground
motion to be experienced at the site exceeding a certain value in a given time period.
Empirical attenuation relationships are generally employed in the quantification of seismic
hazard in either deterministic or probabilistic approaches (Seismic Microzonation for
Municipalities: Manual, 2004).
For deterministic seismic hazard analysis, two fault model are selected namely A (fault
rapture is 50 km) and B faults (fault rapture is 245 km) within east Anatolian fault Zone
(Table 4.1.1a and 4.1.1b).
Researcher M (magnitude) Magnitude Type
Ambraseys and Zatopek (1969) M= (0,881 LOG(L))+5,62 Ms
Douglas and Ryall (1975) M= (LOG(L)+4,673)/0,9 Ms
Ezen (1981) M=(LOG(L)+2,19)/0,577 Ms
Toksöz et al (1979) M=(LOG(L)+3,62)/0,78 Ms
Wells and Coppersmith (1994) M=5,16+(1,12 LOG(L)) Mw
Table 4.1.1a. Equations for Rapture Length and Magnitude Estimations
Wind Farm – Technical Regulations, Potential Estimation and Siting Assessment
202
Researchers
M (magnitude)
Estimations For A
Model
M (magnitude)
Estimations For B Model
Ambraseys and Zatopek (1969) 7,1 7,5
Douglas and Ryall (1975) 7,1 7,6
Ezen (1981) 6,7 7,5
Toksöz et al (1978) 6,8 7,4
Wells and Coppersmith (1994) 7,1 7,6
Table 4.1.1b. Selected two fault model (A : fault rapture length is 50 km) and B : fault rapture
length is 245 km) within East Anatolian Fault Zone.
Earthquake ranges for analysis were taken from 4.5 to 7.5 about 100 km radius (Table 1c)
Gutenberg-Richter recurrence relationships was determined as
Log(N) = a – b M (1)
Earthquake occurrence probability were given by using
Rm = 1- e
- (N(M) . D)
Where Rm = Risk value (%); D, duration; N(M) for M magnitude (1) equation value.
Magnitude
Ranges
4.5≤ M <5.0
5.0 ≤ M < 5.5
5.5 ≤M <6.0
Number of
Earthquakes
34 9 6
Table 4.1.1c. Earthquake Magnitude ranges in study area about 100 km radius. Data are
obtained by BU KOERI, compiled by Kalafat et al, 2007)
Attenuation relationship was defined by several attenuation models (see Table 4.1.2a). From
a set of attenuation relationships, the average acceleration values of the cities was calculated
with exceeding probability of 10 % in 50 years by using several attenuation models as
shown in Table 4.1.2b and c.
Geotechnical and Geophysical Studies for Wind Farms in Earthquake Prone Areas
203
a = Acceleration Value (cm/sn
2
)
PHA = Pick Horizontal Acceleration
M = Earthquake Magnitude
D = Epicentral Distance (km)
R = Radial Distance from Focal depth (km)
Researchers
.a = 1300 e
0.67M
(R + 25)
-1.6
Donovan (1973)
.log a = 3.09 + 0.347 M – 2 log (R + 25) Oliviera (1974)
log (a/g) = -1.02 + 0.249 M – log R –0.00255 R + 0.26
where; R = (D
2
+ 7.3
2
)
0.5
Joyner and Boore (1981)
ln (a
H
)= (-3,512+0,904M-1,328 ln [(R
seis
2
)+(0,149 e
0,67M
)
2
]
0,5
+ (0,44-(0,171 ln(R
seis
))+(0,405-(0,222 ln(R
seis
)))
where, M is moment magnitude; R
seis
is shortest distance
to seismogenetic fault
Campbel (1997)
Table 4.1.2a. Used Acceleration Attenuation Relationships in this Study
Figure 4.1.1b. shows active fault zones, earthquakes in historical and instrumental periods
near study area. Seismic hazard analysis for the region are carried out on the earthquakes
bigger than 4.5 for 106 years of period.
Fig. 4.1.1b. Active fault zones, earthquakes (M larger than 5.5) in Historical and Instrumental
time intervals around the Study Area (a quadrangle) (map is redrawn by Erdik et al, 1999)
Poisson probabilistic approach is applied to earthquake data. Table 2b. shows earthquake
probability (%) for selected year by Poison distribution in the study area, and Table 2c
shows ground motion level at the site exceeding (%10) in a given time period (50 years).
Wind Farm – Technical Regulations, Potential Estimation and Siting Assessment
204
Probability (%) For D (Year)
Average
Return Period
(Years)
Magnitude 10 50 75 100
5 90,5 100,0 100,0 100,0 4
5,5 56,1 98,4 99,8 100,0 12
6 25,0 76,3 88,5 94,4 34
6,5 9,6 39,6 53,1 63,5 98
7 3,5 16,2 23,3 29,7 281
7,5 1,2 6,0 8,8 11,6 802
Table 4.1.2b. Earthquake Occurrence Probability (%) for D (Year) by Poison distribution in
the Study Area
D (year)
Probability of
Exceedence (%)
M (magnitude)
for 50 10 7,2
∆, Epicentral
Distance (km)
H, Focal depth
(km)
for 25 15
Donavan
(1973)
Oliviera (1974)
Joyner and
Boore (1981)
Campbell (1997)
Estimated a
(g)
0,26 0,19 0,59 0,45
Table 4.1.2c. Ground motion probabilities show the probability of the ground motion to be
experienced at the site exceeding (10%) in a given time period (50 years).
4.3 Site investigations
4.3.1 Test pits
Information has been obtained from observation purpose superficial excavations and in the
laboratory evaluations, drilling samples have been used.
4.3.2 Drilling wells
As a result of the observations and analysis performed over the survey area and near
environment, it has been planned and realized 2 drilling (SK-1 on the middle of the base,
SK-2 at the edge of the base) wells with 30 meter over the area at which the construction
base will be settled (Table 4.3a).
Geotechnical and Geophysical Studies for Wind Farms in Earthquake Prone Areas
205
Borhole Depth (m) LITHOLOGY
SK-1
0,00 – 7,50
gray colored, faulted and fractured, melted cellular from
place to place limestone with rarely calcite filled faults,
calcite grained, with brown colored decomposition
surfaces
7,50 – 30,00
gray colored, melted cellular limestone with brown
colored decomposition surfaces, calcite grained from
place to place, fractured, medium sometimes thick
layered
SK-2
0,00 – 7,50
gray colored, faulted and fractured, melted cellular from
place to place limestone with rarely calcite filled faults,
calcite grained, with brown colored decomposition
surfaces
7,50 – 30,00
gray colored, melted cellular limestone with brown
colored decomposition surfaces, calcite grained from
place to place, fractured, medium sometimes thick
layered
Table 4.3a. Lithology according to the drilling results
4.3.3 Surface and ground water
There is no ground or superficial water danger which could affect the basic systems of the
turbine planned to be constructed over the survey area. However, the contact and
interaction of the superficial water and standing water which can accumulate during and
after the construction of the foundations of the turbine as a result of the seasonal
precipitations should be prevented.
4.3.4 Field tests
4.3.4.1 SPT tests and core evaluations
Since the survey area is formed by rock units even from the surface (not suitable for SPT
experiment), core samples obtained from drillings have been evaluated.
4.3.4.2 Geophysical tests
A. Seismic tests
In the seismic studies which have been performed over the soil of the survey area, mainly
seismic refraction method which is used in direct and reverse shooting has been applied.
Seismic measurements have been made by measuring both longitudinal (or compressional),
Vp and also transversal (or shear), Vs wave velocities. Vp has been measured in order to
determine the underground structural locations in horizontal and lateral directions, Vs has
been measured in order to know the elastic properties. Geophone intervals in seismic
measurements have been selected as 2 m. Table 3b shows geotechnical parameters obtained
by seismic tests.
Wind Farm – Technical Regulations, Potential Estimation and Siting Assessment
206
Vp Velocity (m/s)
Vs Velocity (m/s)
Vp/Vs
Density (gr/cm3)
Poison Rate
Shear Module (Kgf/cm²)
Dyn. Ela. Mod. (Young)
(Kgf/cm²)
Soil Amplifications
(Borcherdt et al 1991)
Soil Preddminant Period To
(s)
1811 834 2,17 2,1 0,37 14.922 40.750 0,7 0,16
1835 791 2,32 2,1 0,39 13.419 37.195 0,8 0,17
Table 4.3.b. Average geotechnical parameters obtained by seismic tests
B. Electric resistivity applications
In the resistivity studies which are made in order to clarify the lithological structure of the
soil of the survey area, SAS (signal Average System) resistivity measurement system has
been used. Soil resistivity is being changed depending on the grain size, water content,
porosity and permeability. At the survey area, the variation of the apparent resistivity with
the depth has been analyzed by applying Vertical Electric Drilling, in the Schlumberger
permutation technique with 2 AB/2 = 40 m expansion and so the structural disorder, depth,
lithology, thickness of layers, underground water capacity, corrosion degree which is
especially important in the structuring have been analyzed by using the resistivity
differences (Table 4.3c).
Resistivity Value Corrosion Degree
Resistivity < 10 ohm.m More Corrosive
10 < Resistivity < 30 ohm.m Corrosive
30 < Resistivity < 100 ohm.m Medium Corrosive
100 ohm.m < Resistivity Not Corrosive
Table 4.3c. Soil Resistivity and Corrosion Level According to Turkish Standards
The results of the measurements obtained in survey area and the soil curves formed by the
apparent resistivity values which are varied according to the depth have been evaluated
manually and by using computer. The resistivity values of the survey area are as follows
(Table 4.3.d).
Geotechnical and Geophysical Studies for Wind Farms in Earthquake Prone Areas
207
Resistivity Values of the units in survey area
Unit Thickness(m) Resistivity (Ohm.m)
First Layer 7-8 345-360 Ohm.m
Second Layer 50 1083-1217 Ohm.m
Table 4.3d. Resistivity Values of the units in survey area
4.4 Laboratory tests and analysis
Index / Physical Properties of the Soil / Rock
The tests which are complying with the R.T. Ministry of Public Works norms and TS1900
have been performed over the soil / rock core samples which have been taken from the
boreholes that had been drilled during field surveys.
4.5 Engineering analysis and evaluations
4.5.1 Determination of soil -structure relation
a. Foundation System
Required laboratory studies have been made over the observations, soil excavations,
geophysical applications about the mentioned foundation soil which has been analyzed
regarding geotechnical perspective and the obtained parameters have been specified in the
above sections.
The planned structures (wind towers) are high towers having rigid bearing systems. Raft
foundation will be a proper foundation solution for this project since this kind of a
foundation will provide safety against differential settlements, will protect the integrity of
the bearing system under the earthquake loads and dynamic wind load, as well as static
loads.
b. Bearing Capacity
Allowable bearing capacity calculations regarding the related parameters about either soil /
rock or structure have been made separately in different approaches by taking into account
land data, laboratory experiment results and drilling core observations and Rock Quality
Designation (RQD) values. The rock and soil formations of the environment have been
taken into account in the selection of the calculation methods. At the soil / rock locations
which are not convenient to provide samples proper for the experiments required for the
method (especially in rock tri-axial experiment required for the Bell method), values which
have been obtained from the other locations of the same unit or the known technical
literature values have been taken into account.
c. Settlements
Even it is not expected to occur the Settlements which exceeds the acceptable limits under
the load to the soil as a result of the structuring over this soil of which most parts that the
structure foundation will be based are clay, silt the Settlements value of the medium which
has been calculated according to the elasticity module (dynamic) and Poisson ratio values.
Special attention should be given not to place the foundation over the excessive splitted,
weak durable or decomposed units except the survey points during the foundation
excavation and not to place the foundation over differentiated units. Before the construction
Wind Farm – Technical Regulations, Potential Estimation and Siting Assessment
208
and after the excavation, and during and after the construction, it is required to protect the
foundation area from the superficial waters and rains and adequate discharging system
should be designed.
d. Liquefaction
There is no ground water danger in a depth up to 20 meters which can negatively affect the
foundation structure over the survey area.
e. Soil Class and Other Parameters
The soil of the survey area is rock formed of faulted, fractured, layered limestone units, Vs
shear wave velocity (if the thin layer in the surface is ignored) which has been obtained from
the Geophysical – Seismic studies has been measured in between 791-834 m/s. According to
the Turkish Earthquake Code, these velocities correspond to Soil Group (A), Local Soil Class
(Z1) but since these units are fractured and have frequent discontinuity intervals, it is better
to classify them as B group Z2 soil class. A little bit more clarification explaining the
difference between both classes is given Table 4.5.1 and 4.5.2. Spectrum characteristic
periods which are regarded according to the selected foundation type TA and TB are
respectively 0,10-0,40 (s). Soil dominant vibration period has been calculated as 0,16 sec.
Soil Group
Shear
Wave
Velocity
(m/s)
(A)
> 700
(B)
400─700
Table 4.5.2. Soil Groups according to Turkish Earthquake Design Code
Local Site
Class
Soil Group
according to Table
6 and
Topmost Layer
Thickness (h1
Spectrum Characteristic
Periods ( TA , TB)
Z1
Group (A) soils
Group (B) soils
with h1 ≤ 15 m
Between 0.10 and 0.30 s
Z2
Group (B) soils
with h1 > 15 m
Group (C) soils
with h1 ≤ 15 m
Between 0.15 and 0.40 s
Table 4.5.3. Local Site Class and Spectrum Characteristic Periods ( TA , TB) According To
Turkish Earthquake Design Code