Clean Energy Systems and Experiences Part 10 doc
Bạn đang xem bản rút gọn của tài liệu. Xem và tải ngay bản đầy đủ của tài liệu tại đây (1.57 MB, 15 trang )
Clean Energy Systems and Experiences128
11. References
Bayazitoglu, Y. (1986). Solar Energy Utilization, NATO ASI Series, Edited by Yuncu, H.,
Paykoc, E., Yener, Y., Series E: Applied Sciences, No 129.
Dincer, I. (2007). Exergetic and sustainability aspects of green energy systems. Clean, 35, (4),
pp. 311-322.
Dincer, I. & Rosen, M.A. (1998). A worldwide perspective on energy, environment and
sustainable development. Int. J. Energy Res. 22, pp. 1305–1321.
Duffie, J. A. & Beckman, W. A. (1991). Solar Engineering of Thermal Processes, John
Wiley&Sons, Inc.
Eskin, N. (1999). Transient performance analysis of cylindrical parabolic concentrating
collectors and comparison with experimental results. Energy conversion and
management, 40, pp. 175-191.
Goswami, D. Y., Kreith, F. & Kreider, J. (1999). Principles of Solar Engineering. Taylor and
Francis, New York.
Haught, A. P., (1984). Physical consideration of solar energy conversion. ASME journal of
solar energy engineering. 106, pp. 3-15.
Hong-lei, L.; Ming-jun, J.; Wei-cheng, P.; Wen-xiang,Z. & Da-zhen, J. (2006). Copper
Promoted AdZnO-CuO Catalysts for Low Temperature Water-gas Shift Reaction.
Chem. Res. Chinese, 22(1), pp 99-102.
Hua., N.; Wang, H.; Du, Y.; Shen, M. & Yang, P. (2005). Ultrafine Ru and γ-Fe
2
O
3
particles
supported on MgAl
2
O
4
spinel for water-gas shift reactions. Catalysis
Communications, 6, pp. 491-496.
International Energy Agency (IEA), (2004). World Energy Outlook 2004
Kalogirou, S. A. (1997). Survey of solar desalination systems and system selection. Energy,
22, pp. 69-81.
Kodama, T. (2003). High-temperature solar chemistry for converting solar heat to chemical
fuels. Progress in energy and combustion science. 29, pp. 567-597.
Kotas, T. J. (1985). The exergy method of thermal plant analysis. Printed and bound in Great
Britain by Anchor Brendon Ltd.
Kreider, J.F. & Kreith, F. (1975). Solar Heating and Cooling Engineering, Practical Design and
Economics, Hemisphere Publishing Corporation, Washington, D.C.
Magal, B. S. (1994). Solar power engineering. Tata McGraw-Hill.
Mills, D. (2004). Advances in solar thermal electricity technology. Solar Energy, 76, 19-31.
Moran, M. J. (1989). Availability Analysis, ASME Press, New York.
Newsome, D. S. (1980). The water-gas shift reaction. Catal. Rev. Sci. Eng., 21 (2), pp. 275-381.
Petela, R. (2005). Exergy analysis of the solar cylindrical-parabolic cooker. Solar energy, 79,
pp. 221-233.
Price, H.; Lupfert, E.; Kearney, D.; Zarza E.; Cohen, G., Gee, R.; & Mahoney, R. M. (2002).
Advances in parabolic trough solar power technology. Journal of Solar Energy
Engineering, 124, (2), pp. 109–125.
Saying, A. A. M. (1979). Solar Energy Application in Buildings. Academic Press, New York.
Singh, N.; Kaushik, S. C. & Misra, R. D., (2000). Exergetic analysis of a solar thermal power
system. Renewable energy, 19, pp. 135-143.
Sorensen, B. (2004). Renewable energy: It’s physics, engineering, use, environmental impacts,
economy and planning aspects, 3rd edition. USA: Elsevier Inc.
Spalding, F.R.; Harald, W. & Stanford, M. (2005). Energy and the world summit on
sustainable development. Energy Policy. (33), pp. 99-102.
Tiwari, G. N. (2003). Solar Energy Fundamentals, Design, Modelling and Applications. Alpha
Science publication.
Trieb, F.; Lagniβ, O. & Klaiβ, H. (1997). Solar electricity generation - a comparative view of
technologies, costs and environmental impact. Solar Energy, 59, pp. 89-99.
You, Y. & Hu, E.J. (2002). A Medium-Temperature Solar Thermal Power System and Its
Efficiency Optimization. Applied Thermal Engineering, 22, pp. 357-364.
Exergy analysis of low and high temperature
water gas shift reactor with parabolic concentrating collector 129
11. References
Bayazitoglu, Y. (1986). Solar Energy Utilization, NATO ASI Series, Edited by Yuncu, H.,
Paykoc, E., Yener, Y., Series E: Applied Sciences, No 129.
Dincer, I. (2007). Exergetic and sustainability aspects of green energy systems. Clean, 35, (4),
pp. 311-322.
Dincer, I. & Rosen, M.A. (1998). A worldwide perspective on energy, environment and
sustainable development. Int. J. Energy Res. 22, pp. 1305–1321.
Duffie, J. A. & Beckman, W. A. (1991). Solar Engineering of Thermal Processes, John
Wiley&Sons, Inc.
Eskin, N. (1999). Transient performance analysis of cylindrical parabolic concentrating
collectors and comparison with experimental results. Energy conversion and
management, 40, pp. 175-191.
Goswami, D. Y., Kreith, F. & Kreider, J. (1999). Principles of Solar Engineering. Taylor and
Francis, New York.
Haught, A. P., (1984). Physical consideration of solar energy conversion. ASME journal of
solar energy engineering. 106, pp. 3-15.
Hong-lei, L.; Ming-jun, J.; Wei-cheng, P.; Wen-xiang,Z. & Da-zhen, J. (2006). Copper
Promoted AdZnO-CuO Catalysts for Low Temperature Water-gas Shift Reaction.
Chem. Res. Chinese, 22(1), pp 99-102.
Hua., N.; Wang, H.; Du, Y.; Shen, M. & Yang, P. (2005). Ultrafine Ru and γ-Fe
2
O
3
particles
supported on MgAl
2
O
4
spinel for water-gas shift reactions. Catalysis
Communications, 6, pp. 491-496.
International Energy Agency (IEA), (2004). World Energy Outlook 2004
Kalogirou, S. A. (1997). Survey of solar desalination systems and system selection. Energy,
22, pp. 69-81.
Kodama, T. (2003). High-temperature solar chemistry for converting solar heat to chemical
fuels. Progress in energy and combustion science. 29, pp. 567-597.
Kotas, T. J. (1985). The exergy method of thermal plant analysis. Printed and bound in Great
Britain by Anchor Brendon Ltd.
Kreider, J.F. & Kreith, F. (1975). Solar Heating and Cooling Engineering, Practical Design and
Economics, Hemisphere Publishing Corporation, Washington, D.C.
Magal, B. S. (1994). Solar power engineering. Tata McGraw-Hill.
Mills, D. (2004). Advances in solar thermal electricity technology. Solar Energy, 76, 19-31.
Moran, M. J. (1989). Availability Analysis, ASME Press, New York.
Newsome, D. S. (1980). The water-gas shift reaction. Catal. Rev. Sci. Eng., 21 (2), pp. 275-381.
Petela, R. (2005). Exergy analysis of the solar cylindrical-parabolic cooker. Solar energy, 79,
pp. 221-233.
Price, H.; Lupfert, E.; Kearney, D.; Zarza E.; Cohen, G., Gee, R.; & Mahoney, R. M. (2002).
Advances in parabolic trough solar power technology. Journal of Solar Energy
Engineering, 124, (2), pp. 109–125.
Saying, A. A. M. (1979). Solar Energy Application in Buildings. Academic Press, New York.
Singh, N.; Kaushik, S. C. & Misra, R. D., (2000). Exergetic analysis of a solar thermal power
system. Renewable energy, 19, pp. 135-143.
Sorensen, B. (2004). Renewable energy: It’s physics, engineering, use, environmental impacts,
economy and planning aspects, 3rd edition. USA: Elsevier Inc.
Spalding, F.R.; Harald, W. & Stanford, M. (2005). Energy and the world summit on
sustainable development. Energy Policy. (33), pp. 99-102.
Tiwari, G. N. (2003). Solar Energy Fundamentals, Design, Modelling and Applications. Alpha
Science publication.
Trieb, F.; Lagniβ, O. & Klaiβ, H. (1997). Solar electricity generation - a comparative view of
technologies, costs and environmental impact. Solar Energy, 59, pp. 89-99.
You, Y. & Hu, E.J. (2002). A Medium-Temperature Solar Thermal Power System and Its
Efficiency Optimization. Applied Thermal Engineering, 22, pp. 357-364.
Clean Energy Systems and Experiences130
Economic analysis of large-scale wind
energy conversion systems in central anatolian Turkey 131
Economic analysis of large-scale wind energy conversion systems in
central anatolian Turkey
Mustafa Serdar GENÇ
0
Economic analysis of large-scale wind energy
conversion systems in central anatolian Turkey
Mustafa Serdar GENÇ
Erciyes Üniversitesi, Mühendislik Fakültesi, Enerji Sistemleri Mühendisli
ˇ
gi Bölümü,
38039, Kayseri
Turkey
1. Introduction
A political, economical and technological development is influenced by social events in all
world. Increasing of industrial production and raising competitiveness is possible by devel-
opment of technology. Countries which fail to develop a technology will be difficult to survive
in the new world order and they will take place in the class of very populated, poor coun-
tries whose revenues do not increase. Today, the developing countries make research their
own energy sources, particularly renewable and clean energy sources and develops their own
technologies about energy conversion systems because of difficulties on energy in all over the
world.
Not only the converting most efficiently an energy source into useable energy but also it is
extremely important that this source is clean and sustainable energy. Clean and renewable
energies obtaining from sunlight, wind or water around the earth do not make a net contribu-
tion of carbon dioxide to the atmosphere. Therefore, these energy sources should be used to
protect our world, because of global warming and the injurious effects of carbon emissions.
Pressure and temperature differences occurring in the atmosphere because of solar energy,
and the earth’s rotation, and different forms of the earth’s surface create wind. People has
been used the wind for various purposes such as windmill, water pumping, etc. for centuries.
Not only wind energy can be used as mechanical power but also mechanical energy of the
wind through a generator can be converted into electrical energy. But, interest in wind energy
have always been tied to oil prices. In the 1970s, oil prices raised suddenly and both this
rising and the injurious effects of carbon emissions pushed people to seek alternative, clean
and renewable energy sources.
Due to the fact that wind energy is a fuel-free, inexhaustible, and pollution-free source, the
role of wind energy in electricity generation increased in the United States, Asia and Europe.
In the past 25 years, use of wind energy in U.S.A. increased, and the wind energy price was 80
cents/kWh in 1980 and this price decreased to 4 cents/kWh in 2002 (Kakac, 2006). Although
wind produces only about 1.5% of worldwide electricity use, it is growing rapidly, having
doubled in the three years between 2005 and 2009 (World Wind Energy Association, 2010).
In several countries it has a distribution, accounting for about 19% of electricity production
in Denmark, 10% in Spain and Portugal, and 7% in Germany and the Republic of Ireland in
2008. And Turkey is rather unsuccessful in using its potential and has 1002.35 MW installed
capacity (Electricity Market Regulatory Authority, 2010). Cumulative variation of installed
7
Clean Energy Systems and Experiences132
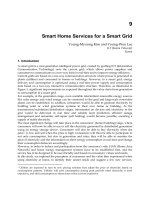
Installed power capacity in Turkey [MW]
0 150 300 450 600 750 900 1050 120
0
1998
1999
2000
2001
2002
2003
2004
2005
2006
2007
2008
2009
2010
Fig. 1. Cumulative variation of wind power installed in Turkey
wind power in Turkey is shown in Fig. 1(Electricity Market Regulatory Authority, 2010). It
is expected that the installed wind power capacity in Turkey will reach about 3500 MW up to
end of 2010 year.
Wind energy prices are based on local conditions and require to analyze for each country. The
characteristics and the distribution of wind speeds of a site have to be investigated in detail for
effective using this energy. When a wind energy conversion system will install in a site, many
factors such as the wind speed, wind power, the generator type have to be taken into account
and a feasibility study must be done. A lot of studies related to the wind characteristics and
wind power potential have been made in many countries worldwide by researchers such as
Rehman (2004), Ahmet Shata and Hanitsch (2006), Acker et. al (2007), Bagiorgas et al. (2007),
Bouzidi et al. (2009), Nouni et al. (2007), Chang and Tu (2007), Ngalaa et al. (2007), Zhou et al.
(2010) etc.
In Turkey, a lot of studies of the estimation of wind characteristics have been achieved by re-
searchers. Bilgili et al. (2004) and Sahin et al. (2005) investigated the wind power potential for
selected seven different sites (Antakya, Samandag, Karatas, Adana, Yumurtalýk, Dortyol and
Iskenderun) in the Southern Anatolia. Their results show that the contours of constant wind
speed and power potential could lead the private power developers to decide the locations of
appropriate wind farms. Bilgili and Sahin (2009), and Sahin and Bilgili (2009) studied wind
energy density in the southern and southwestern region of Turkey. The dominant wind direc-
tions, probability distributions, Weibull parameters, mean wind speeds, and power potentials
were determined according to the wind directions, years, seasons, months, and hours of day,
separately. It is obtained that these regions have a reasonable wind power potential and they
are suitable for planting wind energy turbines. In addition, according to authors Belen-Hatay
is the most promising and convenient site for production of electricity from wind power. Bil-
gili et al. (2010) and Bilgili and Sahin (2010) investigated statistically wind energy density
of Akhisar, Bababurnu, Belen, Datca, Foca, Gelendost, Gelibolu, Gokceada and Soke districts
which are located in the southern, southwestern and western region of Turkey. The Weibull
and Rayleigh probability density functions, and the Wind Atlas Analysis and Application
Program (WAsP) packet program were used to analyze the measured data collected by the
General Directorate of Electrical Power Resources Survey Administration. They concluded
that the Weibull probability density function and WAsP program provide better power den-
sity estimations than Rayleigh probability density function for all stations enjoying a reason-
able wind power potential. They found that Gokceada and Gelibolu were the most promising
and convenient sites to product the electricity from the wind energy. Furthermore, Bilgili and
Sahin (2010) presented the electric power plants in Turkey and, their capacities and resources
used in the electricity generation in order to update the electric energy statistics. The status of
thermal, hydro, wind, and geothermal power plants in Turkey was classified according to the
electricity utilities.
Kurban and Hocaoglu (2010) studied the possible wind energy potential in Eskisehir, Turkey
using the data collected in the observation station established at Iki Eylul Campus of Anadolu
University. And they (2010) investigated the wind statistics and energy calculations for Es-
kisehir region using the Wind Atlas Analysis and Application Program (WAsP) software.
They selected suitable sites to locate wind turbines optimally according to the created wind
power and wind speed maps. Eighteen different wind turbines with nominal powers between
200 and 2,000 kW are considered to product energy. Karsli and Gecit (2003) determined the
wind power potential of the Nurdagi/Gaziantep district located in the south of Turkey using
Weibull parameters of the wind speed distribution. Their results show that the district has a
mean wind speed of 7.3 m/s at 10m height and mean power density of 222 W/m2. Akpinar
and Akpinar (2004) evaluated the wind energy potential of Maden-Elazig in eastern Turkey
and obtained that the mean speed varies between 5 and 6 m/s and yearly mean power den-
sity is 244.65 W/m2. Kose (2004) and Kose et al. (2004) determined the possible wind energy
potential at the Dumlupinar University-Kutahya main campus using their own observation
station. Celik (2003) analyzed the wind energy potential of Iskenderun based on the Weibull
and the Rayleigh models using 1-year measured hourly time-series wind speed data.
It can be generated more power from wind energy by selection of wind farm site with suitable
wind electric generator and establishment of more number of wind stations. The selection
and installing of suitable wind electric generator to produce electrical energy economically in
the windy areas requires a number of activities that include the investigation of the source,
feasibility assessment etc. Ozerdem et al. (2006) carried out both technical and economical
feasibility study for a wind farm in Izmir-Turkey using three diverse scenarios for economical
evaluation. It was shown that the generating cost per kWh and internal rate of return value
for all three scenarios were promising. Celik (2007) analyzed economically suitable power
generation using wind turbines which have nominal power range form 0.6 to 500 kW. This
study showed that Iskenderun was amongst the possible wind energy generation regions,
Economic analysis of large-scale wind
energy conversion systems in central anatolian Turkey 133
Installed power capacity in Turkey [MW]
0 150 300 450 600 750 900 1050 120
0
1998
1999
2000
2001
2002
2003
2004
2005
2006
2007
2008
2009
2010
Fig. 1. Cumulative variation of wind power installed in Turkey
wind power in Turkey is shown in Fig. 1(Electricity Market Regulatory Authority, 2010). It
is expected that the installed wind power capacity in Turkey will reach about 3500 MW up to
end of 2010 year.
Wind energy prices are based on local conditions and require to analyze for each country. The
characteristics and the distribution of wind speeds of a site have to be investigated in detail for
effective using this energy. When a wind energy conversion system will install in a site, many
factors such as the wind speed, wind power, the generator type have to be taken into account
and a feasibility study must be done. A lot of studies related to the wind characteristics and
wind power potential have been made in many countries worldwide by researchers such as
Rehman (2004), Ahmet Shata and Hanitsch (2006), Acker et. al (2007), Bagiorgas et al. (2007),
Bouzidi et al. (2009), Nouni et al. (2007), Chang and Tu (2007), Ngalaa et al. (2007), Zhou et al.
(2010) etc.
In Turkey, a lot of studies of the estimation of wind characteristics have been achieved by re-
searchers. Bilgili et al. (2004) and Sahin et al. (2005) investigated the wind power potential for
selected seven different sites (Antakya, Samandag, Karatas, Adana, Yumurtalýk, Dortyol and
Iskenderun) in the Southern Anatolia. Their results show that the contours of constant wind
speed and power potential could lead the private power developers to decide the locations of
appropriate wind farms. Bilgili and Sahin (2009), and Sahin and Bilgili (2009) studied wind
energy density in the southern and southwestern region of Turkey. The dominant wind direc-
tions, probability distributions, Weibull parameters, mean wind speeds, and power potentials
were determined according to the wind directions, years, seasons, months, and hours of day,
separately. It is obtained that these regions have a reasonable wind power potential and they
are suitable for planting wind energy turbines. In addition, according to authors Belen-Hatay
is the most promising and convenient site for production of electricity from wind power. Bil-
gili et al. (2010) and Bilgili and Sahin (2010) investigated statistically wind energy density
of Akhisar, Bababurnu, Belen, Datca, Foca, Gelendost, Gelibolu, Gokceada and Soke districts
which are located in the southern, southwestern and western region of Turkey. The Weibull
and Rayleigh probability density functions, and the Wind Atlas Analysis and Application
Program (WAsP) packet program were used to analyze the measured data collected by the
General Directorate of Electrical Power Resources Survey Administration. They concluded
that the Weibull probability density function and WAsP program provide better power den-
sity estimations than Rayleigh probability density function for all stations enjoying a reason-
able wind power potential. They found that Gokceada and Gelibolu were the most promising
and convenient sites to product the electricity from the wind energy. Furthermore, Bilgili and
Sahin (2010) presented the electric power plants in Turkey and, their capacities and resources
used in the electricity generation in order to update the electric energy statistics. The status of
thermal, hydro, wind, and geothermal power plants in Turkey was classified according to the
electricity utilities.
Kurban and Hocaoglu (2010) studied the possible wind energy potential in Eskisehir, Turkey
using the data collected in the observation station established at Iki Eylul Campus of Anadolu
University. And they (2010) investigated the wind statistics and energy calculations for Es-
kisehir region using the Wind Atlas Analysis and Application Program (WAsP) software.
They selected suitable sites to locate wind turbines optimally according to the created wind
power and wind speed maps. Eighteen different wind turbines with nominal powers between
200 and 2,000 kW are considered to product energy. Karsli and Gecit (2003) determined the
wind power potential of the Nurdagi/Gaziantep district located in the south of Turkey using
Weibull parameters of the wind speed distribution. Their results show that the district has a
mean wind speed of 7.3 m/s at 10m height and mean power density of 222 W/m2. Akpinar
and Akpinar (2004) evaluated the wind energy potential of Maden-Elazig in eastern Turkey
and obtained that the mean speed varies between 5 and 6 m/s and yearly mean power den-
sity is 244.65 W/m2. Kose (2004) and Kose et al. (2004) determined the possible wind energy
potential at the Dumlupinar University-Kutahya main campus using their own observation
station. Celik (2003) analyzed the wind energy potential of Iskenderun based on the Weibull
and the Rayleigh models using 1-year measured hourly time-series wind speed data.
It can be generated more power from wind energy by selection of wind farm site with suitable
wind electric generator and establishment of more number of wind stations. The selection
and installing of suitable wind electric generator to produce electrical energy economically in
the windy areas requires a number of activities that include the investigation of the source,
feasibility assessment etc. Ozerdem et al. (2006) carried out both technical and economical
feasibility study for a wind farm in Izmir-Turkey using three diverse scenarios for economical
evaluation. It was shown that the generating cost per kWh and internal rate of return value
for all three scenarios were promising. Celik (2007) analyzed economically suitable power
generation using wind turbines which have nominal power range form 0.6 to 500 kW. This
study showed that Iskenderun was amongst the possible wind energy generation regions,
Clean Energy Systems and Experiences134
and the lowest cost of electricity at $0.15 per kWh was obtained in the wind turbine with 500
kW.
Gökçek et al. (2007a, 2007b) studied wind energy potential and energy cost analysis of Kirk-
lareli in the Marmara Region, Turkey. The results of their study indicated that Kirklareli en-
joyed well enough wind energy potential and the wind turbine with 2300 kW rated power
realized the highest annual energy production and the electrical energy cost per kWh was es-
timated as about 0.06 $ for turbine specific cost as 700 $/kW. Genç and Gökçek (2009), and
Gökçek and Genç (2009) investigated the evaluation of wind potential, and electricity gen-
eration and cost of wind energy conversion systems in Central Anatolia Turkey. They has
concluded that Pinarbasi among considered sites has a remarkable potential of wind energy
for utilization and can be evaluated as marginal area for cost-effective electrical energy gener-
ation as the costs of wind energy conversion systems are lowered. Furthermore, according to
the result of the calculations, it was shown that the wind energy conversion system of capacity
150 kW produce the energy output about 121 MWh per year in the Pinarbasi for hub height 30
m and also energy cost varies in the range of 0.29-30.0 $/kWh for all wind energy conversion
systems considered.
2. Wind Characteristic
2.1 Wind Energy Meteorology
The atmosphere of the earth absorbs solar radiation during the day. Then it delivers heat to
space at a lower temperature at night time. In this process, the regions where the air pressure
is temporarily higher or lower than average occur. This difference in air pressure causes air
mass to flow from the region of higher pressure to that of lower pressure. This flow of air
masses is called as wind.
Wind has two characteristics: wind speed and wind direction. Wind speed is the velocity of
the air mass which travels horizontally through the atmosphere. Wind speed is often mea-
sured with an anemometer in kilometers per hour (kmph), miles per hour (mph), knots, or
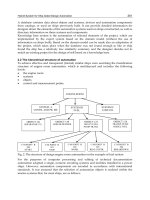
meters per second (mps) (Pidwirny, 2006). An anemometer (Fig. 2) consists of three open
cups attached to a rotating spindle. Wind direction is called as the direction from where a
wind comes from. Direction is measured by an instrument called a wind vane which is shown
in Fig. 2. The wind vane instrument has a bullet shaped nose attached to a finned tail by a
metal bar. The anemometer and wind vane are positioned in the atmospheric at a standard
distance of 10 meters above the ground.
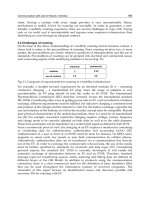
Information on the direction of wind can be presented in the wind roses. The wind rose is
a chart which indicates the distribution of wind in different direction. Fig. 3 describes the
sixteen principal directions of wind. Meteorology reports the wind direction using one of
these sixteen directions. And aeronautical meteorology uses the degree concept based on
the 360 degrees found in a circle for the wind direction, while climatological and synoptical
meteorology uses the sixteen principal directions.
Wind always blows from high pressure region to low pressure region. High/low pressure
region is a region whose pressure is higher/lower than its surroundings. The velocity of wind
is based on pressure gradient force. If the pressure gradient force is greater, the faster wind
will blow. If the isobars which are a line drawn through points of equal pressure on a weather
map (Fig. 4) are closely spaced, a meteorologist can forecast wind speed to be high due to
the fact that the pressure gradient force is great. In areas where the isobars are spaced widely
apart, the pressure gradient is low and light winds normally exist. For example, when the low
pressure region in the north of Black Sea in the surface weather chart taken from Turkish State
Fig. 2. Anemometer used to measure wind speed and direction (Pidwirny, 2006)
Meteorological Service (Turkish State Meteorological Service, 2010) is considered, the winds
in the A region are faster than the winds in the B region. Because A region inside yellow circle
has the four isobars while B region inside brown circle enjoying same diameter with yellow
circle has the two isobars.
There are three another forces acting on wind: coriolis force which the rotation of the Earth
creates, centrifugal force which is directed towards the center of rotation and friction force
which the Earth’s surface creates. The coriolis force and centrifugal force only influence wind
direction, while frictional force have a negative effect on wind speed and are limited to the
lower one kilometer above the Earth’s surface (Pidwirny, 2006).
2.2 Wind Speed Distribution in Turkey
Turkish Wind Atlas shown for open plains in Figure 5 was prepared using Wind Atlas Anal-
ysis and Application Program by Turkish State Meteorological Services and Electrical Power
Resources Survey and Development Administration in 2002 (Dündar et al., 2002). In this
study, the observations have been done for 96 meteorological stations distributed homoge-
neously over Turkey, and 45 of these observation stations were used for the preparation of the
Wind Atlas. In this Wind Atlas, the legend for closed plains was given in Table 1. As shown
in Figure 5 and Table 1, there are many suitable sites especially in coastal areas and central
region (Pinarbasi) of Turkey to product electricity from wind energy.
Economic analysis of large-scale wind
energy conversion systems in central anatolian Turkey 135
and the lowest cost of electricity at $0.15 per kWh was obtained in the wind turbine with 500
kW.
Gökçek et al. (2007a, 2007b) studied wind energy potential and energy cost analysis of Kirk-
lareli in the Marmara Region, Turkey. The results of their study indicated that Kirklareli en-
joyed well enough wind energy potential and the wind turbine with 2300 kW rated power
realized the highest annual energy production and the electrical energy cost per kWh was es-
timated as about 0.06 $ for turbine specific cost as 700 $/kW. Genç and Gökçek (2009), and
Gökçek and Genç (2009) investigated the evaluation of wind potential, and electricity gen-
eration and cost of wind energy conversion systems in Central Anatolia Turkey. They has
concluded that Pinarbasi among considered sites has a remarkable potential of wind energy
for utilization and can be evaluated as marginal area for cost-effective electrical energy gener-
ation as the costs of wind energy conversion systems are lowered. Furthermore, according to
the result of the calculations, it was shown that the wind energy conversion system of capacity
150 kW produce the energy output about 121 MWh per year in the Pinarbasi for hub height 30
m and also energy cost varies in the range of 0.29-30.0 $/kWh for all wind energy conversion
systems considered.
2. Wind Characteristic
2.1 Wind Energy Meteorology
The atmosphere of the earth absorbs solar radiation during the day. Then it delivers heat to
space at a lower temperature at night time. In this process, the regions where the air pressure
is temporarily higher or lower than average occur. This difference in air pressure causes air
mass to flow from the region of higher pressure to that of lower pressure. This flow of air
masses is called as wind.
Wind has two characteristics: wind speed and wind direction. Wind speed is the velocity of
the air mass which travels horizontally through the atmosphere. Wind speed is often mea-
sured with an anemometer in kilometers per hour (kmph), miles per hour (mph), knots, or
meters per second (mps) (Pidwirny, 2006). An anemometer (Fig. 2) consists of three open
cups attached to a rotating spindle. Wind direction is called as the direction from where a
wind comes from. Direction is measured by an instrument called a wind vane which is shown
in Fig. 2. The wind vane instrument has a bullet shaped nose attached to a finned tail by a
metal bar. The anemometer and wind vane are positioned in the atmospheric at a standard
distance of 10 meters above the ground.
Information on the direction of wind can be presented in the wind roses. The wind rose is
a chart which indicates the distribution of wind in different direction. Fig. 3 describes the
sixteen principal directions of wind. Meteorology reports the wind direction using one of
these sixteen directions. And aeronautical meteorology uses the degree concept based on
the 360 degrees found in a circle for the wind direction, while climatological and synoptical
meteorology uses the sixteen principal directions.
Wind always blows from high pressure region to low pressure region. High/low pressure
region is a region whose pressure is higher/lower than its surroundings. The velocity of wind
is based on pressure gradient force. If the pressure gradient force is greater, the faster wind
will blow. If the isobars which are a line drawn through points of equal pressure on a weather
map (Fig. 4) are closely spaced, a meteorologist can forecast wind speed to be high due to
the fact that the pressure gradient force is great. In areas where the isobars are spaced widely
apart, the pressure gradient is low and light winds normally exist. For example, when the low
pressure region in the north of Black Sea in the surface weather chart taken from Turkish State
Fig. 2. Anemometer used to measure wind speed and direction (Pidwirny, 2006)
Meteorological Service (Turkish State Meteorological Service, 2010) is considered, the winds
in the A region are faster than the winds in the B region. Because A region inside yellow circle
has the four isobars while B region inside brown circle enjoying same diameter with yellow
circle has the two isobars.
There are three another forces acting on wind: coriolis force which the rotation of the Earth
creates, centrifugal force which is directed towards the center of rotation and friction force
which the Earth’s surface creates. The coriolis force and centrifugal force only influence wind
direction, while frictional force have a negative effect on wind speed and are limited to the
lower one kilometer above the Earth’s surface (Pidwirny, 2006).
2.2 Wind Speed Distribution in Turkey
Turkish Wind Atlas shown for open plains in Figure 5 was prepared using Wind Atlas Anal-
ysis and Application Program by Turkish State Meteorological Services and Electrical Power
Resources Survey and Development Administration in 2002 (Dündar et al., 2002). In this
study, the observations have been done for 96 meteorological stations distributed homoge-
neously over Turkey, and 45 of these observation stations were used for the preparation of the
Wind Atlas. In this Wind Atlas, the legend for closed plains was given in Table 1. As shown
in Figure 5 and Table 1, there are many suitable sites especially in coastal areas and central
region (Pinarbasi) of Turkey to product electricity from wind energy.
Clean Energy Systems and Experiences136
N
S
NW
SW
SE
NE
90
o
45
o
135
o
225
o
315
o
180
o
270
o
0
o
, 360
o
W E
Fig. 3. Wind rose
2.3 Wind Speed Variation With Height
It is necessary that the wind data extrapolate for the turbine hub heights since the wind data
are measured at 10 m height above ground. In order to calculate of wind speeds at any height,
log law can be used. Log law boundary layer profile (Archer and Jacobson, 2003) incorporates
a roughness factor based on the local surface roughness scale z
s
(m),
v
= v
0
ln
(z/z
s
)
ln(z
0
/z
s
)
(1)
where v is the wind speed to be determine for the desired height (z), v
0
is the wind speed at
recorded at standard anemometer height (z
0
). Surface roughness is based on land use category
such as urban, cropland, grassland, forest, water, barren, tundra, etc. The land use category
can be selected from the Engineering Sciences Data Unit (Engineering Sciences Data Unit,
2010).
2.4 Weibull and Rayleigh Wind Speed Statistics
In order to describe the wind speed frequency distribution, there are several probability den-
sity functions. The probability density functions point out the frequency distribution of wind
speed, and which the interspace of the most frequent wind speed is, and how long a wind
turbine is out and on of action. The Weibull and the Rayleigh functions are the two most
Fig. 4. The surface weather chart (Turkish State Meteorological Service, 2010)
Color Wind speed (m/s) Wind power (W/m
2
)
Dark blue
>6.0 >250
Red 5.0-6.0 150-250
Yellow 4.5-5.0 100-150
Green 3.5-4.5 50-100
Cyan
<3.5 <50
Table 1. The wind speed distributions for closed plains on Turkish Wind Atlas (Dündar et al.,
2002)
known. The Weibull is a special case of generalized gamma distribution, while the Rayleigh
distribution is a subset of the Weibull (Johnson, 2006). The Weibull is a two parameter distri-
bution while the Rayleigh has only one parameter and this makes the Weibull somewhat more
versatile and the Rayleigh somewhat simpler to use (Johnson, 2006). The Weibull distribution
function is expressed as
f
w
(v) =
k
c
v
c
k−1
exp
−
v
c
k
(2)
where v is the wind speed, c Weibull scale parameter in m/s, and k dimensionless Weibull
shape parameter. These parameters can be determined by the mean wind speed-standard
deviation method (Justus et al., 1977) using Eqs. 3 and 4.
k
=
σ
v
−1.086
(1 ≤ k ≤ 10) (3)
Economic analysis of large-scale wind
energy conversion systems in central anatolian Turkey 137
N
S
NW
SW
SE
NE
90
o
45
o
135
o
225
o
315
o
180
o
270
o
0
o
, 360
o
W E
Fig. 3. Wind rose
2.3 Wind Speed Variation With Height
It is necessary that the wind data extrapolate for the turbine hub heights since the wind data
are measured at 10 m height above ground. In order to calculate of wind speeds at any height,
log law can be used. Log law boundary layer profile (Archer and Jacobson, 2003) incorporates
a roughness factor based on the local surface roughness scale z
s
(m),
v
= v
0
ln
(z/z
s
)
ln(z
0
/z
s
)
(1)
where v is the wind speed to be determine for the desired height (z), v
0
is the wind speed at
recorded at standard anemometer height (z
0
). Surface roughness is based on land use category
such as urban, cropland, grassland, forest, water, barren, tundra, etc. The land use category
can be selected from the Engineering Sciences Data Unit (Engineering Sciences Data Unit,
2010).
2.4 Weibull and Rayleigh Wind Speed Statistics
In order to describe the wind speed frequency distribution, there are several probability den-
sity functions. The probability density functions point out the frequency distribution of wind
speed, and which the interspace of the most frequent wind speed is, and how long a wind
turbine is out and on of action. The Weibull and the Rayleigh functions are the two most
Fig. 4. The surface weather chart (Turkish State Meteorological Service, 2010)
Color Wind speed (m/s) Wind power (W/m
2
)
Dark blue >6.0 >250
Red 5.0-6.0 150-250
Yellow 4.5-5.0 100-150
Green 3.5-4.5 50-100
Cyan <3.5 <50
Table 1. The wind speed distributions for closed plains on Turkish Wind Atlas (Dündar et al.,
2002)
known. The Weibull is a special case of generalized gamma distribution, while the Rayleigh
distribution is a subset of the Weibull (Johnson, 2006). The Weibull is a two parameter distri-
bution while the Rayleigh has only one parameter and this makes the Weibull somewhat more
versatile and the Rayleigh somewhat simpler to use (Johnson, 2006). The Weibull distribution
function is expressed as
f
w
(v) =
k
c
v
c
k−1
exp
−
v
c
k
(2)
where v is the wind speed, c Weibull scale parameter in m/s, and k dimensionless Weibull
shape parameter. These parameters can be determined by the mean wind speed-standard
deviation method (Justus et al., 1977) using Eqs. 3 and 4.
k
=
σ
v
−1.086
(1 ≤ k ≤ 10) (3)
Clean Energy Systems and Experiences138
Fig. 5. Turkish Wind Atlas (Dündar et al., 2002)
c
=
v
Γ
1 +
1
k
(4)
where
v is the mean wind speed and σ is the standard deviation. v is calculated using Eq. 5
and σ using Eq. 6 (Zhou et al., 2006).
v =
1
n
n
∑
i=1
v
i
(5)
σ
=
1
n − 1
n
∑
i=1
(
v
i
− v
)
2
0.5
(6)
where n is the number of hours in the period of the time considered such as month, season or
year.
The dimensionless shape parameter, k of Weibull distribution is assumed as 2 in Rayleigh dis-
tribution functions. The probability density function of the Rayleigh distribution is expressed
as
f
R
(v) =
πv
2v
2
exp
−
π
4
v
v
2
(7)
The wind power density of any windy site per unit area based on any probability density
function to estimate the wind power can be expressed as
P
m
=
1
2
ρ
∞
0
v
3
f (v)dv (8)
where ρ is the standard air density, 1.225 kg/m
3
. When the Weibull function is chosen as
distribution function f
(v), the average wind power density is calculated as
P
mw
=
1
2
ρv
3
Γ
(
1 + 3/k
)
[
Γ
(
1 + 1/k
)]
3
(9)
3. Electrical Power of Wind Energy Conversion System
Annual wind energy output, Ewt for any windy site can be calculated using the time-series
wind speed data of that site and the power curve of a wind turbine. In order to predict the
wind energy output to be obtained from the wind turbine, an algebraic equation of degree n
according to the power curve of the wind turbine between cut-in and rated speed or cut-in
speed and cut-out speed can be expressed as Eq. 10.
P
i
(v) =
0, v
< v
ci
a
n
v
n
+ a
n−1
v
n−1
+ + a
1
v + a
0
, v
ci
≤ v < v
R
P
R
, v
R
≤ v < v
co
or
a
n
v
n
+ a
n−1
v
n−1
+ + a
1
v + a
0
, v
ci
≤ v < v
co
0, v ≥ v
co
(10)
where a
n
,a
n−1
, a
1
and a
0
are regression constants, v
ci
is the cut-in speed, v
R
is the rated speed,
v
co
is the cut-out speed and P
R
is the rated power and also P
i
(v) is the power generating in
the related wind speed.
The total energy generated by the operational turbine over a period is calculated by adding
up the energy output of all possible wind speeds. In this study, the energy output from a wind
turbine was obtained with Eq. 11 using the hourly mean wind speeds.
E
wt
=
n
∑
i=1
P
i
(v)t (11)
where n is the number of hours in the period of the considered time such as year, season or
month, t is one hour time duration.
Capacity factor, C
f
is an indicator of both the turbine type and the wind speed in a site con-
sidered. The capacity factor is important for assessing the performance of a wind turbine in a
site considered (Sathyajith, 2006). Annual value of the capacity factor can be calculated as
C
f
=
E
wt
E
rated
(12)
4. Energy Cost Analysis of Wind Energy
The fuel of wind energy may be free, but the equipment necessary to use the wind energy can
be expensive, so economic analysis of the wind energy is quite important. The wind turbine
has to enjoy low operating cost. There are several factors affecting the unit energy cost of
Economic analysis of large-scale wind
energy conversion systems in central anatolian Turkey 139
Fig. 5. Turkish Wind Atlas (Dündar et al., 2002)
c
=
v
Γ
1
+
1
k
(4)
where v is the mean wind speed and σ is the standard deviation. v is calculated using Eq. 5
and σ using Eq. 6 (Zhou et al., 2006).
v
=
1
n
n
∑
i=1
v
i
(5)
σ
=
1
n
− 1
n
∑
i=1
(
v
i
− v
)
2
0.5
(6)
where n is the number of hours in the period of the time considered such as month, season or
year.
The dimensionless shape parameter, k of Weibull distribution is assumed as 2 in Rayleigh dis-
tribution functions. The probability density function of the Rayleigh distribution is expressed
as
f
R
(v) =
πv
2v
2
exp
−
π
4
v
v
2
(7)
The wind power density of any windy site per unit area based on any probability density
function to estimate the wind power can be expressed as
P
m
=
1
2
ρ
∞
0
v
3
f (v)dv (8)
where ρ is the standard air density, 1.225 kg/m
3
. When the Weibull function is chosen as
distribution function f
(v), the average wind power density is calculated as
P
mw
=
1
2
ρ
v
3
Γ
(
1 + 3/k
)
[
Γ
(
1 + 1/k
)]
3
(9)
3. Electrical Power of Wind Energy Conversion System
Annual wind energy output, Ewt for any windy site can be calculated using the time-series
wind speed data of that site and the power curve of a wind turbine. In order to predict the
wind energy output to be obtained from the wind turbine, an algebraic equation of degree n
according to the power curve of the wind turbine between cut-in and rated speed or cut-in
speed and cut-out speed can be expressed as Eq. 10.
P
i
(v) =
0, v
< v
ci
a
n
v
n
+ a
n−1
v
n−1
+ + a
1
v + a
0
, v
ci
≤ v < v
R
P
R
, v
R
≤ v < v
co
or
a
n
v
n
+ a
n−1
v
n−1
+ + a
1
v + a
0
, v
ci
≤ v < v
co
0, v ≥ v
co
(10)
where a
n
,a
n−1
, a
1
and a
0
are regression constants, v
ci
is the cut-in speed, v
R
is the rated speed,
v
co
is the cut-out speed and P
R
is the rated power and also P
i
(v) is the power generating in
the related wind speed.
The total energy generated by the operational turbine over a period is calculated by adding
up the energy output of all possible wind speeds. In this study, the energy output from a wind
turbine was obtained with Eq. 11 using the hourly mean wind speeds.
E
wt
=
n
∑
i=1
P
i
(v)t (11)
where n is the number of hours in the period of the considered time such as year, season or
month, t is one hour time duration.
Capacity factor, C
f
is an indicator of both the turbine type and the wind speed in a site con-
sidered. The capacity factor is important for assessing the performance of a wind turbine in a
site considered (Sathyajith, 2006). Annual value of the capacity factor can be calculated as
C
f
=
E
wt
E
rated
(12)
4. Energy Cost Analysis of Wind Energy
The fuel of wind energy may be free, but the equipment necessary to use the wind energy can
be expensive, so economic analysis of the wind energy is quite important. The wind turbine
has to enjoy low operating cost. There are several factors affecting the unit energy cost of
Clean Energy Systems and Experiences140
electricity produced in the wind turbines. These factors may vary from a country to another
country.
The total capital investment and operating cost for wind electric generators have to been
known to determine the unit cost of electricity. In general, the cost per unit energy is found
by dividing the amount of energy produced to the total expenditures made along the certain
time interval. All costs of acquiring, owning, and disposing of a system must be considered to
make safely economic decisions. However, the value of money during the useful lifetime of
wind energy conversion system considered should be taken into account in the cost analysis.
The levelized cost of electricity method is one of the most important indicators for evaluating
fiscal performance of power supply systems such as wind energy conversion system (Gökçek
and Genç, 2009). The levelized cost of electricity method can be used to calculate the unit
cost throughout the useful life of a system. The levelized cost of the wind energy conversion
system is the ratio of the total annualized cost of the wind energy conversion system to the
annual electricity produced by this system (Gökçek and Genç, 2009). The generation cost
of the electrical energy of 1 kWh using a wind turbine system using the levelized cost of
electricity method can be defined as
C
el
=
C
wt
F
wt
+ C
in
F
in
+ C
ci
F
ci
+ C
bb
F
bb
+ C
misc
F
misc
+ C
(om)esc
E
wt
[$/kWh] (13)
where C
el
and C
(om)esc
are the cost of energy output and the cost of annual operation and
maintenance escalated, respectively. And F
wt
, F
in
, F
ci
, F
bb
and F
misc
are the annual charge rate
on capital for wind turbine, inverter, civil work and installation, battery bank and other mis-
cellaneous equipments, respectively. The annual charge rate on capital and can be expressed
by the following equation;
F
=
r
[
1 − (1 + r)
−n
]
(14)
where n and r are the useful system lifetime (year) and the discount rate, respectively.
The total investment cost of a wind energy conversion system is given as;
C
wecs
= C
wt
+ C
bb
+ C
ci
+ C
in
+ C
misc
[$] (15)
where C
wt
, C
bb
, C
ci
, C
in
and C
misc
are the cost of the wind turbine, the cost of battery bank,
the cost of civil work and installation, the cost of the inverter and the cost of miscellaneous
equipments (connecting cables, control panel and other components). Furthermore, while the
a wind energy conversion system is being bought from a company, the total investment cost
of the system, C
wecs
, can be also known as;
C
wecs
= I
wecs
P
r
[$] (16)
where I
wecs
and P
r
are the specific cost and rated power of the wind energy conversion system.
A distribution of relative costs different components of a typical 5 kW wind energy conversion
system is the wind machine 74%, miscellaneous components 10%, battery bank 9%, civil work
and installation 4%, inverter 3% (Nouni et al. 2007). In this study, the evaluation of cost was
considered as this cost break-up for all wind energy conversion systems. The total investment
cost of any wind energy conversion system in terms of rated power was taken as mean of
value read from Table 2 (Sathyajith 2006). And the costs of the wind turbine, battery bank,
civil work and installation cost, inverter and miscellaneous equipments were calculated by
using Eqs. 15 and 16 and used in Eq. 13.
Wind Turbine Size (kW) Specific Cost, I
wecs
, ($/kW)
10-20 2200-2900
20-200 1500-2300
200
> 1000-1600
Table 2. Cost of wind turbines based on the rated power
The cost of operation and maintenance escalated, C
(om)esc
, can be calculated as;
C
(om)esc
=
C
om
r − e
om
1
−
(
1 + e
om
)
n
(
1 + r
)
−n
[$/year] (17)
where C
om
is the cost of operation and maintenance for the first year and e
om
is ratio of esca-
lation of the operation and maintenance. Of course, the cost of operation and maintenance of
new wind energy conversion system is low. However, this cost will certainly increase as the
time goes on. In addition, this cost is affected from the conditions of wind site, the quality of
components and turbine design (Morthorst, 2004). The operation and maintenance cost, C
om
is generally considered as 15% of the annual cost of wind energy conversion system (Nouni
et al., 2007).
5. A Case Study: Energy Cost Analysis of Wind Energy in Central Turkey
In this section, the energy cost analysis of wind energy of Pinarbasi, Develi, Nigde, Kirsehir
and Sinop in Central Turkey was studied. In this study, energy costs of large-scale wind en-
ergy conversion systems at these observation stations considered were determined using the
levelized cost of electricity method. In order to energy cost analysis, the estimation of wind
characteristics and potential of Kayseri, Pinarbasi, Develi, Sariz, Tomarza, Kirikkale, Nigde,
Nevsehir, Kirsehir, Yozgat, Bogazliyan, Corum and Sinop in Central Turkey were presented in
previous studies (Genç and Gökçek, 2009; Gökçek and Genç, 2009; Genç, 2010). For these ob-
servation stations, wind data recorded using the cup anemometer for the years between 2000
and 2006 was taken from the Turkish State Meteorological Service. In the Turkish State Mete-
orological Service, the wind direction and wind speed are recorded by means of mechanical
strip chart recorder on paper. The cup anemometer is placed over the observation building
to be at a height of 10 m above the ground in all observation stations. The buildings around
these observation stations are not too big to affect the wind speed and direction. Most of the
meteorological observation stations of the Turkish State Meteorological Service in Turkey are
located in almost-clear terrain and outside the city center and the big buildings. But Sinop
observation station of the Turkish State Meteorological Service are near city center. The geo-
graphical specifications and wind characteristics of these observation stations at 10 m height
from the ground are given (Genç and Gökçek, 2009; Gökçek and Genç, 2009; Genç, 2010) in
Table 3.
As is shown in this table, at 10 m height the maximum annual mean wind speed, v, is 3.67
m/s in Pinarbasi, the maximum Weibull shape parameter, k, is 1.88 in Develi, the maximum
Weibull scale parameter, c, is 4.09 m/s in Pinarbasi, and the standard deviation, σ, is 2.56 m/s
in Pinarbasi. In Pinarbasi, both the mean wind speed and standard deviation is maximum. In
other words, Pinarbasi has larger both wind speed and variance of wind speed.
Economic analysis of large-scale wind
energy conversion systems in central anatolian Turkey 141
electricity produced in the wind turbines. These factors may vary from a country to another
country.
The total capital investment and operating cost for wind electric generators have to been
known to determine the unit cost of electricity. In general, the cost per unit energy is found
by dividing the amount of energy produced to the total expenditures made along the certain
time interval. All costs of acquiring, owning, and disposing of a system must be considered to
make safely economic decisions. However, the value of money during the useful lifetime of
wind energy conversion system considered should be taken into account in the cost analysis.
The levelized cost of electricity method is one of the most important indicators for evaluating
fiscal performance of power supply systems such as wind energy conversion system (Gökçek
and Genç, 2009). The levelized cost of electricity method can be used to calculate the unit
cost throughout the useful life of a system. The levelized cost of the wind energy conversion
system is the ratio of the total annualized cost of the wind energy conversion system to the
annual electricity produced by this system (Gökçek and Genç, 2009). The generation cost
of the electrical energy of 1 kWh using a wind turbine system using the levelized cost of
electricity method can be defined as
C
el
=
C
wt
F
wt
+ C
in
F
in
+ C
ci
F
ci
+ C
bb
F
bb
+ C
misc
F
misc
+ C
(om)esc
E
wt
[$/kWh] (13)
where C
el
and C
(om)esc
are the cost of energy output and the cost of annual operation and
maintenance escalated, respectively. And F
wt
, F
in
, F
ci
, F
bb
and F
misc
are the annual charge rate
on capital for wind turbine, inverter, civil work and installation, battery bank and other mis-
cellaneous equipments, respectively. The annual charge rate on capital and can be expressed
by the following equation;
F
=
r
[
1 − (1 + r)
−n
]
(14)
where n and r are the useful system lifetime (year) and the discount rate, respectively.
The total investment cost of a wind energy conversion system is given as;
C
wecs
= C
wt
+ C
bb
+ C
ci
+ C
in
+ C
misc
[$] (15)
where C
wt
, C
bb
, C
ci
, C
in
and C
misc
are the cost of the wind turbine, the cost of battery bank,
the cost of civil work and installation, the cost of the inverter and the cost of miscellaneous
equipments (connecting cables, control panel and other components). Furthermore, while the
a wind energy conversion system is being bought from a company, the total investment cost
of the system, C
wecs
, can be also known as;
C
wecs
= I
wecs
P
r
[$] (16)
where I
wecs
and P
r
are the specific cost and rated power of the wind energy conversion system.
A distribution of relative costs different components of a typical 5 kW wind energy conversion
system is the wind machine 74%, miscellaneous components 10%, battery bank 9%, civil work
and installation 4%, inverter 3% (Nouni et al. 2007). In this study, the evaluation of cost was
considered as this cost break-up for all wind energy conversion systems. The total investment
cost of any wind energy conversion system in terms of rated power was taken as mean of
value read from Table 2 (Sathyajith 2006). And the costs of the wind turbine, battery bank,
civil work and installation cost, inverter and miscellaneous equipments were calculated by
using Eqs. 15 and 16 and used in Eq. 13.
Wind Turbine Size (kW) Specific Cost, I
wecs
, ($/kW)
10-20 2200-2900
20-200 1500-2300
200 > 1000-1600
Table 2. Cost of wind turbines based on the rated power
The cost of operation and maintenance escalated, C
(om)esc
, can be calculated as;
C
(om)esc
=
C
om
r − e
om
1
−
(
1 + e
om
)
n
(
1 + r
)
−n
[$/year] (17)
where C
om
is the cost of operation and maintenance for the first year and e
om
is ratio of esca-
lation of the operation and maintenance. Of course, the cost of operation and maintenance of
new wind energy conversion system is low. However, this cost will certainly increase as the
time goes on. In addition, this cost is affected from the conditions of wind site, the quality of
components and turbine design (Morthorst, 2004). The operation and maintenance cost, C
om
is generally considered as 15% of the annual cost of wind energy conversion system (Nouni
et al., 2007).
5. A Case Study: Energy Cost Analysis of Wind Energy in Central Turkey
In this section, the energy cost analysis of wind energy of Pinarbasi, Develi, Nigde, Kirsehir
and Sinop in Central Turkey was studied. In this study, energy costs of large-scale wind en-
ergy conversion systems at these observation stations considered were determined using the
levelized cost of electricity method. In order to energy cost analysis, the estimation of wind
characteristics and potential of Kayseri, Pinarbasi, Develi, Sariz, Tomarza, Kirikkale, Nigde,
Nevsehir, Kirsehir, Yozgat, Bogazliyan, Corum and Sinop in Central Turkey were presented in
previous studies (Genç and Gökçek, 2009; Gökçek and Genç, 2009; Genç, 2010). For these ob-
servation stations, wind data recorded using the cup anemometer for the years between 2000
and 2006 was taken from the Turkish State Meteorological Service. In the Turkish State Mete-
orological Service, the wind direction and wind speed are recorded by means of mechanical
strip chart recorder on paper. The cup anemometer is placed over the observation building
to be at a height of 10 m above the ground in all observation stations. The buildings around
these observation stations are not too big to affect the wind speed and direction. Most of the
meteorological observation stations of the Turkish State Meteorological Service in Turkey are
located in almost-clear terrain and outside the city center and the big buildings. But Sinop
observation station of the Turkish State Meteorological Service are near city center. The geo-
graphical specifications and wind characteristics of these observation stations at 10 m height
from the ground are given (Genç and Gökçek, 2009; Gökçek and Genç, 2009; Genç, 2010) in
Table 3.
As is shown in this table, at 10 m height the maximum annual mean wind speed,
v, is 3.67
m/s in Pinarbasi, the maximum Weibull shape parameter, k, is 1.88 in Develi, the maximum
Weibull scale parameter, c, is 4.09 m/s in Pinarbasi, and the standard deviation, σ, is 2.56 m/s
in Pinarbasi. In Pinarbasi, both the mean wind speed and standard deviation is maximum. In
other words, Pinarbasi has larger both wind speed and variance of wind speed.
Clean Energy Systems and Experiences142
Station Latitude(N) Longitude(E) Altitude (m) v (m/s) k c (m/s) σ
Pinarbasi 38
o
43’ 36
o
24’ 1500 3.67 1.49 4.09 2.56
Sinop 42
o
01’ 35
o
10’ 32 3.02 1.21 3.22 2.54
Kirsehir 39
o
09’ 34
o
10’ 1007 2.49 1.36 3.19 1.88
Nigde 37
o
58’ 34
o
41’ 1211 2.48 1.64 2.76 1.58
Develi 38
o
23’ 35
o
30’ 1180 2.60 1.88 2.97 1.48
Kirikkale 39
o
51’ 33
o
31’ 747 2.16 1.43 2.38 1.56
Tomarza 38
o
27’ 35
o
48’ 1347 2.24 1.20 2.42 1.92
Nevsehir 38
o
35’ 34
o
40’ 1260 2.00 1.56 2.23 1.33
Bogazliyan 39
o
12’ 35
o
15’ 1066 2.07 1.10 2.15 1.90
Yozgat 39
o
49’ 34
o
48’ 1298 1.93 1.67 2.16 1.20
Corum 40
o
33’ 34
o
57’ 776 1.71 1.11 1.78 1.55
Sariz 38
o
29’ 36
o
30’ 1500 1.69 1.26 1.87 1.40
Kayseri 38
o
44’ 35
o
29’ 1093 1.60 1.16 1.72 1.43
Sivas 39
o
45’ 37
o
01’ 1285 1.30 1.35 1.42 0.99
Table 3. Geographical specifications and wind characteristics of the observation stations at 10
m height on the ground
Sinop
Pinarbasi
Fig. 6. The distribution of mean wind directions in Pinarbasi and Sinop
In order to calculate of wind speeds at any hub height, log law was used in this study. For
log law, the local surface roughness scale z
s
was selected as in Table 4 for all observation
station from the Engineering Sciences Data Unit (Engineering Sciences Data Unit, 2010). The
wind speeds of these observation stations at 50 m hub height using log law were obtained by
considering the land use category of the observation stations. It is shown that these obtained
mean annual wind speeds are correspond to the values on Turkish Wind Atlas for closed
plains (Table 1). Pinarbasi and Sinop are in yellow region where the mean annual wind speed
is between 4.5 m/s and 5.0 m/s on Turkish Wind Atlas for closed plains (Table 1) and it is
obtained that Pinarbasi has the wind speed of 5.08 m/s and Sinop has the mean annual wind
speed of 4.64 m/s at 50 m hub height in this study. These obtained wind speeds are correspond
Station Land use category z
s
Wind speed at 50 m (m/s)
Pinarbasi Savannah 0.15 5.08
Sinop Forest 0.5 4.64
Kirsehir Mixed shrubland/grassland 0.3 3.63
Nigde Mixed shrubland/grassland 0.3 3.62
Develi Savannah 0.15 3.60
Kirikkale Mixed shrubland/grassland 0.3 3.15
Tomarza Savannah 0.15 3.10
Nevsehir Mixed shrubland/grassland 0.3 2.92
Bogazliyan Savannah 0.15 2.86
Yozgat Mixed shrubland/grassland 0.3 2.82
Corum Mixed shrubland/grassland 0.3 2.49
Sariz Savannah 0.15 2.34
Kayseri Mixed shrubland/grassland 0.3 2.33
Sivas Urban 1.0 2.21
Table 4. Local surface roughness scales and wind speeds of the observation stations at 50 m
height on the ground
to the values on Turkish Wind Atlas for closed plains (Table 1) except for Sivas and Sariz. The
wind speeds of Sivas and Sariz are seen as less than the values on Turkish Wind Atlas, because
Sivas observation station is in city center and Sariz observation station is on a plain between
mountains. Finally, Pinarbasi and Sinop, can be characterized as marginal site (fairly good) in
point of wind energy potential.
The direction of wind is an important factor for establishing the wind energy conversion sys-
tem. If it is received the major share of the wind from a certain direction, it should be avoided
any obstructions to the wind flow from this side. The distribution of the mean wind directions
in Pinarbasi (Genç and Gökçek, 2009) and Sinop (Genç, 2010) which are marginal site is seen
in Fig. 6. As is seen from this figure, the prevailing wind directions of Pinarbasi and Sinop are
the east northeast (ENE, 67.5
o
) and the west northwest (WNW, 270
o
), respectively.
In this study, the wind speeds for all observation stations have been analyzed using the
Weibull and Rayleigh probability density functions used to determine the wind potential of
a site in a period of time. Figs. 7, 8 and 9 exhibits the actual, Weibull and Rayleigh distribu-
tions derived from observed the hourly wind data for the year 2003 regarding all observation
stations considered. According to the probability density functions, the interspace which has
the most frequent wind speed, and how long a wind turbine is out and on of action can be as-
sessed. When it is looked at the Figs. 7, 8 and 9, it is seen that the distribution of wind speed of
Pinarbasi, Sinop and Kirsehir is more widen than others. It means that their interspace which
has the most frequent wind speed is more bigger than others and the wind energy capacity
of these stations is more bigger. For example, the interspace of most frequent is between 0-10
m/s for Pinarbasi, while it is between 0-5 m/s for Kayseri. The Weibull distributions of Sinop,
Kirsehir, Tomarza, Nevsehir, Bogazliyan, Corum, Sariz, and Sivas observation stations are in
good agreement with actual data, whereas the Rayleigh distribution function is more accurate
than the Weibull distribution function in the Pinarbasi, Nigde, Kirikkale, Yozgat and Kayseri
wind observation stations. Furthermore, Fig. 10 shows the annual wind power density dis-
tributions in all observation stations for the year 2003. As showns in this figure, Pinarbasi
has the maximum wind power (125 W/m
2
) as actual, and the distributions of Weibull wind