Coherence and Ultrashort Pulse Laser Emission Part 13 ppt
Bạn đang xem bản rút gọn của tài liệu. Xem và tải ngay bản đầy đủ của tài liệu tại đây (3.81 MB, 40 trang )
Coherence and Ultrashort Pulse Laser Emission
472
at longer wavelengths. Hence, the modulation of the signal pulse at longer wavelengths and
of the fundamental pulse at shorter wavelengths is depressed. Then, the larger gap between
the fundamental and signal spectra is formed. In contrast, when the two pulses meet at the
end of the fiber T
d
= -80 fs, the trailing edge (longer wavelengths) of the signal pulse mainly
interacts with the leading edge (shorter wavelengths) of the fundamental pulse. As a result,
the IPM-induced spectrum of the signal pulse shifts towards its longer wavelengths and the
IPM-induced fundamental pulse spectrum shifts towards its shorter wavelengths and a
larger overlap of the two pulse spectra is observed in both Figs. 13(c) and 14(c). This shows
that the calculation qualitatively agrees well with the previous experimental results. The
spectral bandwidth of Fig. 13(c) is
Δλ
1/100
=
λ
max
-
λ
min
= 861.8 - 582.9 = 278.9 nm. The spectral
bandwidth of Fig. 14(c) is
Δλ
1/100
=
λ
max
-
λ
min
= 895.9 - 579.1 = 316.8 nm. It is found that when
the two pulses meet at the center of the fiber, the fundamental pulse passes through the
signal pulse in a symmetric manner. As a result, the spectra are broadened by the IPM effect
to shorter and longer wavelengths simultaneously for both pulses and the broadest
combined spectrum is generated in both Figs. 13(b) and 14(b). This shows that the
calculation qualitatively agrees well with the previous experimental results. The spectral
bandwidth of Fig. 13(b) is
Δλ
1/100
=
λ
max
-
λ
min
= 887.3 - 567.3 = 320.0 nm. The spectral
bandwidth of Fig. 14(b) is
Δλ
1/100
=
λ
max
-
λ
min
= 896.6 - 577.6 = 319.0 nm. Figures 13(b) and 14(b)
generally have the same value of
Δλ
1/100
.
This case is referred to as the optimum initial time
delay to produce the broadest spectrum. In Figs. 13 and 14, it is the same feature that the
most broadened spectra are Fig. 13(b) and Fig. 14(b) with an initial delay of T
d
= -40 fs.
Consequently, the extended FDTD results and our previous experimental results have the
same behavior of spectral bandwidth, which indicates the same initial delay dependence.
That is, the extended FDTD calculation qualitatively agrees well with the previous
experimental results although it does not agree quantitatively. This quantitative
disagreement might be due to the low sensitivity of the detector of the spectrometer at
wavelengths longer than 800 nm because the detector is made of Si. We suggest that InGeAs
should be used for the detector, which is highly sensitive in the detection of the infrared
region light.
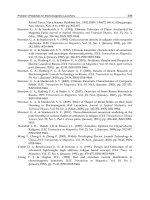
Figure 15 shows the spectral phase obtained numerically as a function of wavelength for
mixed two pulses at center wavelengths of 795 and 640 nm after simultaneous
copropagation with an initial delay of (a) 0, (b) -40, and (c) -80 fs in a 3 mm silica fiber.
Around the center wavelength (795 nm) of the fundamental pulse, the phase curve is
parabolic and its symmetry axis is (a) 774.14, (b) 749.45, and (c) 775.58 nm. Around the
center wavelength (640 nm) of the signal pulse, the phase curve is parabolic and its
symmetry axis is (a) 673.99, (b) 676.90, and (c) 687.78 nm. The symmetry axis of every
parabolic curve in Fig. 15 shifts toward the wavelength of 720 nm, which is the center
wavelength between 795 and 640 nm. This feature is seen when the IPM effect occurs, so
that this feature is not found only in the SPM case of Fig. 12. In addition, it is observed in
Fig. 15 that the spectral phases of the two pulses at the wavelength
λ
of (a) 711.7, (b) 713.17,
and (c) 713.17 nm are continuously connected at a phase value of
φ
(
λ
) = (a)17.76, (b) 10.46,
and (c) 17.94 rad without any discrete point. Furthermore, regarding wavelengths shorter
than 640 nm, one more parabolic curve is found between 500 and 570 nm. This curve is
found to be that of the anti-Stokes light (theoretically 535.58 nm) generated by the induced
DFWM where the pump light is 640 nm and the Stokes light is 795 nm. The chirped first and
second pulses broadening by dispersion interact each other, and the nonlinear interaction
length is prolonged with an initial delay of -80 fs. The DFWM is robust for chirping.
(Cundiff et al., 1999), (Geraghty et al., 1998)
Comparison Between Finite-Difference Time-Domain Method and Experimental Results for
Femtosecond Laser Pulse Propagation
473
500 600 700 800 900
0
200
400
600
500 600 700 800 900
0
200
400
500 600 700 800 900
0
200
400
Wavelength [nm]
Phase [rad]
(a) T
d
= 0 fs
Phase [rad] Phase [rad]
(c) T
d
= – 80 fs
(b) T
d
= – 40 fs
Fig. 15. Spectral phase obtained numerically as function of wavelength for mixed two pulses
at center wavelengths of 795 and 640 nm after simultaneous copropagation with an initial
delay of (a) 0, (b) -40, and (c) -80 fs in 3 mm silica fiber. (Nakamura et al., 2005b)
When the two pulses meet at the end of the fiber T
d
= 80 fs, the trailing edge of the signal
pulse mainly interacts with the leading edge of the fundamental pulse and the chirped
pulses gradually become overlapping at the places where the pulses are temporally
broadened; therefore, the interaction length is long. As a result, the four-wave mixing effect
is enhanced and a larger parabolic phase curve of the anti-Stokes light in the spectral phase
is observed. Then the phase matching condition for DFWM at the end of the fiber is satisfied
with an initial delay of -80 fs, which corresponds to the situation in which two pulses meet
at the end of the fiber via a different group velocity of the two pulses. Looking again at Fig.
15, the anti-Stokes light appears faintly in the phase with an initial delay of -40 as well, but
no anti-Stokes light appears with an initial delay of 0 fs. The anti-Stokes light of DFWM
appears when long chirped pulses finally overlap at the end of the fiber, the IPM effect is
strong when short pulses overlap at the beginning of the fiber, and IPM and DFWM cross-
interact and spectral broadening is maximum when the pulses overlap at the center of the
fiber. Such precise information on the spectral phase of the pulse propagated in a fiber is
very important for the wavelength conversion with spectral broadening or the generation of
a monocycle pulse using a spatial light modulator (SLM) that can compensate the spectral
phase of a superbroadened continuum. The shortest pulse attainable by phase correction of
this ultrabroad spectrum is obtained by the Fourier transform of the spectrum of Fig. 14 and
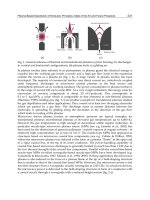
assuming a constant spectral phase. This yields a transform-limited pulse. Figure 16 shows
the temporal profiles of the transform-limited pulses obtained numerically for the mixed
Coherence and Ultrashort Pulse Laser Emission
474
two-pulse spectra shown in Fig. 14 at the center wavelengths of 795 and 640 nm after
simultaneous copropagation with an initial delay of (a) 0, (b) -40, and (c) -80 fs in a 3 mm
silica fiber. The FWHM pulse widths are (a) 4.1, (b) 4.0, and (c) 4.7 fs. The pulse width under
an initial delay of –40 fs is 4.0 fs, which is the same value, 4 fs (Xu et al., 1999), obtained by
Fourier transform of the experimental result of Fig. 15(b) reported by Xu et al.
–50 0 50
0
1
–50 0 50
0
1
–50 0 50
0
1
4.1 fs
(a)T
d
= 0 fs
(b)T
d
= – 40 fs
4.0 fs
Intensity [arb. units]
Time
[
fs
]
4.7 fs
(c)T
d
= – 80 fs
Intensity [arb. units] Intensity [arb. units]
Fig. 16. Temporal profiles of transform-limited pulses obtained numerically for mixed two-
pulse spectra shown in Fig. 6 at center wavelengths of 795 and 640 nm after simultaneous
copropagation with initial delay of (a) 0, (b) -40, and (c) -80 fs in a 3 mm silica fiber.
(Nakamura et al., 2005b)
4.4 Summary of dual wavelengths femtosecond pulses propagation
The ultrabroad spectrum generation based on the IPM of two optical pulses copropagating
in a single-mode fused-silica fiber has been numerically demonstrated, which is compared
with our previous experimental results. To the best of our knowledge, this is the first
comparison between the extended FDTD calculation and the experiment. In the extended
FDTD, it was found that the spectral phases of the two pulses around the wavelength of 710
Comparison Between Finite-Difference Time-Domain Method and Experimental Results for
Femtosecond Laser Pulse Propagation
475
nm are continuously connected at a phase value of
φ
(
λ
) = 10-20 rad without any discrete
point. This fact was unknown when BPM was used previously. In the extended FDTD
simulation, two 120 fs pulses with wavelengths at 640 and 795 nm were coupled into a 3 mm
single-mode fiber. At a pulse energy of 20 nJ coupled into the fiber for both pulses, an
ultrabroad coherent spectrum induced by IPM which covered the range from 567 to 897 nm
was obtained and was compared with our previous experiment. This result generally agrees
well with the previous experimental results at the optimum initial delay of -40 fs, which
corresponds to the situation in which two pulses meet at the center of the fiber, where the
spectral width is
Δλ
1/100
= 320 nm. The Fourier transform of the spectrum can yield a 4.0 fs
transform-limited pulse that is the same pulse width of the Fourier-transform-limited pulse
of the previous experimental results. It opens a path for generating a single-cycle high-
energy optical pulse in the near future. It is necessary to use not only fundamental (795 nm)
and signal (640 nm) pulses, but also the idler pulse (1067 nm) of the OPA in order to obtain a
single-cycle (2.66 fs at the center wavelength of 795 nm), which means three-color pulse
propagation in a fiber.
Finally, we obtained the spectral phase after fiber propagation with the calculation. The
extended FDTD method clarified how the two pulse phases maintain their connection with
each other because it includes no assumption for the two-pulse case, which implies that the
method can be used to calculate two different pulses simultaneously with three delays. We
reconfirmed that the spectral phases of two different pulses are connected continuously in
any case of three initial delays. We found in the IPM spectral phase that the DFWM occurs
with an initial delay of -80 fs, which corresponds to the situation in which two pulses meet
at the end of the fiber. To the best of our knowledge, this is the first simultaneous
observation of DFWM and IPM by FDTD simulation.
5. Slowly varying envelope approximation breakdown in fiber propagation
5.1 Slowly varying envelope approximation breakdown
There has recently been significant interest in the generation of single-cycle optical pulses by
optical pulse compression of ultrabroad-band light produced in fibers. There have been
some experiments reported on ultrabroad-band-pulse generation using a silica fiber
(Nakamura et al., 2002a), (Karasawa et al., 2000) and an Ar-gas-filled hollow fiber (Karasawa
et al., 2001), and optical pulse compression by nonlinear chirp compensation (Nakamura et
al., 2002a), (Karasawa et al., 2001) . For these experiments on generating few-optical-cycle
pulses, characterizing the spectral phase of ultrabroad-band pulses analytically as well as
experimentally is highly important.
Conventionally, the slowly varying envelope approximation (SVEA) in the beam
propagation method (BPM) has been used to describe the propagation of an optical pulse in
a fiber. (Agrawal, 1995) However, if the pulse duration approaches that of the optical cycle
regime (<10 fs), this approximation becomes invalid. (Agrawal, 1995) It is necessary to use
the finite-difference time-domain (FDTD) method (Joseph & Taflove, 1997), (Kalosha &
Herrmann, 2000) without SVEA. (Agrawal, 1995) In previous reports, Goorjian and
coworkers (Goorjian et al., 1992)
,
(Joseph et al., 1993)
)
, Joseph and coworkers (Joseph &
Taflove, 1997) (Goorjian et al., 1992)
,
(Joseph et al., 1993)
)
, Taflove and coworkers (Joseph &
Taflove, 1997) (Goorjian et al., 1992)
-
(Taflove & Hagness, 2000) and Hagness and coworkers
(Goorjian et al., 1992), (Taflove & Hagness, 2000), (JGTH) proposed an excellent FDTD
algorithm considering a combination of linear dispersion with one resonant frequency and
nonlinear terms with a Raman response function.
Coherence and Ultrashort Pulse Laser Emission
476
We performed an experiment of 12 fs optical pulse propagation, as described in §4. In order
to compare FDTD calculation results with the experimentally measured ultrabroad-band
spectra of such an ultrashort laser pulse, we extend the JGTH algorithm to that considering
all of the exact Sellmeier fitting values for ultrabroad-band spectra. Because of the broad
spectrum of pulses propagating in the fiber, it becomes much more important to take an
accurate linear dispersion into account. It is well known that at least two resonant
frequencies are required for the linear dispersion to accurately fit the refractive index data.
In a recent report, Kalosha and Herrmann considered the linear dispersion with two
resonant frequencies and the nonlinear terms without the Raman effect.(Kalosha &
Herrmann, 2000). For the single-cycle pulse-generation experiment, we must use at least the
shortest pulse of 3.4 fs (Yamane et al., 2003) or sub-5 fs (Karasawa et al., 2001), (Cheng et al.,
1998) or 7.1 fs (Nakamura et al., 2002a) or the commercially available 12 fs pulses. Such a
time regime is comparable to the Raman characteristic time of 5 fs (Agrawal, 1995) in a silica
fiber. Therefore, it is very important to consider not only an accurate linear dispersion of
silica but also the Raman effect in a silica fiber in the few-optical-cycles regime. In addition,
because of the high repetition rate and pulse intensity stability in particular, ultrabroad-
band supercontinuum light generation and few-optical-cycles pulse generation by nonlinear
pulse propagation in photonic crystal fibers (Ranka et al., 2000) and tapered fibers (Birks et
al., 2000), which are both made of silica, have attracted much attention. We have extended
the FDTD method, (Nakamura et al., 2002b) with nonlinear polarization P
NL
involving the
Raman response function (JGTH-algorithm) to 12 fs ultrabroad-band-pulse propagation in a
silica fiber with the consideration of linear polarization P
L
, including all exact Sellmeier-fitting
values of silica with three resonant frequencies, in order to compare the calculation results with
our experimental results(Nakamura et al., 2002a), (Karasawa et al., 2000b). In this section,
we describe the details of the calculation algorithm of the extended FDTD method
(Nakamura et al., 2002b) and we also compare the extended FDTD method (Nakamura et
al., 2002b) with BPM by applying the split-step Fourier (SSF) method, which is the solution
of a modified generalized nonlinear Schrödinger equation (MGNLSE) (Sone et al., 2002),
with SVEA, precisely considering the same Raman response function as that of the extended
FDTD method, and up to the fifth-order dispersion. Then, in the calculations, the pulse
width is gradually shortened from 12 fs to 7 fs to 4 fs. Moreover, the soliton number N is
established as 1 or 2. To the best of our knowledge, this is the first observation of the
breakdown of SVEA as a function of the laser pulse width and soliton number by
comparison between the extended FDTD (Nakamura et al., 2002b) and BPM calculations for
the nonlinear propagation of a very short (< 12 fs) laser pulse in a silica fiber.
5.2 Beam propagation method
Conventionally, BPM for solving the generalized nonlinear Schrödinger equation (GNLSE)
including SVEA has been used to describe the ultrashort-laser-pulse propagation in an
optical fiber. The GNLSE is expressed as
()
23
23
23
2
22
2
a
R
0
1
2! 3!
2
j
AAA
z
TT
A
j
AjN AA AA TA
TT
ββ
α
ω
∂∂∂
=− +
∂
∂∂
⎡
⎤
∂
∂
⎢
⎥
−+ + −
∂∂
⎢
⎥
⎣
⎦
, (37)
Comparison Between Finite-Difference Time-Domain Method and Experimental Results for
Femtosecond Laser Pulse Propagation
477
22
00 2
NPT
γ
β
= ,
20 eff
()ncA
γ
ω
=
, (38)
where A is the slowly varying amplitude of the pulse envelope of an electric field, which is
normalized by N,
a
α
is the absorption coefficient, j is an imaginary unit, T
0
is the incident
pulse width which is expressed using the full width at half maximum (FWHM) pulse width
t
p
as
0p
(2 ln2)Tt= for a Gaussian pulse and
{
}
0p
2ln(1 2)Tt=+ for a sech
2
pulse, c is
the velocity of light in vacuum,
0
ω
is the center angular frequency of the incident pulse, n
2
is the nonlinear refractive index (m
2
/W), P
0
is the incident pulse peak power,
eff
A
is the
effective core area,
R
T is the Raman time constant and
R
T =5 fs. (Agrawal, 1995)
n
β
( 1, 2, 3, ) n = " is the n-th-order derivative of the propagation constant
0
β
at an incident
center angular frequency
0
ω
is as follows:
0
n
n
n
d
d
ω
ω
β
β
ω
=
⎛⎞
=
⎜⎟
⎜⎟
⎝⎠
. (39)
T is defined as
1
g
z
Tt t z
β
ν
=− =− , (40)
where
g
ν
is the group velocity of the optical pulse, t is time and z is the distance from the
incident edge of a fiber. In our previous letter
(Nakamura et al., 2002b), we also used this
GNLSE for comparison with the extended FDTD method. However, a linear approximation
of the actual Raman gain curve using the Raman time constant of
T
R
= 5 fs (Agrawal, 1995),
which is related to the slope of the Raman gain, and a dispersion approximation up to only
the third-order dispersion terms are included in GNLSE. In this section, we use a more
precise version of the nonlinear Schrödinger equation, MGNLSE (Sone et al., 2002), (Gross &
Manassah, 1992), that includes a Raman response function which is also found in the
extended FDTD and up to fifth-order dispersion as follows:
()
2345
2345
2345
22 2
21
R
0
11
2! 3! 4! 5!
2
a
jj
AAAAA
z
TTTT
j
AjN AA AA A A
T
ββββ
α
χ
ω
−
∂∂∂∂∂
=− + + −
∂
∂∂∂∂
⎡
⎤
∂
⎡⎤
⎡⎤
−+ + +ℑ ℑ
⎢
⎥
⎢⎥
⎣⎦
⎣⎦
∂
⎣
⎦
, (41)
where the symbols
ℑ
and
1
−
ℑ
are the operators of Fourier transformation and inverse
Fourier transformation, and
R
χ
is the generalized Raman-scattering susceptibility. The
generalized Raman-scattering susceptibility (Gross & Manassah, 1992) can be approximated
in the harmonic oscillator model for the molecular vibrations as
0RR
R
2
RRR
()
() ,
j
χ
χ
ΩΓ
Ω=
Ω−Ω−ΓΩ
(42)
where
00
()T
ωω
Ω= − is the angular frequency normalized to the pulse width, and
R
Ω (=13.2 THz ×
0
2 T
π
) (François, 1991) is the Raman shift normalized to the pulse width,
Coherence and Ultrashort Pulse Laser Emission
478
i.e., the molecular vibrational frequency multiplied by T
0
, and
R
Γ
(=15.44 THz×
0
2 T
π
)
(François, 1991) is the normalized phenomenological linewidth.
5.3 Experiment
Figure 1 shows the setup used for the our experiments. (Nakamura et al., 2002a), (Karasawa,
et al., 2000). The 12 fs and 10 nJ pulses (sech
2
) at the center wavelength of 800 nm were
generated from a mode-locked Ti:sapphire laser (Femtolaser GmbH, Femtosource M-1). The
incident pulse width was measured by a fringe-resolved autocorrelator (FRAC). The 12 fs
pulses were coupled into a 2.5 mm silica fiber by a 36x reflective objective (Ealing). The
advantage of this kind of reflective objective is that no additional group-delay dispersion
(GDD) or third-order dispersion (TOD) is introduced to the pulses. The peak power of the
input pulse was 175 kW. A single-mode fused silica fiber (Newport F-SPV) with a core
diameter of 2.64 μm was used. The output from the 2.5 mm fiber was collimated by another
reflective objective and measured by a spectrometer (Ocean Optics, S-2000). The obtained
input and output spectra of the fiber are shown in Fig. 2.
5.4 Numerical results
A.
Comparison between experimental and numerical results
In our calculations for a fused silica fiber, the parameters in eq. (10) are set as b
1
= 0.6961663,
b
2
= 0.4079426, b
3
= 0.8974794,
λ
1
= 0.0684043 μm,
λ
2
= 0.1162414 μm, and
λ
3
= 9.896161 μm
(Agrawal, 1995)
, where
λ
i
= 2πc/
ω
i
and c is the velocity of light in vacuum. We use the value of
the nonlinear refractive coefficient n
2
= 2.48×10
-20
m
2
/W from ref. (Taylor et al., 1996), and
the third-order susceptibility
χ
(3)
is found to be
χ
(3)
= 1.85×10
-22
m
2
/V
2
at 800 nm, as given by
χ
(3)
= (4/3)
ε
0
cn(
ω
0
)
2
n
2
, where
ω
0
is the center angular frequency of the optical pulse. The
parameters
α
,
τ
1
, and
τ
2
in Eq. (15) are set to be
α
= 0.7,
τ
1
= 12.2 fs and
τ
2
= 32 fs
(Agrawal, 1995)
.
A single time step of the finite difference is set as
Δ
t = 4.4475215×10
-17
s at the wavelength of
800 nm. The time step of
Δ
t at 800 nm is defined as the optical cycle at 800 nm of 2.6666667 fs
divided by 60. The time step for the wavelength of 1550 nm is defined by the same rule as
described above.
In the extended FDTD calculation, we set all parameters to be the same as those in our
experiment (Nakamura et al., 2002a), (Karasawa et al., 2000). We compare the results of the
extended FDTD calculation and the SSF calculation with the experimental result for the
pulse peak power of 175 kW in order to generate an ultrabroad spectrum which can finally
be compressed to 7.1 fs (Nakamura et al., 2002a) or shorter. The total fiber length of L = 2.5
mm corresponds to 136,500 spatial steps, which means that L = 136,500×
Δ
z, where
Δ
z is a
unit spatial step in the z direction. We need 293,000 time steps to measure the electric field
up to the complete passage of the pulse tail. The peak power of the input pulse is set to be
175 kW (soliton number N = 2.09). The initial temporal pulse form is assumed to be Fourier-
transformed sech
2
because the mode-locked pulse generally has the sech
2
shape. Hence the
input spectrum is naturally assumed to have a sech
2
shape. The initial pulse width is 12 fs
(FWHM). The effective core area A
eff
is set to be 5.47 μm
2
.
Figure 17(a) shows the results calculated by the extended FDTD Maxwell equation method
(A), the solution of MGNLSE obtained using the SSF method with SVEA (B) (up to the fifth-
order dispersion terms with the Raman term using the Raman response function), and our
previously reported experimental result (Karasawa et al., 2000) (C). It is seen that with
Comparison Between Finite-Difference Time-Domain Method and Experimental Results for
Femtosecond Laser Pulse Propagation
479
600 800 1000
0
1
600 800 1000 1200
0
1
FDTD (A)
No Raman
SVEA (B)
FDTD (A)
Exp. (C)
FDTD (D)
Wavelength (nm)
Intensity (arb. units )
Wavelength (nm)
Intensity (arb. units )
Exp. (C)
(a)
(b)
Fig. 17. (a) Spectra of 12 fs laser transmission through a 2.5 mm silica fiber calculated using
(A) the extended FDTD Maxwell equation considering all orders of dispersions and the
Raman response [α = 0.7 in eq. (15)] and (B) the solution of MGNLSE obtained using the SSF
method with SVEA (considering up to 5th-order dispersion terms and the Raman term
using the Raman response function), and (C) our previously reported experimental result
(Karasawa et al., 2000), where the incident laser intensity corresponds to the soliton number
of 2.09. (b) Spectra calculated by the FDTD Maxwell equation method (D) without the
Raman response [α = 1 in eq. (15)] and (A) with the Raman response. (A) and (C) are the
same as those in (a). (Nakamura et al., 2004)
SVEA (B), the spectral intensity at short wavelengths and at long wavelengths is much
higher and slightly higher than those for FDTD (A) and the experimental result (C),
respectively. The shortest wavelengths (intensity of 1%) of the spectra of FDTD (A), SVBA
(B) and the experimental result (C) are 600 nm, 560 nm and 600 nm, respectively. The
longest wavelengths of FDTD (A), SVBA (B) and the experimental result (C) are 1160 nm,
1240 nm and 1016 nm (maximum measurable wavelength of spectrometer), respectively.
The FWHM spectral bandwidths Δ
λ
of FDTD (A), SVBA (B) and the experimental result (C)
are 172 nm, 214 nm and 136 nm, respectively. Thus the spectral bandwidth of the
experimental result (C) is narrow and that of FDTD (A) is closer to the experimental result
(C) than is that of SVEA (B). This indicates that the extended FDTD directly solving Maxwell
equation is superior to BPM in which MGNLSE (Sone et al., 2002) is solved by SSF with
SVEA. The Raman response function (Gross et al., 1992), which is also included in the
extended FDTD, and up to the fifth-order dispersion terms are accurately included in BPM
for solving MGNLSE (Sone et al., 2002) by SSF with SVEA (B). However, in BPM for solving
MGNLSE by SSF with SVEA, the second derivative of the electric field with respect to z,
22
/
y
Ez∂∂, is neglected, which corresponds to neglecting the backward-propagating wave.
On the other hand, our extended FDTD Maxwell equation method (A) accurately includes
the delayed Raman response and all orders of dispersion in silica using Sellmeier’s equation,
Coherence and Ultrashort Pulse Laser Emission
480
and does not require SVEA. Thus, the difference between (A) and (B) is considered to be due
to the higher order (more than 6th order) dispersion effect, or the backward-propagating
wave. For wavelengths longer than 800 nm in Fig. 17(a), the extended FDTD result and the
BPM result are similar but the intensity of the experimental data is lower than those of both
calculated results. We assume the sensitivity of the spectrometer detector to be low at
wavelengths longer than 800 nm because the detector is made of silicon. We believe our
extended FDTD result is accurate. We suggest that it is better to use an IR detector made of a
material such as InGaAs for the spectrometer.
Next, in order to clarify the importance of the Raman response, we performed a calculation
using (D) the FDTD Maxwell equation method without the Raman response [
α
= 1 in eq.
(15)], as shown in Fig. 17(b), where (A) and (C) show the same data as those in Fig. 1(a). In
Fig. 17(b), the spectrum for case (A) is closer to the experimental result (C) than that of the
case of FDTD in which the Raman effect is not considered (D). It is evident that by including
the Raman term (A), the spectral intensity at a shorter wavelength is lower, and the
agreement between the experimental and calculated results becomes better than that in the
case of (D). For example, the spectral intensity at 700 nm in (D) is 48% higher than that in
(A), which is almost the same as that in the experimental result (C). On the other hand, at a
longer wavelength, for example, 850 nm, the spectral intensity of (A) is 15% higher than that
of (D). This feature of (A) shows a tendency analogous to that of (C) because there is a
higher peak at 850 nm than at the center wavelength of 800 nm in (C). These tendencies of
the spectral characteristics indicate that it is important to include the Raman term.
B. Observations of breakdown of SVEA
We calculate the time profiles and spectra in silica fibers with lengths of 0 to 2L
D
, where L
D
is
the dispersion length, with Gaussian input pulses of 12 fs, 7 fs and 4 fs duration (FWHM) at
the center wavelengths of 800 nm and 1550 nm which simulate the normal group-velocity
dispersion (GVD) and anomalous GVD, respectively. The dispersion lengths L
D
at 800 nm
and 1550 nm are 1.4364 mm and 1.8586 mm for the 12 fs pulse, respectively. Power regions
in this calculation are selected to be sufficiently small to enable comparison with results
based on the previous theory (Karasawa et al., 200b), (Agrawal, 1995), which means that we
normalize the peak power of the input pulse by a soliton parameter of N = 1.
Figures 18(a) and 18(b) show the time profiles of the output pulses from the silica fiber with
incident pulse width of 12 fs and fiber lengths of 0 to 2L
D
, where L
D
is the dispersion length
(Agrawal, 1995), calculated by the extended FDTD and BPM with SVEA, respectively. The
dispersion length L
D
for 12 fs pulses at 800 nm is 1.4364 mm. The pulse widths simply
broaden with propagation in the normal dispersion regime, as shown in Figs. 18(a) and
18(b), because both GVD and self-phase modulation (SPM) (Agrawal, 1995) produce up-
chirp in normal dispersion. Figures 18(c) and 18(d) show the Fourier-transformed spectra of
Figs. 18(a) and 18(b), where
ν
and
ν
0
are the frequency and the center frequency of the
pulse, respectively. The symmetric spectral broadening due to the SPM effect is seen in the
normal dispersion regime, as shown in Figs. 18(c) and 18(d).
Figure 19 show the case of the pulse width of 7 fs under the same definitions of (a) to (d) as
in Fig. 18, where the dispersion length L
D
for 7 fs pulses at 800 nm is 0.48939 mm. This figure
indicates that pulse width broadening by positive GVD and spectral broadening by the SPM
effect are greater than those in Fig. 18, and there is no difference between the results
calculated using FDTD [Figs. 19(a) and 19(c)] and BPM [Figs. 19(b) and 19(d)]. This means
Comparison Between Finite-Difference Time-Domain Method and Experimental Results for
Femtosecond Laser Pulse Propagation
481
that there is no breakdown of SVEA. Figure 20 shows the case of the pulse width of 4 fs
under the same definitions of (a) to (d) as in Figs. 18 and 19, where the dispersion length L
D
for 4 fs pulses at 800 nm is 0.15980 mm. This figure also indicates that pulse width
broadening and spectral broadening effects are greater than those in Figs. 18 and 19, and
there is again no difference between the results calculated using FDTD [Figs. 20(a) and 20(c)]
and BPM [Figs. 20(b) and 20(d)]. However, focusing on the case of z = 2L
D
in Fig. 20(a)
calculated by the extended FDTD, we see that the main peak is slightly doubled or slightly
dipped. On the other hand, only one peak exists in the results of BPM in Fig. 20(b). In this
case, a very small difference is found but it need not be taken into account. That is, there is
no breakdown of SVEA even in the case of a pulse width of 4 fs. It is very useful to know
that we can use BPM even for extremely short pulses of 4 fs without breakdown of SVEA in
the case of a soliton number of 1 in the normal GVD region.
–100 0 100
0
0.5
1
Intensity (arb. units)
Time T (fs)
Z=0
Z=L
D
Z=2L
D
=800 nm
T = 12 fs
FWHM
(a) FDTD
λ
0
–100 0 100
0
0.5
1
Intensity (arb. units)
Time T (fs)
Z=0
Z=L
D
Z=2L
D
=800 nm
T = 12 fs
FWHM
(b) BPM
λ
0
–100 0 100
0
0.5
1
Normalized Intensity (arb. units)
Frequency (THz)
Z=0
Z=L
D
Z=2L
D
=800 nm
=375.0 THz
(c) FDTD
ν
0
λ
0
ν−ν
0
–100 0 100
0
0.5
1
Normalized Intensity (arb. units)
Frequency (THz)
Z=0
Z=L
D
Z=2L
D
=800 nm
=375.0 THz
(d) BPM
ν
0
ν−ν
0
λ
0
Fig. 18. (a), (b) Temporal profiles and (c), (d) spectra numerically obtained by (a), (c) the
extended FDTD method and (b), (d) BPM for 12 fs, 800 nm laser propagation through a silica
fiber of up to twice the dispersion length L
D
, where the laser intensity corresponds to the
soliton number of 1. (Nakamura et al., 2004)
Coherence and Ultrashort Pulse Laser Emission
482
–50 0 50
0
0.5
1
Intensity (arb. units)
Time T (fs)
Z=0
Z=L
D
Z=2L
D
=800 nm
T = 7 fs
FWHM
(a) FDTD
λ
0
–50 0 50
0
0.5
1
Intensity (arb. units)
Time T (fs)
Z=0
Z=L
D
Z=2L
D
=800 nm
T = 7 fs
FWHM
(b) BPM
λ
0
–200 –100 0 100 200
0
0.5
1
Normalized Intensity (arb. units)
Frequency (THz)
Z=0
Z=L
D
Z=2L
D
=800 nm
=375.0 THz
(c) FDTD
ν
0
ν−ν
0
λ
0
–200 –100 0 100 200
0
0.5
1
Normalized Intensity (arb. units)
Frequency (THz)
Z=0
Z=L
D
Z=2L
D
=800 nm
=375.0 THz
(d) BPM
ν
0
λ
0
ν−ν
0
Fig. 19. (a), (b) Temporal profiles and (c), (d) spectra numerically obtained by (a), (c) the
extended FDTD method and (b), (d) BPM for 7 fs, 800 nm laser propagation through a silica
fiber of up to twice the dispersion length L
D
, where the laser intensity corresponds to the
soliton number of 1. (Nakamura et al., 2004)
On the other hand, in the anomalous dispersion regime, it is seen in Figs. 21(a) and 21(b)
that the pulse widths do not vary with pulse evaluation because the soliton effects
(Agrawal, 1995) occur as a result of interplay between SPM and anomalous GVD. The
dispersion length L
D
for 12 fs pulses at 1550 nm is 1.8586 mm. However, the details of Figs.
21(a) and 21(b) show that the pulse peaks are delayed and appear shifted toward the trailing
side with propagation. This is due to self-steepening. (Agrawal, 1995) There are three small
peaks following the main peak. These are formed by third-order or higher dispersions. In
Figs. 21(a) and 21(b), the second largest peaks slightly differ from each other, and this
difference also exists in Figs. 22(a) and 22(b). Figures 21(c) and 21(d) show the Fourier-
transformed spectra of Figs. 21(a) and 21(b), where
ν
and
ν
0
are the frequency and the
center frequency of the pulse, respectively. There is no obvious change of spectral
broadening, as shown in Figs. 21(c) and 21(d), because the fundamental soliton is generated,
as already described.
Comparison Between Finite-Difference Time-Domain Method and Experimental Results for
Femtosecond Laser Pulse Propagation
483
–50 0 50
0
0.5
1
Intensity (arb. units)
Time (fs)
Z=0
Z=L
D
Z=2L
D
λ
0
T = 4 fs
FWHM
(a) FDTD
=800 nm
–50 0 50
0
0.5
1
Intensity (arb. units)
Time (fs)
Z=0
Z=L
D
Z=2L
D
=800 nm
T = 4 fs
FWHM
(b) BPM
λ
0
–250 0 250
0
0.5
1
Normalized Intensity (arb. units)
Frequency (THz)
Z=0
Z=L
D
Z=2L
D
=800 nm
ν
0
(c) FDTD
=375.0 THz
λ
0
ν−ν
0
–250 0 250
0
0.5
1
Normalized Intensity (arb. units)
Frequency (THz)
Z=0
Z=L
D
Z=2L
D
=800 nm
=375.0 THz
(d) BPM
ν
0
ν−ν
0
λ
0
Fig. 20. (a), (b) Temporal profiles and (c), (d) spectra numerically obtained by (a), (c) the
extended FDTD method and (b), (d) BPM for 4 fs, 800 nm laser propagation through a silica
fiber of up to twice the dispersion length L
D
, where the laser intensity corresponds to the
soliton number of 1. (Nakamura et al., 2004)
Coherence and Ultrashort Pulse Laser Emission
484
–50 0 50
0
0.5
1
Intensity (arb. units)
Time T (fs)
Z=0
Z=L
D
Z=2L
D
=1550 nm
T = 12 fs
FWHM
(a) FDTD
λ
0
–50 0 50
0
0.5
1
Intensity (arb. units)
Time T (fs)
Z=0
Z=L
D
Z=2L
D
=1550 nm
T = 12 fs
FWHM
(b) BPM
λ
0
–100 0 100
0
0.5
1
Normalized Intensity (arb. units)
Frequency (THz)
Z=0
Z=L
D
Z=2L
D
=1550 nm
=193.5 THz
(c) FDTD
ν
0
ν−ν
0
λ
0
–100 0 100
0
0.5
1
Normalized Intensity (arb. units)
Frequency (THz)
Z=0
Z=L
D
Z=2L
D
=1550 nm
=193.5 THz
(d) BPM
ν
0
ν−ν
0
λ
0
Fig. 21. (a), (b) Temporal profiles and (c), (d) spectra numerically obtained by (a), (c) the
extended FDTD method and (b), (d) BPM for 12 fs, 1550 nm laser propagation through a
silica fiber of up to twice the dispersion length L
D
, where the laser intensity corresponds to
the soliton number of 1. (Nakamura et al., 2004)
Comparison Between Finite-Difference Time-Domain Method and Experimental Results for
Femtosecond Laser Pulse Propagation
485
–50 0 50
0
0.5
1
Intensity (arb. units)
Time T (fs)
Z=0
Z=L
D
Z=2L
D
=1550 nm
T = 7 fs
FWHM
(a) FDTD
λ
0
–50 0 50
0
0.5
1
Intensity (arb. units)
Time T (fs)
Z=0
Z=L
D
Z=2L
D
=1550 nm
T = 7 fs
FWHM
(b) BPM
λ
0
–250 0 250
0
0.5
1
Normalized Intensity (arb. units)
Frequency (THz)
Z=0
Z=L
D
Z=2L
D
=1550 nm
=193.5 THz
(c) FDTD
ν
0
ν−ν
0
λ
0
–250 0 250
0
0.5
1
Normalized Intensity (arb. units)
Frequency (THz)
Z=0
Z=L
D
Z=2L
D
=1550 nm
=193.5 THz
(d) BPM
ν
0
λ
0
ν−ν
0
Fig. 22. (a), (b) Temporal profiles and (c), (d) spectra numerically obtained by (a), (c) the
extended FDTD method and (b), (d) BPM for 7 fs, 1550 nm laser propagation through a silica
fiber of up to twice the dispersion length L
D
, where the laser intensity corresponds to the
soliton number of 1. (Nakamura et al., 2004)
However, it is seen that there is a small spectral continuum component from
ν
−
ν
0
= 20 to
120 THz in Figs. 22(c) and 22(d). This feature is due to blue shift (Agrawal, 1995) by self-
steepening. This effect becomes more obvious in the case of the pulse widths of 7 fs [Figs.
22(c) and 22(d)] and 4 fs [Figs.23(c) and 23(d)], where the dispersion lengths L
D
for 7 fs and 4
fs pulses at 1550 nm are 0.63324 mm and 0.20677 mm, respectively. We also note that the
spectra at z = 2L
D
in Figs. 21(c) and 21(d) shift slightly to a lower frequency due to the
Raman effect. (Agrawal, 1995) The Raman shift in Fig. 21(c) is larger than that in Fig. 21(d).
This Raman effect also become more obvious in the case of the pulse widths of 7 fs [Figs.
22(c) and 22(d)] and 4 fs [Figs.23(c) and 23(d)], and the Raman shift difference between (c)
and (d) become smaller with decreasing pulse width. In terms of the Raman effect, FDTD
and BPM result in analogous behavior. On the other hand, the behavior of blue shift differs
between Fig. 23(c) and Fig. 23(d). The second largest slow perceptible peak exists from
ν−ν
0
= 100 to 200 THz in Fig. 23(d), but the frequency region is a small continuum in Fig. 23(c).
Coherence and Ultrashort Pulse Laser Emission
486
From the total viewpoint of the anomalous region, the breakdown of SVEA is tolerant in 12
fs, however, in the time region shorter than 7 fs, the breakdown cannot be ignored.
Through these calculations, we successfully demonstrated the dispersion and SPM effect
(Agrawal, 1995), soliton propagation at 1550 nm, self-steepening, and the Raman effect.
Furthermore it was found that BPM and the extended FDTD results are almost the same in
the normal GVD region, and SVEA does not break down in the cases of incident pulse
widths of 12 fs, 7 fs, and 4 fs and soliton number of N = 1 in the normal dispersion frequency
region, as well as in the case of the incident pulse width of 12 fs and soliton number of N = 1
in the anomalous dispersion frequency region.
–50 0 50
0
0.5
1
Intensity (arb. units)
Time T (fs)
Z=0
Z=L
D
Z=2L
D
=1550 nm
T = 4 fs
FWHM
(a) FDTD
λ
0
–50 0 50
0
0.5
1
Intensity (arb. units)
Time T (fs)
Z=0
Z=L
D
Z=2L
D
=1550 nm
T = 4 fs
FWHM
(b) BPM
λ
0
–250 0 250
0
Normalized Intensity (arb. units)
Frequency (THz)
Z=0
Z=L
D
Z=2L
D
=1550 nm
=193.5 THz
(c) FDTD
ν
0
ν−ν
0
λ
0
–250 0 250
0
0.5
1
Normalized Intensity (arb. units)
Frequency (THz)
Z=0
Z=L
D
Z=2L
D
=1550 nm
=193.5 THz
(d) BPM
ν
0
ν−ν
0
λ
0
Fig. 23. (a), (b) Temporal profiles and (c), (d) spectra numerically obtained by (a), (c) the
extended FDTD method and (b), (d) BPM for 4 fs, 1550 nm laser propagation through a silica
fiber of up to twice the dispersion length L
D
, where the laser intensity corresponds to the
soliton number of 1. (Nakamura et al., 2004)
Comparison Between Finite-Difference Time-Domain Method and Experimental Results for
Femtosecond Laser Pulse Propagation
487
–100 0 100
0
0.5
1
Intensity (arb. units)
Time T (fs)
Z=0
Z=L
D
Z=2L
D
=1550 nm
T = 12 fs
FWHM
(a) FDTD
λ
0
N = 2
–100 0 100
0
0.5
1
Intensity (arb. units)
Time T (fs)
Z=0
Z=L
D
Z=2L
D
=1550 nm
T = 12 fs
FWHM
(b) BPM
λ
0
N = 2
–250 0 250
0
0.5
1
Normalized Intensity (arb. units)
Frequency (THz)
Z=0
Z=L
D
Z=2L
D
=1550 nm
=193.5 THz
ν
0
ν−ν
0
λ
0
(c) FDTD
–250 0 250
0
0.5
1
Normalized Intensity (arb. units)
Frequency (THz)
Z=0
Z=L
D
Z=2L
D
=1550 nm
=193.5 THz
(d) BPM
ν
0
λ
0
ν−ν
0
Fig. 24. (a), (b) Temporal profiles and (c), (d) spectra numerically obtained by (a), (c) the
extended FDTD method and (b), (d) BPM for 12 fs, 1550 nm laser propagation through a
silica fiber of up to twice the dispersion length L
D
, where the laser intensity corresponds to
the soliton number of 2. (Nakamura et al., 2004)
Although we obtained extended FDTD results which could be explained by the previous
theory (Agrawal, 1995) and could verify the validity of our calculation method, the physical
behavior of very short pulses will be different when the peak power is four times larger than
that in the case of N = 1, which makes the breakdown of SVEA possible even for long pulses.
We have already shown the breakdown of SVEA in a comparison of experimental and
numerical results for the positive dispersion area with N = 2.09 for 12 fs pulse propagation
in the fiber. Thus, we perform calculations for N = 2 and the anomalous dispersion area.
Figure 24 shows (a), (b) temporal profiles and (c), (d) spectra numerically obtained by (a), (c)
the extended FDTD method and (b), (d) BPM for 12 fs, 1550 nm laser propagation through a
silica fiber of up to z = 2L
D
, where the laser intensity corresponds to the soliton number N of
2. This figure shows that the breakdown of SVEA occurs in BPM for even a long pulse width
of 12 fs. For the spectra shown in Figs.24(c) and 24(d), the height of the second largest peak
Coherence and Ultrashort Pulse Laser Emission
488
in Fig. 24(d) is twice that in Fig. 10(c). In the temporal profiles of Figs. 24(a) and 24(b), the
main peaks have the same form, however numerous small-peak characteristics from 20 fs to
80 fs are different. The small peaks in Fig. 24(a) are larger and more obvious than those in
Fig. 24(b). These results imply that SVEA of MGNLSE in BPM, as assumed in Figs. 24(b) and
24(d), breaks down in the case of N = 2 in the anomalous GVD region for 12 fs pulse
propagation.
5.5 Summary of SVEA breakdown
We have extended the nonlinear FDTD method with a JGTH algorithm to one with exact
Sellmeier fitting values in order to compare the experimental and calculated results of
nonlinear femtosecond ultrabroad-band-pulse propagation in a silica fiber, and have
analyzed the spectral characteristics of the propagated pulse. This extended method is
robust against the breakdown of the SVEA. The spectrum obtained in our previous
experiment agrees better with the spectrum calculated by the extended FDTD method than
with that calculated by the solution of MGNLSE obtained using the SSF method with SVEA.
Consequently, we confirmed that the various nonlinear physical phenomena in an optical
fiber can be described by FDTD methods even in a nearly single-cycle time regime, and that
SVEA in BPM is invalid in the case of pulse widths less than 4 fs with the soliton number of
1 at 800 nm, which is the normal dispersion regime, and in the case of pulse widths less than
7 fs with the soliton number of 1 at 1550 nm, which is the anomalous dispersion regime. In
the case of the soliton number of 2, the breakdown of SVEA occurs for 12 fs pulses in both
the normal and anomalous dispersion frequency regimes. To the best of our knowledge, this
is the first observation of the breakdown of SVEA as a function of laser pulse width and
soliton number by comparison of the extended FDTD and BPM calculations for the
nonlinear propagation of an ultrashort (< 12 fs) laser pulse in a silica fiber. If the extended
FDTD method can be established as an ultrashort-optical-pulse propagation analysis
technique, its application to analyses of the characteristics of an ultrahigh-speed optical
switch, the propagation characteristic of optical pulses in a photonic crystal, and the
nonlinear propagation in a photonic crystal fiber or a tapered fiber can be expected.
6. Conclusion
Conventionally, the BPM for solving the GNLSE including the SVEA has been used to
describe the ultrashort laser pulse propagation in an optical fiber. However, if the pulse
duration approaches the optical cycle regime (<10 fs), this approximation becomes invalid.
Then, it becomes necessary to use the FDTD method for solving the Maxwell equation with
the least approximation. In order to both experimentally and numerically investigate
nonlinear femtosecond ultrabroad-band-pulse propagation in a silica fiber, we have
extended the FDTD calculation of Maxwell's equations with nonlinear terms to that
including all exact Sellmeier-fitting values. We have compared the results of this extended
FDTD method with experimental results for the nonlinear propagation of a very short (12-fs)
chirped laser pulse in a silica fiber. We obtain the fiber output pulse compressed to 7 fs by
the simulation of group delay compensation under the assumption of using an SLM. To our
knowledge, this is the first comparison between FDTD calculation and experimental results
for nonlinear propagation of a very short (12-fs) chirped pulse in a silica fiber.
Comparison Between Finite-Difference Time-Domain Method and Experimental Results for
Femtosecond Laser Pulse Propagation
489
Next, experimental results of nonlinear propagation with the IPM effect of two-color 120 fs
laser pulses with three different initial delays in a silica fiber were analyzed with FDTD
calculations, including SPM, IPM, and DFWM in the fused-silica fiber. Initial delay
dependence by the FDTD qualitatively agrees with the previous experimental results. An
ultrabroad spectrum induced by IPM mostly agrees with the previous experimental results
that had the optimum initial delay. A Fourier transform of this spectrum yields a 4 fs optical
pulse, which agrees with the previous experimental results. The spectral phases of two
different pulses with three different initial delays are connected continuously. The IPM
spectral phase obtained by the extended FDTD shows that the DFWM occurs. To the best of
our knowledge, this is the first observation of DFWM with IPM by the FDTD simulation.
Finally, We compared the results of this extended FDTD method with the solution of the
BPM that includes the Raman response function, which is the same as in the extended FDTD
method, up to fifth-order dispersion with the SVEA, as well as with the experimental results
for nonlinear propagation of a 12 fs laser pulse in a silica fiber. Furthermore, in only the
calculation, pulse width was gradually shortened from 12 fs to 7 fs to 4 fs to observe the
breakdown of the SVEA in detail. Moreover, the soliton number N was established as 1 or 2.
To the best of our knowledge, this is the first observation of the breakdown of the SVEA by
comparison between the results of the extended FDTD and the BPM calculations for the
nonlinear propagation of an ultrashort (< 12 fs) laser pulse in a silica fiber.
7. References
Agrawal, G. A. (1995). Nonlinear Fiber Optics 2nd ed., Academic Press, ISBN 978-0123743022,
San Diego CA, Chaps. 1 and 2.
Birks, T. A.; Wadsworth, W. J. & Russell, P. St. J. (2000). Supercontinuum generation in
tapered fibers. Opt. Lett., Vol. 25, No. 19, (Oct., 2000) 1415-1417, ISSN 0146-9592.
Cheng, Z.; Tempea,; Brabec, G. T.; Ferencz, K.; Spielman, C. & Krausz, F. (1998). Generation
of Intense Diffraction-Limited White Light and 4-fs Pulses. in Ultrafast Phenomena
XI,
Elsaesser, T.; Fujimoto, J. G.; Wiersma D. A. & Zinth, W., 8-10, Springer, ISBN
978-3540654308, Berlin.
Cundiff, S. T.; Collings, B. C.; Boivin, L.; Bergman, M. C.; Knox W. H. & Evangelides, Jr. S. G.
(1999). Propagation of highly chirped pulses in fiber-optic communications systems.
IEEE J. Lightwave Technol., Vol. 17, No. 5, (May, 1999) 811–816, ISSN 0733-8724.
François, P. L. (1991). Nonlinear propagation of ultrashort pulses in optical fibers: total field
formulation in the frequency domain. J. Opt. Soc. Am. B, Vol. 8, No. 2 (Feb. 1991)
276-293, ISSN 0740-3224.
Fujii, M.; Tahara, M.; Sakagami, I; Freude, W. & Russer, P. (2004). High-Order FDTD and
Auxiliary Defferntial Equation Formulation of Optical Pulse Propagation in 2-D
Kerr and Raman Nonlinear Dispersive Media. IEEE Journal of Quantum Electronics,
Vol. 40, No. 2, (Feb., 2004) 175-182, ISSN 0018-9197.
Geraghty, D. F.; Lee, R. B.; Verdiell, M.; Ziari, M.; Mathur, A & Vahala, K. J. (1998).
Wavelength conversion by four-wave mixing in semiconductor optical amplifiers.
IEEE Photonics Technol. Lett., Vol. 10, No. 1, (Jan., 1998) 69-71, ISSN 1041-1135.
Goorjian, P. M.; Taflove, A.; Joseph, R. M. & Hagness, S. C. (1992). Computational modeling
of femtosecond optical solitons from Maxwell’s equations. IEEE J. Quantum.
Electron., Vol. 28, No. 10, (Oct. 1992) 2416-2422, ISSN 0018-9197.
Coherence and Ultrashort Pulse Laser Emission
490
Goorjian, P. M.& Cundiff, S. T.(2004). Nonlinear effects on the carrier-envelope phase. Opt.
Lett., Vol. 29, No. 12, (June, 2004) 1363-1365, ISSN 0146-9592.
Gross, B. & Manassah J. T. (1992). Supercontinuum in the anomalous group-velocity
dispersion region J. Opt. Soc. Am. B, Vol. 9, No. 10, (Oct., 1992) 1813-1818, ISSN 0740-
3224.
Joseph, R. M.; Goorjian, P. M. & Taflove, A. (1993). Direct time integration of Maxwell’s
equations in 2-D dielectric waveguides for propagation and scattering of
femtosecond electromagnetic solitons. Optics Letters, Vol. 18, No. 7, (Apr., 1993), 491-
493, ISSN 0146-9592.
Joseph, R. M. & Taflove, A. (1997). FDTD Maxwell’s equations models for nonlinear
electrodynamics and optics. IEEE Trans. Antenas Propagat., Vol. 45, No. 3, (Mar.,
1997), 364-374, ISSN 0018-926X.
Kalosha, V. P. & Herrmann, J. (2000). Self-phase modulation and compression of few-optical-
cycle pulses. Phys. Rev. A, Vol. 62, No. 1, (June, 2000) R11804.1-R11804.4, ISSN 1050-
2947.
Karasawa, N.; Nakamura, S.; Morita, R.; Shigekawa, H. & Yamashita, M. (2000) Comparison
between theory and experiment of nonlinear propagation for 4.5-cycle optical
pulses in a fused-silica fiber. Nonlinear Opt., Vol. 24, (Dec. 2000). 133-138, ISSN
1058-7268.
Karasawa, N.; Morita, R.; Shigekawa, H. & Yamashita M. (2000b). Generation of intense
ultrabroadband optical pulses by induced phase modulation in an argon-filled
single-mode hollow waveguide. Opt. Lett., Vol.25, No. 3, (Feb., 2000) 183-185, ISSN
0146-9592.
Karasawa, N.; Li, L.; Suguro, A.; Shigekawa, H.; Morita, R. & Yamashita, M. (2001) Optical
pulse compression to 5.0 fs using only a spatial light modulator. J. Opt. Soc. Am. B,
Vol. 18, No. 11, (Nov., 2001) 1742-1746, ISSN 0740-3224.
Karasawa, N.; Nakamura, S.; Nakagawa, N.; Shibata, M.; Morita, R.; Shigekawa, H.&
Yamashita, M. (2001b). Comparison between theory and experiment of nonlinear
propagation for a-few-cycle and ultrabroadband optical pulses in a fused-silica fiber
IEEE J. Quantum Electron, Vol. 37, No.3, (Nov. 2001) 398-404, ISSN 0018-9197.
Malitson, I. H. (1965). Interspecimen comparison of the refractive index of fused silica. J. Opt.
Soc. Am., Vol. 55, No. 10, (Oct. 1965), 1205-1208, ISSN 0740-3224.
Nakamura, S.; Li, L.; Karasawa, N.; Morita, R.; Shigekawa, H. & Yamashita, M. (2002a).
Measurements of Third-Order Dispersion Effects for Generation of High-
Repetition-Rate, Sub-Three-Cycle Transform-Limited Pulses from a Glass Fiber.
Jpn. J. Appl. Phys., Vol. 41, No. 3A, (Mar. 2002) 1369-1373, ISSN 0021-4922.
Nakamura, S.; Koyamada, Y.; Yoshida, N.; Karasawa, N.; Sone, H.; Ohtani, M.; Mizuta, Y.;
Morita, R.; Shigekawa, H. & Yamashita M. (2002b). Finite-Difference Time-Domain
Calculation with All Parameters of Sellmeier's Fitting Equation for 12-fs Laser Pulse
Propagation in a Silica Fiber. IEEE Photon. Technol. Lett., Vol. 14, No.4, (Apr. 2002)
480-482, ISSN 1041-1135.
Nakamura, S.; Takasawa, N.; Saeki, T. & Koyamada, Y. (2004a). Numerical Analysis of
Induced Phase Modulation between Two Ultrashort Pulses in a Silica Fiber by
Using the Extended Finite-Difference Time-Domain Method. Opt. Rev., Vol. 11, No.
2, (Mar./Apr., 2004) 68-71, ISSN 1340-6000.
Comparison Between Finite-Difference Time-Domain Method and Experimental Results for
Femtosecond Laser Pulse Propagation
491
Nakamura, S; Saeki, T & Koyamada, Y. (2004b). Observation of Slowly Varying Envelope
Approximation Breakdown by Comparison between the Extended Finite-
Difference Time-Domain Method and the Beam Propagation Method for
Ultrashort-Laser-Pulse Propagation in a Silica Fiber. Japanese Journal of Applied
Physics, Vol. 43, No. 10A, (Oct., 2004) 7015-7025, ISSN 0021-4922.
Nakamura, S; Takasawa, N. & Koyamada, Y. (2005a). Comparison between Finite-Difference
Time-Domain Calculation with All Parameters of Sellmeier's Fitting Equation and
Experimental Results for Slightly Chirped 12 fs Laser Pulse Propagation in a Silica
Fiber. IEEE Journal of Lightwave Technology, Vol. 23, No. 2, (Feb., 2005) 855-863, ISSN
0733-8724.
Nakamura, S; Takasawa, N. & Koyamada, Y.; Sone, H.; Xu, L.; Morita, R. & Yamashita, M.
(2005b). Extended Finite Difference Time Domain Analysis of Induced Phase
Modulation and Four-Wave Mixing between Two-Color Femtosecond Laser Pulses
in a Silica Fiber with Different Initial Delays. Japanese Journal of Applied Physics, Vol.
44, No. 10, (Oct., 2005) 7453-7459, ISSN 0021-4922.
Ranka, J. K.; Windeler, R. S. & Stentz, A. J. (2000). Visible continuum generation in air-silica
microstructure optical fibers with anomalous dispersion at 800 nm. Opt. Lett., Vol.
25, No. 1, (Jan., 2000), 25-27, ISSN 0146-9592.
Shibata, M.; Hirasawa, M.; Nakagawa, N.; Morita, R.; Suguro, A.; Shigekawa, H. &
Yamashita, M. (2002). Experimental demonstration of phase-dispersion
compensation for ultra-broadband femtosecond optical pulses generated by
induced-phase modulation. Appl. Phys. B, Vol. 74, No. 1, (July, 2002) s291-s294, ISSN
0946-2171.
Sone, H.; Arai, T.; Imai, M. & Imai Y. (2002). Modal Birefringence Dependent
Supercontinuum Due to Cross-Phase Modulation in a Dispersion-
Flattened/Decreasing Fiber. Optical Review, Vol. 9, No. 3, (May/Jun., 2002) 89-93,
ISSN 1340-6000.
Taflove, A. & Hagness, S. C. (2000). Computational Electrodynamics: The Finite-Difference Time-
Domain Method, 2nd ed., Artech House, ISBN 978-1580538329, Norwood MA,
Chapter 9, Section 9.6 (pp. 398-401).
Taylor, A. J.; Rodriguez, G. R. & Clement, T. S. (1996). Determination of n
2
by direct
measurement of the optical phase. Opt. Lett., Vol. 21, No. 22, (Nov., 1996), 1812-1814
ISSN 0146-9592.
Xu, L; Karasawa, N.; Nakagawa, N.; Morita, R.; Shigekawa, H. & Yamashita, M. (1999).
Experimental generation of an ultra-broad spectrum based on induced-phase
modulation in a single-mode glass fiber. Opt. Commun, Vol. 162, No. 4-6, (Apr.,
1999) 256-260, ISSN 0946-2171.
Yamane, K.; Zhang, Z.; Oka, K.; Morita, R.; Yamashita, M. & Suguro, A. (2003). Optical pulse
compression to 3.4 fs in the monocycle region by feedback phase compensation.
Opt. Lett., Vol. 28, no. 22, (Nov. 2003) 2258-2260, ISSN 0146-9592.
Yamashita, M; Hirasawa, M.; Nakagawa, N.; Yamamoto, K.; Oka, K.; Morita, R. & Suguro A.
(2004). Pulse compression of white-light continuum generated by induced phase
modulation in a conventional glass fiber. J. Opt. Soc. Am. B, Vol. 21, No. 2, (Feb.,
2004) 458-462, ISSN 0740-3224.
Yamashita, M.; Sone, H.; Morita, R.; & Shigekawa, H. (1998). Generation of monocycle-like
optical pulses using induced-phase modulation between two-color femtosecond
Coherence and Ultrashort Pulse Laser Emission
492
pulses with carrier phase locking. IEEE J. Quantum Electron, Vol. 34, No. 11, (Nov.,
1998) 2145-2149, ISSN 0018-9197.
Yamashita, M.; Sone, H. & Morita, R. (1996). Proposal for Generation of a Coherent Pulse
Ultra-Broadened from Near-Infrared to Near-Ultraviolet and Its Monocyclization.
Jpn. J. Appl. Phys., Vol. 35, (Aug., 1996) L1194-L1197, ISSN 0021-4922.
21
Non Perturbative Time-Dependent Density
Functional Theory, TDDFT: Study of
Ionization and Harmonic Generation in
Linear Di-(N
2
) and Tri-(CO
2
, OCS, CS
2
)
Atomic Molecules with Ultrashort
Intense Laser Pulses-Orientational Effects
Emmanuel Penka Fowe and André Dieter Bandrauk
*
Laboratoire de Chimie Théorique, Faculté des Sciences, Université de Sherbrooke,
Sherbrooke, Québec J1k 2R1
Canada
1. Introduction
High-order harmonic generation, HOHG, resulting from the interaction of intense ultrashort
laser pulses with atoms has been extensively studied in recent years offering potential
application as a source of coherent ultrashort radiation in the extreme ultraviolet and soft X-
ray regions.
1-3
For molecules, molecular high order harmonic generation, MHOHG
3
offers the
possibility of synthesizing attosecond (1 attosecond=10
-18
second) pulses for creating and
controlling coherent electron wavepackets, CEWP.
4
An intuitive and efficient theoretical
picture based on a classical three step electron recombination trajectory
5-6
model in the laser
field has helped to elucidate this process. According to this model, an electron tunnels out
from the atom or molecule and may recombine with the parent
5,7
or neighbouring
8
ion
emitting a high energy photon, after undergoing laser–driven motion in the continuum. If the
tunnelling electron under the laser field does not return to the parent ion position, it is
completely ionized and this is referred to as molecular ionization. The electron can also
recombine with a neighbouring ion, an example of laser induced electron transfer, LIET.
9
Theoretical and experimental work on HOHG has been mostly devoted to atoms. The study of
MHOHG in molecules is at the early stages. In contrast to atoms, for molecules, the returning
wave packet in the semiclassical picture of HOHG encounters a core comprising two or more
nuclei, which are presumed to behave as pointlike source potentials leading to interference in
the MHOHG spectrum. Additionally, it has been suggested that the electron recollision cross-
sections responsible for MHOHG relates to the projection of the valence orbitals with respect
to the direction of the propagation of the recolliding electron, making possible a new
molecular orbital tomography
10
. It is therefore, natural to ask if there is any orientation
*
Canada Research Chair – Computational Cheistry and molecular photonics.
Coherence and Ultrashort Pulse Laser Emission
494
dependence of the closely related process of MHOHG spectra. Also, due to the shapes and the
symmetries of different molecular orbitals, we are interested to know how molecular orbitals
can come into play into the MHOHG and molecular ionization yield processes when different
laser intensities and molecular angle versus laser polarisation are taken into account.
While theoretical approaches based on the accurate 3D time dependent Schrödinger
equation, TDSE, are limited to the one electron sytem
9, 11-12
and 2D models for two electrons
system
13
because of limitation of memory and computational time, the major difficulties in
the theoretical study of molecular systems in a laser field resides on the multi-center nature
of the molecule and also the treatment of the multi electron-electron interactions. Here, we
focus on time-dependent density functional theory, TDDFT, methods beyond linear
response theory
14
as a tool for studying the nonperturbative response of molecules to
intense ultrashort laser pulses.
15
The time independent Density Functional Theory, DFT, has
become an ubiquitous method
16
of solving ground state electronic problems in atoms and
molecules. Extension to the nonperturbative regime through time-dependent methods has
emerged by the existence of a rigorous theorem relating the exact time dependent density to
external time-dependent potentials
17
and has been extended to linear response via a linear
perturbative version of TDDFT.
18
We focus here on a non-linear non perturbative TDDFT.
15
For the visual understanding of electron motion in our molecules during the time
propagation under strong laser pulses, we will use the time dependent approach of the
electron localization function, TDELF.
19-22
Conceptually, the physical idea of the electron
localization function, ELF, is based on the fact that a highly localized electron repels other
electrons with same spin very strongly due to the Pauli exclusion. The ELF uses the
probability to find a second spin-like electron in the vicinity of the first one as a measure for
electronic localization. Numerical values of the probability are conveniently mapped on the
interval ]0,1] facilitating analysis and interpretation. So, in areas where two electrons of the
same spin have a high probability to be found (in reference to the homogeneous gas) the
function should tend to 0 by construction. It follows that, in areas where the probability of
finding two electrons of opposite spin is high (in reference to the homogeneous gas) the
function tends to 1. Consequently, a region of the space with a high value of the ELF
corresponds to a region of chemical bond or lone pair of the Lewis theory. Thus, TDELF will
allow us to make a clear separation between the HOMO of our molecules and the rest of the
valence molecular orbitals
23
, and therefore will enable us to visualise their behaviour in the
presence of a laser pulse, such as an example laser induced electron transfer, LIET, which
has recently been shown to be controllable through the pulse shape and phase.
9, 24
In the present work, non perturbative TDDFT methods
15
as opposed to linear response
TDDFT
18
are used to study the orientational dependence of ionization and molecular high
order harmonic generation, MHOHG, in tri-atoms CO
2
, OCS, CS
2
and the di-atomic N
2
molecules as a function of laser intensity, I
0
≥ 3.54 x 10
14
W/cm
2
=10
-2
au (1au; Io=3.54x10
16
W/cm
2
, E
o
=5x10
9
V/cm) for few cycle 800 nm laser pulses. This work is organized as follow:
First we briefly recall the TDDFT formalism, followed by the procedure for calculating
ionization rates and the time dependent electron localization function, TDELF. The next
sections are devoted to results and discussions. The paper is ended by some concluding
remarks for future research.
2. Methods: Nonperturbative TDDFT Kohn-Sham formalism
The TDDFT method provides the most detailed and feasible ab-initio approach for tackling
many-body problems in external time dependent field. Density functional theory (DFT) as first
Non Perturbative Time-Dependent Density Functional Theory, TDDFT, Study of
Ionization and Harmonic Generation in Linear Di-(N
2
) and Tri-(CO
2
, OCS, CS
2
)…
495
introduced by Hohenberg and Kohn
25
, and extended by Kohn and Sham
26
(KS) is based on the
existence of an exact mapping between one-particle density and external potentials. This leads
to the density of the interacting system being obtained from the density of an auxiliary system
of non-interacting particles moving in an effective local single-particle potential. A time
dependent generalisation of DFT was provided by Runge and Gross
17
, showing that there is a
one-to-one correspondence between the external (time dependent) potential,
(,)
ext
rt
υ
, and the
time dependent one-electron density,n(r,t), for many-body systems evolving from a fixed
initial state. The time dependent electronic density is written as:
27
2
,,
(,) (,) (,)|,
N
i
i
nrt n rt rt
σ
σσ
σσ
ψ
=↑ ↓ =↑ ↓
==
∑∑∑
(1)
where,
N
σ
is the number of the occupied KS orbital in the spin state and
(,)
i
rt
σ
ψ
is the
orbital obtained through the time dependent KS equations (in a.u.):
),(),(
2
1
),(
2
trtrtr
t
i
ieffi
σσ
ψυψ
⎥
⎦
⎤
⎢
⎣
⎡
+∇−=
∂
∂
,
(2)
where
),(),(),(),(
,
trtrtrtr
xchexteff
σ
υ
υ
υ
υ
+
+
=
.
(3-a)
The first term is the external potential, due to the interaction of the electron with an external
laser field and the nuclei, while the second term accounts for the classical Hartree
electrostatic interaction between electrons, and the third term is the exchange correlation
(xc) potential includes all non–trivial many body effects, and has an extremely complex (and
essentially unknown) functional dependence on the density. When an intense electric with a
low frequency field is applied to a molecule, electrons tend to be displaced out by
ionization; so, the higher ionization potential, IP, or barriers, the more this electronic
displacement will be hindered. Therefore, the choice of an approach which accurately
reproduces the experimental IP is useful for our analysis. Local density approximation
(LDA) has been widely used in strong fields
15
due to its simplicity and applicability to
various systems with relatively lower computational cost. However, LDA is constructed
from the homogenous gas system and suffers from a wrong asymptotic behaviour
originating from the incomplete cancellation of the self-interactions, SI. For these reasons,
we have used the Van Leeuwen and Baerends
28
potential, LB94, which introduces a gradient
correction to the LDA, exchange correlation so as to reproduce the Coulomb asymptotic
behaviour of the potential.
2
94 1/3
2
() () ()
13 ln( ( 1))
LB LDA
xx
x
n
xx x
σσ
σ
σ
σσ σ
ννβ
β
=−
+++
(3-b)
where,
4/3
()
()
n
x
n
σ
σ
σ
∇
= ;
β
=0.05, (3-c)