Emerging Communications for Wireless Sensor Networks Part 9 pdf
Bạn đang xem bản rút gọn của tài liệu. Xem và tải ngay bản đầy đủ của tài liệu tại đây (640.67 KB, 20 trang )
Energy-aware Selective Communications in Sensor Networks 153
The recursive expression in (29) can be written as a function of µ
∗
= E
T
r as
(P
I
E
I
+ (1 − P
I
)E
R
)µ
∗
= (1 − P
I
)E
T
H(µ
∗
) (31)
where H
(µ
∗
) is given by (18). Defining
ρ
=
(
1 − P
I
)E
T
P
I
E
I
+ (1 − P
I
)E
R
(32)
we get
µ
∗
= ρH(µ
∗
). (33)
As a reference for comparison, we will consider the income rate of the non-selective transmit-
ter (i.e., the node transmitting any message requested to be sent, provided that the battery is
not depleted), which can be shown (Arroyo-Valles et al., 2009) to be equal to
r
0
=
E{x}
E{E
1
(x)}
. (34)
4.2 Gain of a selective forwarding scheme
In this section we analyze asymptotically the advantages of the optimal selective scheme with
regard to the non-selective one. To do so, we define the gain of a selective transmitter as the
ratio of its income rate, r, and that of the non-selective transmitter, r
0
,
G
=
r
r
0
. (35)
For the optimal selective transmitter in the constant profile case, combining (29) and (34), we
get
G
=
µ
∗
E{E
1
(x)}
E
T
E{x}
=
µ
∗
(P
I
E
I
+ (1 − P
I
)(E
T
+ E
R
))
E
T
E{x}
=(
1 − P
I
)(1 + ρ
−1
)
µ
∗
E{x}
=
1 + ρ
ρ
µ
∗
E{x|x > 0}
. (36)
In the following, we compute the gain for several importance distributions.
4.3 Examples
Let us illustrate some examples taken from the constant profile case,
• Uniform Distribution: Substituting (22) into (33), we get
µ
∗
=
1
4
ρ
(2 − µ
∗
)
2
, (37)
which can be solved for µ
∗
as
µ
∗
= 2
1
+ ρ
ρ
−
1
+ ρ
ρ
2
− 1
(38)
(the second root is higher than 2, which is not an admissible solution). Note that, for
ρ
= 4, we get µ
∗
= 1, which agrees with the observation in Fig.2(a).
Therefore, the gain is given by
G
= 2
1
+ ρ
ρ
1
+ ρ
ρ
−
1
+ ρ
ρ
2
− 1
. (39)
• Exponential: Using (25) we find that µ
∗
is the solution of
µ
∗
= aW(ρ), (40)
where W
(x) = y is the real-valued Lambert’s W function which solves the equation
ye
y
= x for −1 ≤ y ≤ 0 and −1/ e ≤ x ≤ 0 (Corless et al., 1996). Thus,
G
= (1 + ρ
−1
)W(ρ). (41)
Figure 4 compares the gain of the uniform and the exponential distributions as a func-
tion of ρ. The graphic remarks that, under exponential distributions, the difference be-
tween the selective and the non-selective forwarding scheme is much more significant.
The better performance of the exponential distribution compared to the uniform may
be attributed to the tailed shape. We may think that, for a long-tailed distribution, the
selective transmitter may be highly selective, saving energy for rare but extremely im-
portant messages. This intuition is corroborated by the Pareto distribution (see (Arroyo-
Valles et al., 2009) for further details).
ρ
Fig. 4. Gain of the uniform and exponential distributions, as a function of ρ.
4.4 Influence of idle times
The above examples show that the gain of the optimal selective transmitter increases with
ρ. By noting that ρ in (32) is a decreasing function of P
I
and E
I
, the influence of idle times
becomes clear: as soon as the frequency of idle times or the idle energy expenses increases,
the gain of the selective transmission scheme reduces.
5. Network Optimization
5.1 Optimal selective forwarding
Since each message must travel through several nodes before arriving to destination, the mes-
sage transmission is completely successful if the message arrives to the sink node. In general,
an intermediate node in the path has no way to know if the message arrives to the sink (unless
Emerging Communications for Wireless Sensor Networks154
the sink returns a confirmation message), but it can possibly listen if the neighboring node in
the path propagated the message it was requested to forward. If d
k
denotes the decision at
node i, and q
k
denotes the decision at the neighboring node j, the transmission is said to be
locally successful through j if d
k
= 1 and q
k
= 1.
In this case, we can re-define the cumulative sum of the importance values in (7) by omitting
all messages that are not forwarded by the receiver node, as
s
∞
=
∞
∑
i=0
d
i
q
i
x
i
, (42)
and, as we did in Section 3, the goal at each node is to maximize its expected value of s
∞
. Note
that (42) reduces to (7) by taking q
i
= 1 for all i.
The following result provides the optimal selective forwarder.
Theorem 4 Let
{x
k
,k ≥ 0} be a statistically independent sequence of importance values, and
e
k
the energy process given by (1). Consider the sequence of decision rules
d
k
= u(Q
k
(e
k
, x
k
)x
k
− µ
k
(e
k
, x
k
))u(e − E
1
(x
k
)), (43)
where u
(x) stands for the Heaviside step function (with the convention u(0) = 1),
Q
k
(x
k
,e
k
) = E{q
k
|e
k
, x
k
} = P{q
k
= 1|e
k
, x
k
} (44)
and thresholds µ
k
are defined recursively through the pair of equations
µ
k
(e, x) = λ
k+1
(e − E
0
(x)) − λ
k+1
(e − E
1
(x)) (45)
λ
k
(e) =
(
E{λ
k+1
(e − E
0
(x
k
))} + E{(Q
k
(e
k
, x
k
)x
k
− µ
k
(e, x
k
))
+
u(e − E
1
(x
k
))}
u
(e). (46)
Sequence
{d
k
} is optimal in the sense of maximizing E{s
∞
} (with s
∞
given by (42)) among all
sequences in the form d
k
= g(e
k
, x
k
) (with g(e
k
, x
k
) = 0 for e
k
< E
1
(x
k
)).
The auxiliary function λ
k
(e) represents the increment of the total importance that can be ex-
pected at time k, i.e.,
λ
k
(e) =
∞
∑
i=k
E{d
i
q
i
x
i
|e
k
= e}. (47)
The proof can be found in (Arroyo-Valles et al., 2009). It is interesting to re-write (43) as
d
k
= u
Q
k
(x
k
,e
k
) −
µ
k
(e)
x
k
u
(e
k
− E
1
(x
k
)) (48)
which expresses the node decision as a comparison of Q
k
with a threshold inversely pro-
portional to the importance value, x
k
. This result is in agreement with our previous models in
(Arroyo-Valles et al., 2006), (Arroyo-Valles, Alaiz-Rodriguez, Guerrero-Curieses & Cid-Sueiro,
2007).
5.2 Global network optimization applying a selective transmission policy
In order to complete the theoretical study, the network optimization at a global level is ana-
lyzed. In general, and as we mentioned in Sec. 5.1, an intermediate node in the path has no
way to know if the message arrives to the sink unless the sink sends a confirmation mes-
sage. Let’s denote a
k
as the arrival of a message to the sink node and let’s define A
k
as
A
k
(x
k
,e
k
) = E{a
k
|e
k
, x
k
} = P{a
k
= 1|e
k
, x
k
}, similar to Q
k
definition from Theorem 4. The
optimal selective policy when optimizing the global performance can be obtained from Theo-
rem 4 just replacing q
k
and Q
k
by a
k
and A
k
. The difference among both theorems will stay in
the interpretation of variables a
k
and q
k
. While q
k
indicates the action of a forwarding node,
a
k
refers to the success of the whole routing process.
6. Algorithmic design
In practice, to compute the optimal forwarding threshold in a sensor network, Q
k
(x
k
,e
k
),
A
k
(x
k
,e
k
) and the importance distribution of messages, p
k
(x
k
), are required. As they are
unknown, they can be estimated on-the-fly with data available at time k.
6.1 Estimating Q
k
and A
k
A simple estimate of the forwarding policy Q
k
= E{q
k
|x
k
,e
k
} can be derived by assuming that
(1) it does not depend on e
k
(i.e., the subsequent forward/discard decision of the receiver node
is independent of the energy state at the transmitting node), and (2) each node is able to listen
to the retransmission of a message that has been previously sent (i.e. each node can observe
q
k
when d
k
= 1). Following an approach previously proposed in (Arroyo-Valles et al., 2006)
and (Arroyo-Valles, Marques & Cid-Sueiro, 2007), in (Arroyo-Valles et al., 2008) we propose
to estimate Q
k
by means of the parametric model
Q
k
(x
k
,w, b) = P{q
k
= 1|x
k
,w, b} =
1
1 + exp(−wx
k
− b)
(49)
Note that, for positive values of w, Q
k
increases monotonically with x
k
, as expected from
the node behavior. We estimate parameters w and b via ML (maximum likelihood) using
the observed sequence of neighbor decisions
{q
k
} and importance values {x
k
}, by means of
stochastic gradient learning rules
w
k+1
= w
k
+ η(q
k
− Q
k
(x
k
,w
k
,b
k
))x
k
b
k+1
= b
k
+ η(q
k
− Q
k
(x
k
,w
k
,b
k
)) (50)
where η is the learning step.
Similarly, the estimation algorithm given by (49) and (50) can be adapted to estimate A
k
in a
straightforward manner, but it requires the sink node to acknowledge the reception of mes-
sages back through the routing path, so as to provide the nodes with a set of observations a
k
for the estimation algorithm.
6.2 Estimating asymptotic thresholds
The optimal threshold depends on the distribution of message importances, which in practice
may be unknown. Another alternative, apart from estimating it (see (Arroyo-Valles et al.,
2009)), consists of estimating parameter r in (29) and replace the optimal threshold function
by its asymptotic limit. Parameter r can be estimated in real time based on the available data
{x
, = 0,. , k} at time k.
Energy-aware Selective Communications in Sensor Networks 155
the sink returns a confirmation message), but it can possibly listen if the neighboring node in
the path propagated the message it was requested to forward. If d
k
denotes the decision at
node i, and q
k
denotes the decision at the neighboring node j, the transmission is said to be
locally successful through j if d
k
= 1 and q
k
= 1.
In this case, we can re-define the cumulative sum of the importance values in (7) by omitting
all messages that are not forwarded by the receiver node, as
s
∞
=
∞
∑
i=0
d
i
q
i
x
i
, (42)
and, as we did in Section 3, the goal at each node is to maximize its expected value of s
∞
. Note
that (42) reduces to (7) by taking q
i
= 1 for all i.
The following result provides the optimal selective forwarder.
Theorem 4 Let
{x
k
,k ≥ 0} be a statistically independent sequence of importance values, and
e
k
the energy process given by (1). Consider the sequence of decision rules
d
k
= u(Q
k
(e
k
, x
k
)x
k
− µ
k
(e
k
, x
k
))u(e − E
1
(x
k
)), (43)
where u
(x) stands for the Heaviside step function (with the convention u(0) = 1),
Q
k
(x
k
,e
k
) = E{q
k
|e
k
, x
k
} = P{q
k
= 1|e
k
, x
k
} (44)
and thresholds µ
k
are defined recursively through the pair of equations
µ
k
(e, x) = λ
k+1
(e − E
0
(x)) − λ
k+1
(e − E
1
(x)) (45)
λ
k
(e) =
(
E{λ
k+1
(e − E
0
(x
k
))} + E{(Q
k
(e
k
, x
k
)x
k
− µ
k
(e, x
k
))
+
u(e − E
1
(x
k
))}
u
(e). (46)
Sequence
{d
k
} is optimal in the sense of maximizing E{s
∞
} (with s
∞
given by (42)) among all
sequences in the form d
k
= g(e
k
, x
k
) (with g(e
k
, x
k
) = 0 for e
k
< E
1
(x
k
)).
The auxiliary function λ
k
(e) represents the increment of the total importance that can be ex-
pected at time k, i.e.,
λ
k
(e) =
∞
∑
i=k
E{d
i
q
i
x
i
|e
k
= e}. (47)
The proof can be found in (Arroyo-Valles et al., 2009). It is interesting to re-write (43) as
d
k
= u
Q
k
(x
k
,e
k
) −
µ
k
(e)
x
k
u
(e
k
− E
1
(x
k
)) (48)
which expresses the node decision as a comparison of Q
k
with a threshold inversely pro-
portional to the importance value, x
k
. This result is in agreement with our previous models in
(Arroyo-Valles et al., 2006), (Arroyo-Valles, Alaiz-Rodriguez, Guerrero-Curieses & Cid-Sueiro,
2007).
5.2 Global network optimization applying a selective transmission policy
In order to complete the theoretical study, the network optimization at a global level is ana-
lyzed. In general, and as we mentioned in Sec. 5.1, an intermediate node in the path has no
way to know if the message arrives to the sink unless the sink sends a confirmation mes-
sage. Let’s denote a
k
as the arrival of a message to the sink node and let’s define A
k
as
A
k
(x
k
,e
k
) = E{a
k
|e
k
, x
k
} = P{a
k
= 1|e
k
, x
k
}, similar to Q
k
definition from Theorem 4. The
optimal selective policy when optimizing the global performance can be obtained from Theo-
rem 4 just replacing q
k
and Q
k
by a
k
and A
k
. The difference among both theorems will stay in
the interpretation of variables a
k
and q
k
. While q
k
indicates the action of a forwarding node,
a
k
refers to the success of the whole routing process.
6. Algorithmic design
In practice, to compute the optimal forwarding threshold in a sensor network, Q
k
(x
k
,e
k
),
A
k
(x
k
,e
k
) and the importance distribution of messages, p
k
(x
k
), are required. As they are
unknown, they can be estimated on-the-fly with data available at time k.
6.1 Estimating Q
k
and A
k
A simple estimate of the forwarding policy Q
k
= E{q
k
|x
k
,e
k
} can be derived by assuming that
(1) it does not depend on e
k
(i.e., the subsequent forward/discard decision of the receiver node
is independent of the energy state at the transmitting node), and (2) each node is able to listen
to the retransmission of a message that has been previously sent (i.e. each node can observe
q
k
when d
k
= 1). Following an approach previously proposed in (Arroyo-Valles et al., 2006)
and (Arroyo-Valles, Marques & Cid-Sueiro, 2007), in (Arroyo-Valles et al., 2008) we propose
to estimate Q
k
by means of the parametric model
Q
k
(x
k
,w, b) = P{q
k
= 1|x
k
,w, b} =
1
1 + exp(−wx
k
− b)
(49)
Note that, for positive values of w, Q
k
increases monotonically with x
k
, as expected from
the node behavior. We estimate parameters w and b via ML (maximum likelihood) using
the observed sequence of neighbor decisions
{q
k
} and importance values {x
k
}, by means of
stochastic gradient learning rules
w
k+1
= w
k
+ η(q
k
− Q
k
(x
k
,w
k
,b
k
))x
k
b
k+1
= b
k
+ η(q
k
− Q
k
(x
k
,w
k
,b
k
)) (50)
where η is the learning step.
Similarly, the estimation algorithm given by (49) and (50) can be adapted to estimate A
k
in a
straightforward manner, but it requires the sink node to acknowledge the reception of mes-
sages back through the routing path, so as to provide the nodes with a set of observations a
k
for the estimation algorithm.
6.2 Estimating asymptotic thresholds
The optimal threshold depends on the distribution of message importances, which in practice
may be unknown. Another alternative, apart from estimating it (see (Arroyo-Valles et al.,
2009)), consists of estimating parameter r in (29) and replace the optimal threshold function
by its asymptotic limit. Parameter r can be estimated in real time based on the available data
{x
, = 0,. , k} at time k.
Emerging Communications for Wireless Sensor Networks156
However, first of all we should update (29) to incorporate to the formula the information ob-
tained from neighboring nodes and thus, define a formula as general as possible. Comparing
(8) and (43), we realize that x in the optimal transmitter is replaced by xQ
(x) in the optimal
forwarder and so, (29) should be replaced by
E
{E
0
(x)}r = E{(xQ(x) − (E
1
(x) − E
0
(x))r)
+
}. (51)
Defining ∆
(x) = E
1
(x) − E
0
(x), we can estimate the expected value on the right-hand side of
(51) as
E
{(xQ(x) − ∆(x)r)
+
} ≈ m
k
(52)
where
m
k
=
1
k
k
∑
i=1
(x
i
Q(x
i
) − ∆(x
i
)r)
+
=
1
−
1
k
m
k−1
+
1
k
(x
k
Q(x
k
) − ∆(x
k
)r)
+
(53)
According to (51), we can then estimate r at time k as r
k
= m
k
/
0
, where
0
= E{E
0
(x)}. Using
(53) we get
r
k
=
1
−
1
k
r
k−1
+
(
x
k
Q(x
k
) − ∆(x
k
)r)
+
k
0
(54)
Unfortunately, the above estimate is not feasible, because the left-hand side depends on r. But
we can replace it by r
k−1
, so that
r
k
=
1
−
1
k
r
k−1
+
(
x
k
Q(x
k
) − ∆(x
k
)r
k−1
)
+
k
0
. (55)
For the constant profile case, the optimal forwarding threshold is computed as
µ
k
=
1
−
1
k
µ
k−1
+
ρ
k
· (x
k
Q(x
k
) − µ
k−1
)
+
(56)
where ρ is given by (32).
7. Experimental work and results
In this section we test the selective message forwarding schemes in different scenarios. All
simulations have been conducted using Matlab.
7.1 Sensor network
The scenario of an isolated energy-limited selective transmitter node can be found in (Arroyo-
Valles et al., 2009). Although it provides useful insights, from a practical perspective a test
case with a single isolated node is too simple. For this reason, we simulate a more realistic
scenario consisting of a network of nodes. Experiments have been conducted considering both
optimal selective transmitters and optimal selective forwarders (with both local and global
optimization). Results focused on the optimal selective transmitters are presented in Section
7.1.1 while results for both selective transmitters and forwarders are presented in Section 7.1.2.
Before starting the analysis of those results, we first describe part of the simulation set-up that
is common for all the numerical tests run in this Section.
1. All nodes deployed in the sensor network are identical and have the same initial re-
sources except for the sink, that has rechargeable batteries (thus it does not have energy
limitations). This static unique sink is always positioned at the right extreme of the
field. We will consider that P
I
= 0, E
T
= 4, E
R
= 1 and E
I
= 0. Sources are selected at
random and keep transmitting messages of importances x to the sink until network life-
time expires. Network lifetime is defined as the number of time slots achieved before
the sink is isolated from its neighboring nodes. In order to simulate a more realistic set
up, the parameters of the two distributions considered (uniform and exponential) will
be adjusted so that x
k
∈ [0,10] (with x
k
= 0 representing a silent time).
2. Nodes are considered as neighbors if they are placed within the transmission radius,
which for simplicity reasons and due to power limitations is assumed to be the same
for all nodes (i.e., a Unit Disk Graph model is assumed). Since nodes can only transmit
messages inside their coverage area, they have geographical information about their
own position, the location of their neighbors and the sink coordinates. It is naturally
assumed that coverage areas are reciprocal, which is common when having a single
omnidirectional antenna. Under this assumption nodes can listen to the channel and
detect retransmissions of neighboring nodes before retransmitting the message again,
in case a loss is detected, or discard it.
3. Performance is assessed in terms of the importance sum of all messages received by the
sink, the mean value of these received importances, the number of transmissions made
by origin nodes and the network lifetime (measured in time slots).
4. Experimental results are averaged over 50 different topologies which contain different
samples of the two previous importance distributions.
7.1.1 Sensor network composed of selective transmitters
In this scenario, the sensor network is considered as a square area of 10 × 10, where 100 nodes
have been uniformly randomly deployed. The initial energy of the nodes is set to E
= 200
units. Regarding to the transmitting schemes implemented, four different types of sensors are
compared.
• Type NS (Non-Selective): Non-selective node. The threshold is set to µ
= 0, so that it
forwards all messages.
• Type OT (Optimal Transmitter): Optimal selective node. Threshold µ is computed ac-
cording to (16) and (19), where nodes know the source importance distribution p
(x).
• Type CT (Constant Threshold): Asymptotically optimal selective node. The sensor node
establishes a constant threshold which is set to the asymptotic value of the optimal
threshold given by (33).
• Type AT (Adaptive Transmitter): Adaptive selective node. The threshold is also com-
puted following (16) and (19). Nevertheless, the node is unaware of p
(x) and it uses the
Gamma distribution estimation strategy, proposed in (Arroyo-Valles et al., 2009).
The routing algorithm implemented by the network follows a greedy forwarding scheme
(Karp & Kung, 2000). Although the disadvantages of the greedy forwarding algorithm are
well-known (e.g., when the number of nodes close to the sink is small or there is a void), we
choose this algorithm due to its simplicity, which will contribute to minimize its influence on
the final results. This way, we can gauge better the effect of implementing our optimal selec-
tive schemes in a network, which indeed is the main objective of the simulations. It is worth
Energy-aware Selective Communications in Sensor Networks 157
However, first of all we should update (29) to incorporate to the formula the information ob-
tained from neighboring nodes and thus, define a formula as general as possible. Comparing
(8) and (43), we realize that x in the optimal transmitter is replaced by xQ
(x) in the optimal
forwarder and so, (29) should be replaced by
E
{E
0
(x)}r = E{(xQ(x) − (E
1
(x) − E
0
(x))r)
+
}. (51)
Defining ∆
(x) = E
1
(x) − E
0
(x), we can estimate the expected value on the right-hand side of
(51) as
E
{(xQ(x) − ∆(x)r)
+
} ≈ m
k
(52)
where
m
k
=
1
k
k
∑
i=1
(x
i
Q(x
i
) − ∆(x
i
)r)
+
=
1
−
1
k
m
k−1
+
1
k
(x
k
Q(x
k
) − ∆(x
k
)r)
+
(53)
According to (51), we can then estimate r at time k as r
k
= m
k
/
0
, where
0
= E{E
0
(x)}. Using
(53) we get
r
k
=
1
−
1
k
r
k−1
+
(
x
k
Q(x
k
) − ∆(x
k
)r)
+
k
0
(54)
Unfortunately, the above estimate is not feasible, because the left-hand side depends on r. But
we can replace it by r
k−1
, so that
r
k
=
1
−
1
k
r
k−1
+
(
x
k
Q(x
k
) − ∆(x
k
)r
k−1
)
+
k
0
. (55)
For the constant profile case, the optimal forwarding threshold is computed as
µ
k
=
1
−
1
k
µ
k−1
+
ρ
k
· (x
k
Q(x
k
) − µ
k−1
)
+
(56)
where ρ is given by (32).
7. Experimental work and results
In this section we test the selective message forwarding schemes in different scenarios. All
simulations have been conducted using Matlab.
7.1 Sensor network
The scenario of an isolated energy-limited selective transmitter node can be found in (Arroyo-
Valles et al., 2009). Although it provides useful insights, from a practical perspective a test
case with a single isolated node is too simple. For this reason, we simulate a more realistic
scenario consisting of a network of nodes. Experiments have been conducted considering both
optimal selective transmitters and optimal selective forwarders (with both local and global
optimization). Results focused on the optimal selective transmitters are presented in Section
7.1.1 while results for both selective transmitters and forwarders are presented in Section 7.1.2.
Before starting the analysis of those results, we first describe part of the simulation set-up that
is common for all the numerical tests run in this Section.
1. All nodes deployed in the sensor network are identical and have the same initial re-
sources except for the sink, that has rechargeable batteries (thus it does not have energy
limitations). This static unique sink is always positioned at the right extreme of the
field. We will consider that P
I
= 0, E
T
= 4, E
R
= 1 and E
I
= 0. Sources are selected at
random and keep transmitting messages of importances x to the sink until network life-
time expires. Network lifetime is defined as the number of time slots achieved before
the sink is isolated from its neighboring nodes. In order to simulate a more realistic set
up, the parameters of the two distributions considered (uniform and exponential) will
be adjusted so that x
k
∈ [0,10] (with x
k
= 0 representing a silent time).
2. Nodes are considered as neighbors if they are placed within the transmission radius,
which for simplicity reasons and due to power limitations is assumed to be the same
for all nodes (i.e., a Unit Disk Graph model is assumed). Since nodes can only transmit
messages inside their coverage area, they have geographical information about their
own position, the location of their neighbors and the sink coordinates. It is naturally
assumed that coverage areas are reciprocal, which is common when having a single
omnidirectional antenna. Under this assumption nodes can listen to the channel and
detect retransmissions of neighboring nodes before retransmitting the message again,
in case a loss is detected, or discard it.
3. Performance is assessed in terms of the importance sum of all messages received by the
sink, the mean value of these received importances, the number of transmissions made
by origin nodes and the network lifetime (measured in time slots).
4. Experimental results are averaged over 50 different topologies which contain different
samples of the two previous importance distributions.
7.1.1 Sensor network composed of selective transmitters
In this scenario, the sensor network is considered as a square area of 10 × 10, where 100 nodes
have been uniformly randomly deployed. The initial energy of the nodes is set to E
= 200
units. Regarding to the transmitting schemes implemented, four different types of sensors are
compared.
• Type NS (Non-Selective): Non-selective node. The threshold is set to µ
= 0, so that it
forwards all messages.
• Type OT (Optimal Transmitter): Optimal selective node. Threshold µ is computed ac-
cording to (16) and (19), where nodes know the source importance distribution p
(x).
• Type CT (Constant Threshold): Asymptotically optimal selective node. The sensor node
establishes a constant threshold which is set to the asymptotic value of the optimal
threshold given by (33).
• Type AT (Adaptive Transmitter): Adaptive selective node. The threshold is also com-
puted following (16) and (19). Nevertheless, the node is unaware of p
(x) and it uses the
Gamma distribution estimation strategy, proposed in (Arroyo-Valles et al., 2009).
The routing algorithm implemented by the network follows a greedy forwarding scheme
(Karp & Kung, 2000). Although the disadvantages of the greedy forwarding algorithm are
well-known (e.g., when the number of nodes close to the sink is small or there is a void), we
choose this algorithm due to its simplicity, which will contribute to minimize its influence on
the final results. This way, we can gauge better the effect of implementing our optimal selec-
tive schemes in a network, which indeed is the main objective of the simulations. It is worth
Emerging Communications for Wireless Sensor Networks158
re-stressing that we are not proposing a new routing algorithm but a forwarding scheme with
a selective mechanism and therefore, this scheme can also be integrated into other more ef-
ficient routing algorithms. Periodical “keep alive” beacons are sent to keep nodes updated.
Link losses have also been included and so, the algorithm is made more robust by establishing
a maximum number of retransmissions before discarding the message, which has been set to
5 in our simulations.
Total Import. Importance Number of Network
Received Sink mean value Transmissions Lifetime
Type NS 1021.92 5.06 688.56 7896.00
Type OT 1388.40 7.49 677.38 8467.90
Type CT 1384.26 7.49 656.92 8441.08
Type AT 1377.22 7.80 720.78 8812.74
Table 1. Averaged performance when the importance values are generated according to a
uniform distribution - routing scenario
Simulation results for the scenario composed of selective transmitters are summarized in Ta-
bles 1 and 2. The numerical results validate our theoretical claims. As expected, the main
conclusion is that the selective transmission scheme outperforms the non-selective one.
Total Import. Importance Number of Network
Received Sink mean value Transmissions Lifetime
Type NS 331.72 1.76 672.84 7798.02
Type OT 610.96 3.84 613.30 8758.00
Type CT 609.45 3.86 596.82 8713.88
Type AT 594.92 4.18 685.98 9309.56
Table 2. Averaged performance when the importance values are generated according to an
exponential distribution - routing scenario
Regardless of the distribution tested, both the mean value of the importance of messages re-
ceived by the sink and the network lifetime are higher when the selective transmission scheme
is implemented.
Among the selective policies, OT nodes exhibit the best performance. Nevertheless, perfor-
mance differences among OT, CT and AT are not extremely high. The underlying reason is
that decisions made at neighboring nodes and path losses may alter the shape of the original
importance distribution. Since AT nodes estimate the importance distribution p
(x) based on
real received data, they are able to correct this alteration. This is not the case of OT and CT
nodes, which calculate µ based on the original distribution, without accounting for the alter-
ations introduced by the network. The existence of a transitory phase through the calculation
of the adaptive threshold in the AT scheme may also justify small differences with respect to
the other non-adaptive selective schemes.
7.1.2 Performance comparison among selective nodes
In this subsection, we compare the performance of different networks each of them comprising
a different type of selective nodes, namely:
• Type NS (Non-Selective) : Non-selective sensor node, it forwards all the received mes-
sages, no matter which its importance value is.
• Type AT (Adaptive Transmitter): Adaptive Selective transmitter sensor node. This sen-
sor corresponds to the particular case of (42) taking q
k
= 1, which is equivalent to as-
sume that the node does not take into account the neighbors’ behavior, i.e. it maximizes
the importance sum of all messages transmitted by the node, no matter if they are for-
warded by the neighboring node or not.
• Type LAF (Local Adaptive Forwarder): Local Adaptive Selective forwarder sensor
node. This sensor type computes the forwarding threshold according to (45) and (46).
It bears in mind the influence of neighboring nodes decisions.
• Type GAF (Global Adaptive Forwarder): Global Adaptive Selective forwarder sensor
node. The forwarding threshold is set according to (45) and (46); however a
k
and A
k
are
used instead of q
k
and Q
k
in order to achieve a global network optimization.
Since the transmission policies implemented by each node can (and will) alter the importance
distribution originally generated by the sources, all selective types of nodes considered here
are adaptive and the forwarding threshold is computed using the asymptotic threshold esti-
mate given by (56).
For illustrative purposes, we simplify the simulation set-up by considering 30 nodes that are
equally-spaced placed in a row, so that each sensor can only communicate with the adjoining
sensors. This configuration is a simple but illustrative manner of emulating the traffic arriving
to a sink, as nodes located close to the sink have to route more messages (both those generated
by themselves and the ones arriving from others far-away located). The energy values of the
different energy states are the same as the ones used in previous sections. Nodes have the
same initial amount of battery, set to 5000. The channel is ideal (loss free path). Parameter η in
(50) is set to .005. All nodes generate messages according to the same importance distribution,
which is equivalent to say that the source importance distribution is the same for all nodes.
Again, results averaged over 50 runs for different importance distributions are listed in Tables
3 and 4. Simulations are stopped when the sink is isolated.
Total Import. Importance Number of Network
Received mean value Receptions Lifetime
Type NS 4989.26 4.99 999.02 1000
Type AT 8158.45 8.28 985.52 2963.42
Type LAF 8210.73 8.33 985.38 3056.90
Type GAF 8209.80 8.33 985.36 3056.64
Table 3. Averaged performance when the importance values are generated according to a
uniform distribution
According to the analytical formulation, the non-selective sensor nodes perform worse (re-
gardless of the metrics) than any type of the selective nodes. It is worth mentioning that the
Energy-aware Selective Communications in Sensor Networks 159
re-stressing that we are not proposing a new routing algorithm but a forwarding scheme with
a selective mechanism and therefore, this scheme can also be integrated into other more ef-
ficient routing algorithms. Periodical “keep alive” beacons are sent to keep nodes updated.
Link losses have also been included and so, the algorithm is made more robust by establishing
a maximum number of retransmissions before discarding the message, which has been set to
5 in our simulations.
Total Import. Importance Number of Network
Received Sink mean value Transmissions Lifetime
Type NS 1021.92 5.06 688.56 7896.00
Type OT 1388.40 7.49 677.38 8467.90
Type CT 1384.26 7.49 656.92 8441.08
Type AT 1377.22 7.80 720.78 8812.74
Table 1. Averaged performance when the importance values are generated according to a
uniform distribution - routing scenario
Simulation results for the scenario composed of selective transmitters are summarized in Ta-
bles 1 and 2. The numerical results validate our theoretical claims. As expected, the main
conclusion is that the selective transmission scheme outperforms the non-selective one.
Total Import. Importance Number of Network
Received Sink mean value Transmissions Lifetime
Type NS 331.72 1.76 672.84 7798.02
Type OT 610.96 3.84 613.30 8758.00
Type CT 609.45 3.86 596.82 8713.88
Type AT 594.92 4.18 685.98 9309.56
Table 2. Averaged performance when the importance values are generated according to an
exponential distribution - routing scenario
Regardless of the distribution tested, both the mean value of the importance of messages re-
ceived by the sink and the network lifetime are higher when the selective transmission scheme
is implemented.
Among the selective policies, OT nodes exhibit the best performance. Nevertheless, perfor-
mance differences among OT, CT and AT are not extremely high. The underlying reason is
that decisions made at neighboring nodes and path losses may alter the shape of the original
importance distribution. Since AT nodes estimate the importance distribution p
(x) based on
real received data, they are able to correct this alteration. This is not the case of OT and CT
nodes, which calculate µ based on the original distribution, without accounting for the alter-
ations introduced by the network. The existence of a transitory phase through the calculation
of the adaptive threshold in the AT scheme may also justify small differences with respect to
the other non-adaptive selective schemes.
7.1.2 Performance comparison among selective nodes
In this subsection, we compare the performance of different networks each of them comprising
a different type of selective nodes, namely:
• Type NS (Non-Selective) : Non-selective sensor node, it forwards all the received mes-
sages, no matter which its importance value is.
• Type AT (Adaptive Transmitter): Adaptive Selective transmitter sensor node. This sen-
sor corresponds to the particular case of (42) taking q
k
= 1, which is equivalent to as-
sume that the node does not take into account the neighbors’ behavior, i.e. it maximizes
the importance sum of all messages transmitted by the node, no matter if they are for-
warded by the neighboring node or not.
• Type LAF (Local Adaptive Forwarder): Local Adaptive Selective forwarder sensor
node. This sensor type computes the forwarding threshold according to (45) and (46).
It bears in mind the influence of neighboring nodes decisions.
• Type GAF (Global Adaptive Forwarder): Global Adaptive Selective forwarder sensor
node. The forwarding threshold is set according to (45) and (46); however a
k
and A
k
are
used instead of q
k
and Q
k
in order to achieve a global network optimization.
Since the transmission policies implemented by each node can (and will) alter the importance
distribution originally generated by the sources, all selective types of nodes considered here
are adaptive and the forwarding threshold is computed using the asymptotic threshold esti-
mate given by (56).
For illustrative purposes, we simplify the simulation set-up by considering 30 nodes that are
equally-spaced placed in a row, so that each sensor can only communicate with the adjoining
sensors. This configuration is a simple but illustrative manner of emulating the traffic arriving
to a sink, as nodes located close to the sink have to route more messages (both those generated
by themselves and the ones arriving from others far-away located). The energy values of the
different energy states are the same as the ones used in previous sections. Nodes have the
same initial amount of battery, set to 5000. The channel is ideal (loss free path). Parameter η in
(50) is set to .005. All nodes generate messages according to the same importance distribution,
which is equivalent to say that the source importance distribution is the same for all nodes.
Again, results averaged over 50 runs for different importance distributions are listed in Tables
3 and 4. Simulations are stopped when the sink is isolated.
Total Import. Importance Number of Network
Received mean value Receptions Lifetime
Type NS 4989.26 4.99 999.02 1000
Type AT 8158.45 8.28 985.52 2963.42
Type LAF 8210.73 8.33 985.38 3056.90
Type GAF 8209.80 8.33 985.36 3056.64
Table 3. Averaged performance when the importance values are generated according to a
uniform distribution
According to the analytical formulation, the non-selective sensor nodes perform worse (re-
gardless of the metrics) than any type of the selective nodes. It is worth mentioning that the
Emerging Communications for Wireless Sensor Networks160
mean value of the messages received by the sink is slightly higher in this scenario than in the
precedent which corresponds to an arbitrary topology.
If we look closely among the selective nodes, the selective forwarding (local or global) yields
a better performance than the selective transmission for all the proposed importance distri-
bution types. Nevertheless, looking at the averaged values of the importance sum, the goal
metric to be maximized, it is revealed that the improvement, although substantial, is not ex-
treme. The reason stems from the fact that all nodes have an identical source importance
distribution. More noticeable differences will appear whenever the nodes generate messages
of different importance distributions.
Total Import. Importance Number of Network
Received mean value Receptions Lifetime
Type NS 1755.40 1.76 999.02 1000
Type AT 5526.04 5.99 923.12 11580.70
Type LAF 5612.34 6.11 919.18 12459.76
Type GAF 5612.22 6.11 919.08 12468.58
Table 4. Averaged performance when the importance values are generated according to an
exponential distribution
Additionally, the difference is almost unnoticeable when comparing the LAF and GAF nodes
(the actual difference depends on the distribution tested). This extremely low difference is
due to the effect that nodes tend to propagate their current thresholds to adjoining nodes and,
therefore, the local and global optimization are almost coincident.
Figure 5 shows the threshold evolution for Adaptive Transmitters (a) and Local Adaptive
Forwarders (b). Going into detail, results in Figure 5(a) point out that each node behaves
independently and sets its threshold according to its own available information. The furthest
node from the sink sets the lowest threshold, which clearly corresponds to the isolated node
scenario given that it only has its own generated traffic. Nevertheless, the subsequent nodes
in the network increase their thresholds as a consequence of receiving messages with clipped
importances from their previous nodes. Thus, the closer a node is placed to the sink, the larger
the threshold value is. On the other hand, LAF nodes in Figure 5(b) follow a similar trend.
Again, after a transitory phase, nodes tend to converge to the threshold value established by
the nearest node from the sink. This is a reasonable behavior because it would not make sense
to transmit a message up to the last but one node and then, discard it for not being important
enough. Nodes tend to learn the threshold that the neighbor closer to the sink node is using to
ensure that the message to transmit is forwarded, so that in the end, nodes learn the threshold
estimated by the nearest node to the sink. Learning the probability of retransmission (Q
k
or A
k
in case of global optimization) is equivalent to the effect of backward propagating the
threshold value to the whole sensor network.
Once the last but one node is isolated, two effects can be observed. The first is related to that
node, which is now free to fix its own threshold value according to the messages generated by
itself. And the second is related to the remaining nodes in the network. From the moment the
network is broken down and there is no manner to reach the sink, nodes located on the iso-
lated side of the breakdown will tend to set a lower threshold since the lack of collaboration is
then propagated backwards (the estimation of the probability that a neighbor will re-transmit
the messages decreases). Moreover, since this effect is produced in cascade, nodes will end up
adjusting their thresholds to the threshold of the node located next to the breakdown.
0 500 1000 1500 2000 2500 3000
0
2
4
6
8
10
12
14
16
18
20
Sent Messages
Threshold
(a)
0 500 1000 1500 2000 2500 3000
0
2
4
6
8
10
12
14
16
18
20
Number of Sent Messages
Threshold
(b)
Fig. 5. The decision threshold evolution for Adaptive Transmitters (a) and Local Adaptive
Forwarders (b) as a function of the number of sent messages in a simulation run. A network
topology of 30 equally-spaced nodes located in a row is considered. A uniform importance
distribution U
(0,10) is assumed.
In order to enhance the advantages of using selective forwarding schemes, a new scenario is
proposed. In this case, nodes generate messages according to an exponential distribution, but
the source importance distribution is different in every node so that parameter a follows an
exponential trend, too. Remark that the manner of selecting parameter a implies that message
importance x
k
/∈ [0, 10] any more. For concision, Table 5 lists results only for the AT and LAF
cases.
Total Import. Importance Number of Network
Received mean value Receptions Lifetime
Type AT 11229.32 13.92 811.60 27014.90
Type LAF 11763.35 14.37 825.48 28583.16
Table 5. Averaged performance when the importance values are generated according to an
heterogeneous exponential distribution
In summary, numerical results corroborate that selective forwarding sensor nodes are more
energy-efficient than their non-selective counterparts. On the one hand, the selective forward-
ing schemes significantly increase the network lifetime. On the other hand, they also allow
high importance messages to reach the sink when batteries are scarce.
8. Conclusions
This chapter has introduced an optimum selective forwarding policy in WSN as an energy-
efficient scheme for data transmission. Messages, which were assumed to be graded with an
importance value and which could be eventually discarded, were transmitted by sensor nodes
Energy-aware Selective Communications in Sensor Networks 161
mean value of the messages received by the sink is slightly higher in this scenario than in the
precedent which corresponds to an arbitrary topology.
If we look closely among the selective nodes, the selective forwarding (local or global) yields
a better performance than the selective transmission for all the proposed importance distri-
bution types. Nevertheless, looking at the averaged values of the importance sum, the goal
metric to be maximized, it is revealed that the improvement, although substantial, is not ex-
treme. The reason stems from the fact that all nodes have an identical source importance
distribution. More noticeable differences will appear whenever the nodes generate messages
of different importance distributions.
Total Import. Importance Number of Network
Received mean value Receptions Lifetime
Type NS 1755.40 1.76 999.02 1000
Type AT 5526.04 5.99 923.12 11580.70
Type LAF 5612.34 6.11 919.18 12459.76
Type GAF 5612.22 6.11 919.08 12468.58
Table 4. Averaged performance when the importance values are generated according to an
exponential distribution
Additionally, the difference is almost unnoticeable when comparing the LAF and GAF nodes
(the actual difference depends on the distribution tested). This extremely low difference is
due to the effect that nodes tend to propagate their current thresholds to adjoining nodes and,
therefore, the local and global optimization are almost coincident.
Figure 5 shows the threshold evolution for Adaptive Transmitters (a) and Local Adaptive
Forwarders (b). Going into detail, results in Figure 5(a) point out that each node behaves
independently and sets its threshold according to its own available information. The furthest
node from the sink sets the lowest threshold, which clearly corresponds to the isolated node
scenario given that it only has its own generated traffic. Nevertheless, the subsequent nodes
in the network increase their thresholds as a consequence of receiving messages with clipped
importances from their previous nodes. Thus, the closer a node is placed to the sink, the larger
the threshold value is. On the other hand, LAF nodes in Figure 5(b) follow a similar trend.
Again, after a transitory phase, nodes tend to converge to the threshold value established by
the nearest node from the sink. This is a reasonable behavior because it would not make sense
to transmit a message up to the last but one node and then, discard it for not being important
enough. Nodes tend to learn the threshold that the neighbor closer to the sink node is using to
ensure that the message to transmit is forwarded, so that in the end, nodes learn the threshold
estimated by the nearest node to the sink. Learning the probability of retransmission (Q
k
or A
k
in case of global optimization) is equivalent to the effect of backward propagating the
threshold value to the whole sensor network.
Once the last but one node is isolated, two effects can be observed. The first is related to that
node, which is now free to fix its own threshold value according to the messages generated by
itself. And the second is related to the remaining nodes in the network. From the moment the
network is broken down and there is no manner to reach the sink, nodes located on the iso-
lated side of the breakdown will tend to set a lower threshold since the lack of collaboration is
then propagated backwards (the estimation of the probability that a neighbor will re-transmit
the messages decreases). Moreover, since this effect is produced in cascade, nodes will end up
adjusting their thresholds to the threshold of the node located next to the breakdown.
0 500 1000 1500 2000 2500 3000
0
2
4
6
8
10
12
14
16
18
20
Sent Messages
Threshold
(a)
0 500 1000 1500 2000 2500 3000
0
2
4
6
8
10
12
14
16
18
20
Number of Sent Messages
Threshold
(b)
Fig. 5. The decision threshold evolution for Adaptive Transmitters (a) and Local Adaptive
Forwarders (b) as a function of the number of sent messages in a simulation run. A network
topology of 30 equally-spaced nodes located in a row is considered. A uniform importance
distribution U
(0,10) is assumed.
In order to enhance the advantages of using selective forwarding schemes, a new scenario is
proposed. In this case, nodes generate messages according to an exponential distribution, but
the source importance distribution is different in every node so that parameter a follows an
exponential trend, too. Remark that the manner of selecting parameter a implies that message
importance x
k
/∈ [0, 10] any more. For concision, Table 5 lists results only for the AT and LAF
cases.
Total Import. Importance Number of Network
Received mean value Receptions Lifetime
Type AT 11229.32 13.92 811.60 27014.90
Type LAF 11763.35 14.37 825.48 28583.16
Table 5. Averaged performance when the importance values are generated according to an
heterogeneous exponential distribution
In summary, numerical results corroborate that selective forwarding sensor nodes are more
energy-efficient than their non-selective counterparts. On the one hand, the selective forward-
ing schemes significantly increase the network lifetime. On the other hand, they also allow
high importance messages to reach the sink when batteries are scarce.
8. Conclusions
This chapter has introduced an optimum selective forwarding policy in WSN as an energy-
efficient scheme for data transmission. Messages, which were assumed to be graded with an
importance value and which could be eventually discarded, were transmitted by sensor nodes
Emerging Communications for Wireless Sensor Networks162
according to a forwarding policy, which considered consumption patterns, available energy
resources in nodes, the importance of the current message and the statistical description of
such importances.
Forwarding schemes were designed for three different scenarios (a) when sensors maximize
the importance of their own transmitted messages (selective transmitter); (b) when sensors
maximize the importance of messages that have been successfully retransmitted by at least
one of its neighbors (selective forwarder with local optimization); and (c) when sensors max-
imize the importance of the messages that successfully arrive to the sink (selective forwarder
with global optimization). Interestingly, the structure of the optimal scheme was the same in
all three cases and consisted of comparing the received importance and the forwarding thresh-
old. The expression to find the optimum threshold varies with time and is slightly different for
each scenario. It is worth remarking that the developed schemes were optimal from an impor-
tance perspective, efficiently exploited the energy resources, entailed very low computational
complexity and were amenable to distributed implementation, all desirable characteristics in
WSN.
The three schemes have been compared under different criteria. From an overall network
efficiency perspective, the first scheme performed worse that its counterparts, but it required
less signaling overhead. On the contrary, the last scheme was the best in terms of network
performance, but it required the implementation of feedback messages from the sink to the
nodes of the WSN. Numerical results showed that for the tested cases the differences among
the three schemes were small. This suggests that the second scheme, which is just slightly
more complex than the first one and performs evenly with the third one, can be the best
candidate in most practical scenarios.
Finally, suboptimal schemes that operate under less demanding conditions than those for the
optimal ones were also explored. Under certain simplifying operating conditions, a constant
forwarding threshold which did not change along time and entailed asymptotic optimality,
was also developed and closed-form expressions were obtained. The gain of the selective for-
warding policy compared to a non-selective one was quantified and it was proved to have
a strong dependence on energy expenses (transmission, reception and idle), the frequency
of idle times and the statistical distribution of importances. Going further, as nodes are in-
tegrated in a sensor network, information coming from the neighborhood was incorporated
into the statistical model and thus, an expression for the optimal forwarding threshold was
obtained, which turned into a general expression of the optimal selective transmitter. Finally,
for cases were the importance distribution of messages was unknown (or it varied with time),
a blind algorithm, which is based on the received messages, caught this distribution on-the-fly
and required less computational complexity, was proposed.
9. Acknowledgments
This work was partially funded by the Spanish Ministry of Science and Innovation Grant No.
TEC2008-01348 and by the Gov. of C.A. Madrid Grant No. P-TIC-000223-0505. We also want
to thank Harold Molina for the technical support given to the elaboration of this manuscript.
10. References
Akyildiz, I. F., Su, W., Sankarasubramaniam, Y. & Cayirci, E. (2002). A Survey on Sensor
Networks, IEEE Comm. Magazine 40(8): 102–114.
Arroyo-Valles, R., Alaiz-Rodriguez, R., Guerrero-Curieses, A. & Cid-Sueiro, J. (2007). Q-
Probabilistic Routing in Wireless Sensor Network, Proc. 3th Int’l Conf. Intelligent Sen-
sor, Sensor Networks and Information Processing (ISSNIP ’07).
Arroyo-Valles, R., Marques, A. G. & Cid-Sueiro, J. (2007). Energy-aware Geographic Forward-
ing of Prioritized Messages in Wireless Sensor Networks, Proc. 4th IEEE Int’l Conf. on
Mobile Ad-hoc and Sensor Systems (MASS ’07).
Arroyo-Valles, R., Marques, A. G. & Cid-Sueiro, J. (2008). Energy-efficient Selective For-
warding for Sensor Networks, Proc. Workshop on Energy in Wireless Sensor Networks
(WEWSN’08), in conjunction with DCOSS’08.
Arroyo-Valles, R., Marques, A. G. & Cid-Sueiro, J. (2009). Optimal Selective Transmission
under Energy Constraints in Sensor Networks, IEEE Transactions on Mobile Computing
.
Arroyo-Valles, R., Marques, A. G., Vinagre-D
´
ıaz, J. & Cid-Sueiro, J. (2006). A Bayesian Deci-
sion Model for Intelligent Routing in Sensor Networks, Proc. 3rd IEEE Int’l Symp. on
Wireless Comm. Systems (ISWCS ’06).
Corless, R. M., Gonnet, G. H., Hare, D. E. G., Jeffrey, D. J. & Knuth, D. E. (1996). On the
Lambert W function, Advances in Computational Mathematics 5: 329–359.
Karp, B. & Kung, H. (2000). Greedy Perimeter Stateless Routing for Wireless Networks, Proc.
6th Annual ACM/IEEE Int’l Conf. on Mobile Computing and Networking (MobiCom 2000),
pp. 243–254.
Marques, A. G., Wang, X. & Giannakis, G. B. (2008). Minimizing Transmit-Power for Coher-
ent Communications in Wireless Sensor Networks with Finite-Rate Feedback, IEEE
Transac. on Signal Processing 56(8): 4446–4457.
Merrett, G., Al-Hashimi, B., White, N. & Harris, N. (2005). Information Managed Wireless
Sensor Networks with Energy Aware Nodes, Proc. NSTI Nanotechnology Conf. and
Trade Show (NanoTech ’05), pp. 367–370.
Mujumdar, S. J. (2004). Prioritized Geographical Routing in Sensor Networks, Master’s thesis,
Vanderbilt University, Tennessee.
Qiu, J., Tao, Y. & Lu, S. (2005). Grid and Cooperative Computing, Vol. 3795/2005, Springer Berlin
/ Heidelberg, chapter Differentiated Application Independent Data Aggregation in
Wireless Sensor Networks, pp. 529–534.
Rivera, J., Bojorquez, G., Chacon, M., Herrera, G. & Carrillo, M. (2007). A Fuzzy Message
Priority Arbitration Approach for Sensor Networks, Proc. North American Fuzzy In-
formation Processing Society (NAFIPS ’07), pp. 586–591.
Sennott, L. I. (1999). Stochastic Dynamic Programming and the Control of Queueing Systems, Wiley-
Interscience.
Shih, E., Cho, S H., Ickes, N., Min, R., Sinha, A., Wang, A. & Chandrakasan, A. (2001). Phys-
ical layer driven protocol and algorithm design for energy-efficient wireless sensor
networks, of the 7th Annual ACM/IEEE International Conference on Mobile Computing
and Networking (Mobicom 01).
Shnayder, V., Chen, B., Lorincz, K., Fulford-Jones, T. & Welsh, M. (2005). Sensor Networks for
Medical Care, Proc. 3rd Int’l Conf. on Embedded networked sensor systems.
Wang, X., Marques, A. G. & Giannakis, G. B. (2008). Power-Efficient Resource Allocation and
Quantization for TDMA Using Adaptive Transmission and Limited-Rate Feedback,
IEEE Transac. on Signal Processing 56(8): 4470–4485.
Wood, A. D. & Stankovic, J. A. (2002). Denial of Service in Sensor Networks, IEEE Computer
35(10): 54–62.
Energy-aware Selective Communications in Sensor Networks 163
according to a forwarding policy, which considered consumption patterns, available energy
resources in nodes, the importance of the current message and the statistical description of
such importances.
Forwarding schemes were designed for three different scenarios (a) when sensors maximize
the importance of their own transmitted messages (selective transmitter); (b) when sensors
maximize the importance of messages that have been successfully retransmitted by at least
one of its neighbors (selective forwarder with local optimization); and (c) when sensors max-
imize the importance of the messages that successfully arrive to the sink (selective forwarder
with global optimization). Interestingly, the structure of the optimal scheme was the same in
all three cases and consisted of comparing the received importance and the forwarding thresh-
old. The expression to find the optimum threshold varies with time and is slightly different for
each scenario. It is worth remarking that the developed schemes were optimal from an impor-
tance perspective, efficiently exploited the energy resources, entailed very low computational
complexity and were amenable to distributed implementation, all desirable characteristics in
WSN.
The three schemes have been compared under different criteria. From an overall network
efficiency perspective, the first scheme performed worse that its counterparts, but it required
less signaling overhead. On the contrary, the last scheme was the best in terms of network
performance, but it required the implementation of feedback messages from the sink to the
nodes of the WSN. Numerical results showed that for the tested cases the differences among
the three schemes were small. This suggests that the second scheme, which is just slightly
more complex than the first one and performs evenly with the third one, can be the best
candidate in most practical scenarios.
Finally, suboptimal schemes that operate under less demanding conditions than those for the
optimal ones were also explored. Under certain simplifying operating conditions, a constant
forwarding threshold which did not change along time and entailed asymptotic optimality,
was also developed and closed-form expressions were obtained. The gain of the selective for-
warding policy compared to a non-selective one was quantified and it was proved to have
a strong dependence on energy expenses (transmission, reception and idle), the frequency
of idle times and the statistical distribution of importances. Going further, as nodes are in-
tegrated in a sensor network, information coming from the neighborhood was incorporated
into the statistical model and thus, an expression for the optimal forwarding threshold was
obtained, which turned into a general expression of the optimal selective transmitter. Finally,
for cases were the importance distribution of messages was unknown (or it varied with time),
a blind algorithm, which is based on the received messages, caught this distribution on-the-fly
and required less computational complexity, was proposed.
9. Acknowledgments
This work was partially funded by the Spanish Ministry of Science and Innovation Grant No.
TEC2008-01348 and by the Gov. of C.A. Madrid Grant No. P-TIC-000223-0505. We also want
to thank Harold Molina for the technical support given to the elaboration of this manuscript.
10. References
Akyildiz, I. F., Su, W., Sankarasubramaniam, Y. & Cayirci, E. (2002). A Survey on Sensor
Networks, IEEE Comm. Magazine 40(8): 102–114.
Arroyo-Valles, R., Alaiz-Rodriguez, R., Guerrero-Curieses, A. & Cid-Sueiro, J. (2007). Q-
Probabilistic Routing in Wireless Sensor Network, Proc. 3th Int’l Conf. Intelligent Sen-
sor, Sensor Networks and Information Processing (ISSNIP ’07).
Arroyo-Valles, R., Marques, A. G. & Cid-Sueiro, J. (2007). Energy-aware Geographic Forward-
ing of Prioritized Messages in Wireless Sensor Networks, Proc. 4th IEEE Int’l Conf. on
Mobile Ad-hoc and Sensor Systems (MASS ’07).
Arroyo-Valles, R., Marques, A. G. & Cid-Sueiro, J. (2008). Energy-efficient Selective For-
warding for Sensor Networks, Proc. Workshop on Energy in Wireless Sensor Networks
(WEWSN’08), in conjunction with DCOSS’08.
Arroyo-Valles, R., Marques, A. G. & Cid-Sueiro, J. (2009). Optimal Selective Transmission
under Energy Constraints in Sensor Networks, IEEE Transactions on Mobile Computing
.
Arroyo-Valles, R., Marques, A. G., Vinagre-D
´
ıaz, J. & Cid-Sueiro, J. (2006). A Bayesian Deci-
sion Model for Intelligent Routing in Sensor Networks, Proc. 3rd IEEE Int’l Symp. on
Wireless Comm. Systems (ISWCS ’06).
Corless, R. M., Gonnet, G. H., Hare, D. E. G., Jeffrey, D. J. & Knuth, D. E. (1996). On the
Lambert W function, Advances in Computational Mathematics 5: 329–359.
Karp, B. & Kung, H. (2000). Greedy Perimeter Stateless Routing for Wireless Networks, Proc.
6th Annual ACM/IEEE Int’l Conf. on Mobile Computing and Networking (MobiCom 2000),
pp. 243–254.
Marques, A. G., Wang, X. & Giannakis, G. B. (2008). Minimizing Transmit-Power for Coher-
ent Communications in Wireless Sensor Networks with Finite-Rate Feedback, IEEE
Transac. on Signal Processing 56(8): 4446–4457.
Merrett, G., Al-Hashimi, B., White, N. & Harris, N. (2005). Information Managed Wireless
Sensor Networks with Energy Aware Nodes, Proc. NSTI Nanotechnology Conf. and
Trade Show (NanoTech ’05), pp. 367–370.
Mujumdar, S. J. (2004). Prioritized Geographical Routing in Sensor Networks, Master’s thesis,
Vanderbilt University, Tennessee.
Qiu, J., Tao, Y. & Lu, S. (2005). Grid and Cooperative Computing, Vol. 3795/2005, Springer Berlin
/ Heidelberg, chapter Differentiated Application Independent Data Aggregation in
Wireless Sensor Networks, pp. 529–534.
Rivera, J., Bojorquez, G., Chacon, M., Herrera, G. & Carrillo, M. (2007). A Fuzzy Message
Priority Arbitration Approach for Sensor Networks, Proc. North American Fuzzy In-
formation Processing Society (NAFIPS ’07), pp. 586–591.
Sennott, L. I. (1999). Stochastic Dynamic Programming and the Control of Queueing Systems, Wiley-
Interscience.
Shih, E., Cho, S H., Ickes, N., Min, R., Sinha, A., Wang, A. & Chandrakasan, A. (2001). Phys-
ical layer driven protocol and algorithm design for energy-efficient wireless sensor
networks, of the 7th Annual ACM/IEEE International Conference on Mobile Computing
and Networking (Mobicom 01).
Shnayder, V., Chen, B., Lorincz, K., Fulford-Jones, T. & Welsh, M. (2005). Sensor Networks for
Medical Care, Proc. 3rd Int’l Conf. on Embedded networked sensor systems.
Wang, X., Marques, A. G. & Giannakis, G. B. (2008). Power-Efficient Resource Allocation and
Quantization for TDMA Using Adaptive Transmission and Limited-Rate Feedback,
IEEE Transac. on Signal Processing 56(8): 4470–4485.
Wood, A. D. & Stankovic, J. A. (2002). Denial of Service in Sensor Networks, IEEE Computer
35(10): 54–62.
Emerging Communications for Wireless Sensor Networks164
Machine Learning Across the WSN Layers 165
Machine Learning Across the WSN Layers
Anna F¨orster and Amy L. Murphy
0
Machine Learning Across the WSN Layers
Anna Förster
1,2
and Amy L. Murphy
3
1
University of Lugano,
2
Networking Laboratory SUPSI,
3
FBK-IRST
1,2
Switzerland,
3
Italy
Wireless sensor networks (WSNs) have seen rapid research and industrial development in
recent years. Both the costs and size of individual nodes have been constantly decreasing,
opening new opportunities for a wide range of applications. Nevertheless, designing software
to achieve energy-efficient, robust and flexible data dissemination remains an open problem
with many competing solutions.
In parallel, researchers have effectively exploited machine learning techniques to achieve ef-
ficient solutions in environments with distribution and rapidly fluctuating properties, analo-
gous to WSN domains. Applying machine learning techniques to WSNs inherently has the
potential to improve the robustness and flexibility of communications and data processing,
while simultaneously optimizing energy expenditure.
This chapter concentrates on applications of machine learning at all layers in the WSN net-
work stack. First, it provides a brief background and summary of three of the most com-
monly used machine learning techniques: reinforcement learning, neural networks and deci-
sion trees. Then, it uses example research from the literature to describe current efforts at each
level of the stack, and outlines future opportunities.
1. Wireless Sensor Networks
Extensive research effort has been invested in recent years to optimize communications in
wireless sensor networks (WSNs). Researchers and application developers typically use a
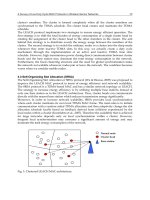
communication stack model such as that depicted in Figure 1 to structure the communications
of WSNs and to better manage its challenges. In particular, the following properties of WSNs
should be considered while designing innovative and efficient solutions (Akyildiz et al., 2002;
Römer & Mattern, 2004).
• Wireless ad-hoc nature. No fixed communication infrastructure exists. The shared wire-
less medium places restrictions on the communication between nodes and poses new
problems such as asymmetric links. However, it offers the broadcast advantage: a trans-
mitted packet, even if sent in unicast to another node, can be overhead and thus re-
ceived by all neighbors of the transmitter.
• Mobility and topology changes. WSNs may support dynamic application scenarios. New
nodes may be added to the network, and existing nodes may move either within or out
of the network. Nodes may cease to function, and connectivity among surviving nodes
changes over time. WSN applications must be robust against such topology dynamics.
• Energy limitations. The basic WSN scenario includes a large number of sensor nodes,
and a limited number of more powerful base stations. As such, most WSN nodes have
9
Emerging Communications for Wireless Sensor Networks166
Neighborhood management
Medium Access
Physical layer
Clustering
Routing
Application
Fig. 1. The WSN communication stack
limited energy supplies and maintenance or battery recharging is often impossible after
deployment. Communication tasks consume a large proportion of the energy available
on the nodes, and thus to ensure sustained long-term operation, radio communication
must be frugally managed.
• Physical distribution. Each node in a WSN is an autonomous computational unit that
communicates with its neighbors via messages. Data is collected throughout the net-
work and can be gathered at a central station only with high communication costs. Con-
sequently, algorithms that require global information from the entire network become
very expensive. Thus, distributed algorithms are highly desirable.
The next section proceeds with a brief introduction to machine learning approaches that have
been successfully applied to one or more layers of the communication stack. We then provide
concrete examples of how machine learning has been exploited to minimize communication
overhead at all layers from neighborhood management up to the application.
2. Machine Learning Techniques
Machine learning (ML) is a sub-field of artificial intelligence that ”is concerned with the question
of how to construct computer programs that automatically improve from experience“ (Mitchell, 1997).
Precisely this property makes the family of ML algorithms and techniques appealing for ef-
ficient communications in WSNs. This section presents some widely applied ML approaches
that form the basis for the exemplary applications in the following sections. Alternate ML
techniques include, among many others, genetic algorithms (Mitchell, 1997) and swarm in-
telligence algorithms such as ant colony optimization (Dorigo & Stuetzle, 2004). While these
are powerful machine learning techniques for solving various challenging problems, they are
less suitable for communications in wireless sensor networks (Kulkarni et al., 2009) because
of their high communication overhead.
2.1 Decision Tree Learning
In many classification problems the items to be classified exhibit a number of clearly defined
features, represented as attribute-value pairs. For example, if we want to classify all possible
fruits, we can use features such as size, shape, color, taste, etc. with corresponding attribute-
value pairs such as color = orange. We could define the possible classification clusters by their
features and attribute-value pairs. Then, for some unclassified object, we check all of its fea-
tures to match it with one of the clusters. However, a so called classification tree is more
efficient, since it offers structure the classification approach and usually classifies a sample
based only on a few features. In such a tree the leaves represent classification clusters and the
branches represent conjunctions of features. Continuing with our fruit example, a classifica-
tion tree will ask at the very first branch what is the color of the sample. If there is only one
cluster with the color blue (e.g., blueberry), then the branch leads directly to the classification
leaf of blueberries without asking for any other features. It is clear from this example that the
most important question when constructing such trees is “which attribute to check at the root of
the tree, which next?”
Decision tree learning is a machine learning technique that uses a set of already classified
training samples for constructing the optimal tree. Optimal in this case refers to the number
of feature checks before classification. Of course, the classification problem might exhibit noise
samples, which also need to be accommodated. For example, strawberries are usually red, but
sometimes we observe also green ones. Thus, the decision tree will either wrongly classify the
green strawberry as something else or it needs to use all of the other features (size, shape, etc.)
and ignore the color. The final decision depends on the samples in the training set and on the
importance of different features. As we have seen above, some of the features may become
irrelevant, while others become highly important.
There are two main algorithms for constructing decision trees: ID3 and the its successor
C4.5 (Mitchell, 1997). Each sample s
i
from the training set S consists of a vector of feature
values f
i
and is already classified as belonging to cluster c
j
. C4.5 computes for each feature
the information gain when splitting on this feature. In other words, which feature separates
the clusters best? In our fruit example from above, checking for the shape in the root of the tree
is probably a bad decision, since many if not all fruits are round. However, checking for the
size might separate watermelons and melons from all the rest very well. Thus, the informa-
tion gain of the feature size is higher than for any other feature. C4.5 takes the feature with the
highest information gain and puts it in the root of the tree. Then it recursively computes the
information gain for the resulting subclasses until all or nearly all samples from the training
set are classified. Clearly, not all of the samples will be classified successfully, as exemplified
in the discussion above. However, this is not possible even with the brute-force method of
checking all possible features and their values, because the training set also includes noisy
data. A formal description of decision tree learning can be found in (Mitchell, 1997).
In the context of wireless sensor networks, classification problems like this arise when classi-
fying links as good or bad based on data such as signal strength or delivery rate, or classifying
sensory data as important or not. We show an application of decision trees to link quality
estimation in Section 3. Decision tree learning is suited for such classification problems since
it is fast to both train and execute. Additionally, implementing a decision tree on a resource-
restricted sensor node is simple. On the other hand, training should be performed offline to
save node energy, requiring the classification problem to be relatively stable.
2.2 Neural Networks
An artificial neural network (or simply neural network, NN) is a mathematical models of
a function F : X
→ Y. The initial inspiration comes from biological networks of neurons.
NNs consist of simple nodes or neurons, interconnected as in Figure 2. Simple functions are
usually associated with each node (e.g., addition) and weights are assigned to the connections
between the nodes. Data flows from the input (left column of neurons in Figure 2) through the
whole network, using the connections between the nodes and arriving at the output neurons
(right column of neurons). The most important property of neural networks is their ability to
Machine Learning Across the WSN Layers 167
Neighborhood management
Medium Access
Physical layer
Clustering
Routing
Application
Fig. 1. The WSN communication stack
limited energy supplies and maintenance or battery recharging is often impossible after
deployment. Communication tasks consume a large proportion of the energy available
on the nodes, and thus to ensure sustained long-term operation, radio communication
must be frugally managed.
• Physical distribution. Each node in a WSN is an autonomous computational unit that
communicates with its neighbors via messages. Data is collected throughout the net-
work and can be gathered at a central station only with high communication costs. Con-
sequently, algorithms that require global information from the entire network become
very expensive. Thus, distributed algorithms are highly desirable.
The next section proceeds with a brief introduction to machine learning approaches that have
been successfully applied to one or more layers of the communication stack. We then provide
concrete examples of how machine learning has been exploited to minimize communication
overhead at all layers from neighborhood management up to the application.
2. Machine Learning Techniques
Machine learning (ML) is a sub-field of artificial intelligence that ”is concerned with the question
of how to construct computer programs that automatically improve from experience“ (Mitchell, 1997).
Precisely this property makes the family of ML algorithms and techniques appealing for ef-
ficient communications in WSNs. This section presents some widely applied ML approaches
that form the basis for the exemplary applications in the following sections. Alternate ML
techniques include, among many others, genetic algorithms (Mitchell, 1997) and swarm in-
telligence algorithms such as ant colony optimization (Dorigo & Stuetzle, 2004). While these
are powerful machine learning techniques for solving various challenging problems, they are
less suitable for communications in wireless sensor networks (Kulkarni et al., 2009) because
of their high communication overhead.
2.1 Decision Tree Learning
In many classification problems the items to be classified exhibit a number of clearly defined
features, represented as attribute-value pairs. For example, if we want to classify all possible
fruits, we can use features such as size, shape, color, taste, etc. with corresponding attribute-
value pairs such as color = orange. We could define the possible classification clusters by their
features and attribute-value pairs. Then, for some unclassified object, we check all of its fea-
tures to match it with one of the clusters. However, a so called classification tree is more
efficient, since it offers structure the classification approach and usually classifies a sample
based only on a few features. In such a tree the leaves represent classification clusters and the
branches represent conjunctions of features. Continuing with our fruit example, a classifica-
tion tree will ask at the very first branch what is the color of the sample. If there is only one
cluster with the color blue (e.g., blueberry), then the branch leads directly to the classification
leaf of blueberries without asking for any other features. It is clear from this example that the
most important question when constructing such trees is “which attribute to check at the root of
the tree, which next?”
Decision tree learning is a machine learning technique that uses a set of already classified
training samples for constructing the optimal tree. Optimal in this case refers to the number
of feature checks before classification. Of course, the classification problem might exhibit noise
samples, which also need to be accommodated. For example, strawberries are usually red, but
sometimes we observe also green ones. Thus, the decision tree will either wrongly classify the
green strawberry as something else or it needs to use all of the other features (size, shape, etc.)
and ignore the color. The final decision depends on the samples in the training set and on the
importance of different features. As we have seen above, some of the features may become
irrelevant, while others become highly important.
There are two main algorithms for constructing decision trees: ID3 and the its successor
C4.5 (Mitchell, 1997). Each sample s
i
from the training set S consists of a vector of feature
values f
i
and is already classified as belonging to cluster c
j
. C4.5 computes for each feature
the information gain when splitting on this feature. In other words, which feature separates
the clusters best? In our fruit example from above, checking for the shape in the root of the tree
is probably a bad decision, since many if not all fruits are round. However, checking for the
size might separate watermelons and melons from all the rest very well. Thus, the informa-
tion gain of the feature size is higher than for any other feature. C4.5 takes the feature with the
highest information gain and puts it in the root of the tree. Then it recursively computes the
information gain for the resulting subclasses until all or nearly all samples from the training
set are classified. Clearly, not all of the samples will be classified successfully, as exemplified
in the discussion above. However, this is not possible even with the brute-force method of
checking all possible features and their values, because the training set also includes noisy
data. A formal description of decision tree learning can be found in (Mitchell, 1997).
In the context of wireless sensor networks, classification problems like this arise when classi-
fying links as good or bad based on data such as signal strength or delivery rate, or classifying
sensory data as important or not. We show an application of decision trees to link quality
estimation in Section 3. Decision tree learning is suited for such classification problems since
it is fast to both train and execute. Additionally, implementing a decision tree on a resource-
restricted sensor node is simple. On the other hand, training should be performed offline to
save node energy, requiring the classification problem to be relatively stable.
2.2 Neural Networks
An artificial neural network (or simply neural network, NN) is a mathematical models of
a function F : X
→ Y. The initial inspiration comes from biological networks of neurons.
NNs consist of simple nodes or neurons, interconnected as in Figure 2. Simple functions are
usually associated with each node (e.g., addition) and weights are assigned to the connections
between the nodes. Data flows from the input (left column of neurons in Figure 2) through the
whole network, using the connections between the nodes and arriving at the output neurons
(right column of neurons). The most important property of neural networks is their ability to
Emerging Communications for Wireless Sensor Networks168
Input 0
Input 1
Input 2
Input 3
Input 4
Input 5
Output 3
Output 2
Output 1
Output 0
Fig. 2. A generic architecture of an artificial neural network with input and output layers.
learn — to adjust the weights between the input and the output to exactly reflect the learned
function.
For learning or training a neural network, a set of training data is needed, where possible
inputs have already been mapped to the needed output. For example, for classification of
hand-written numbers, different pictures (input) are classified as numbers (output). However,
in contrast to decision trees, the input cannot be described with features and attribute-value
pairs. Instead, it is represented as a point in an N-dimensional space. For example, a hand
written picture of the size 32
× 32 pixels is represented as a point in the 32 × 32 = 1024
dimensional space. There will also be 1024 input neurons in the neural network and exactly 10
output neurons, one for each digit. The weights connecting the input neurons with the output
ones need to be set such that the correct output neuron “fires” — only the output neuron
has a value of 1 and all others a value of 0. This is done by presenting the network with
examples, consisting of input and output. With every sample, the weights are corrected such
that the correct neuron fires. Thus, in our 1024-dimensional space, the hand-written samples
will cluster around some points in this space, representing the different digits from 0 to 9.
Incoming input samples can be then classified according to their distance to the clusters and
the closest cluster is taken.
The above described neural network is a so called supervised offline learning algorithm. Su-
pervised refers to the training set, which has already been classified. Offline refers to the nec-
essary training of the network before using it for classification. However, there also exist
unsupervised and online learning neural networks. An example of such a network is used for
learning the data model for incoming sensor readings in Section 6. More information about
neural networks and how to train them can be found in (Mitchell, 1997).
Neural networks are well suited for complex classification problems where features or
attribute-values pairs are not available. However, they have larger memory and processing
requirements than, for example, decision tree learning. On the other hand, as we will show
in Section 6, these techniques are applicable in WSNs for static classification problems such as
data models or link quality estimation. In addition, they can be efficiently implemented even
on standard sensor nodes because of their relatively low memory requirements.
left
right
forward
backward
internal state
pool of possible
actions
select an action
fulfill an action
environment
reward
agent
Fig. 3. General reinforcement learning model. The agent selects one action according to its
current internal state (current view of the environment and previous knowledge), fulfills this
action and observes a reward.
2.3 Reinforcement Learning
Reinforcement learning (RL) (Mitchell, 1997; Sutton & Barto, 1998) is a biologically inspired
machine learning technique, where the learning agent acquires its knowledge from direct in-
teraction with its environment. A simple example is a mouse in a maze, trying to find the path
to a piece of cheese (see Figure 3). At any moment, it must select a direction to move. The re-
sult of each action is either finding cheese or not. This maps to the reinforcement learning
technique in which agents (e.g., the mouse) select actions (e.g., direction to move) and receive
rewards (e.g., cheese) from the environment for each action. A well-known and widely used
RL algorithm is Q-Learning, which model consists of:
Agent states. The learning agent has a finite set of possible states S and s
t
represents the
agent’s state at time step t. In our example from Figure 3, the state of the mouse is its current
position in the maze.
Actions. Q-Learning associates a different set of actions A
S
to each of the states in S. In
our maze environment, the actions are represented by the movement steps of the mouse —
forward, backward, left, right.
Immediate rewards. There is an associated immediate reward r
(s
t
, a
t
) with each of the state
transitions. In our example, all of the state transitions that do not lead to the goal state have
immediate rewards of 0 (no cheese) and the ones leading to the goal state have an immediate
reward of 1 (cheese reached). The agent can see only the actions with their associated rewards
from its current state. It does not have any global knowledge about the environment, its states
and their rewards.
Machine Learning Across the WSN Layers 169
Input 0
Input 1
Input 2
Input 3
Input 4
Input 5
Output 3
Output 2
Output 1
Output 0
Fig. 2. A generic architecture of an artificial neural network with input and output layers.
learn — to adjust the weights between the input and the output to exactly reflect the learned
function.
For learning or training a neural network, a set of training data is needed, where possible
inputs have already been mapped to the needed output. For example, for classification of
hand-written numbers, different pictures (input) are classified as numbers (output). However,
in contrast to decision trees, the input cannot be described with features and attribute-value
pairs. Instead, it is represented as a point in an N-dimensional space. For example, a hand
written picture of the size 32
× 32 pixels is represented as a point in the 32 × 32 = 1024
dimensional space. There will also be 1024 input neurons in the neural network and exactly 10
output neurons, one for each digit. The weights connecting the input neurons with the output
ones need to be set such that the correct output neuron “fires” — only the output neuron
has a value of 1 and all others a value of 0. This is done by presenting the network with
examples, consisting of input and output. With every sample, the weights are corrected such
that the correct neuron fires. Thus, in our 1024-dimensional space, the hand-written samples
will cluster around some points in this space, representing the different digits from 0 to 9.
Incoming input samples can be then classified according to their distance to the clusters and
the closest cluster is taken.
The above described neural network is a so called supervised offline learning algorithm. Su-
pervised refers to the training set, which has already been classified. Offline refers to the nec-
essary training of the network before using it for classification. However, there also exist
unsupervised and online learning neural networks. An example of such a network is used for
learning the data model for incoming sensor readings in Section 6. More information about
neural networks and how to train them can be found in (Mitchell, 1997).
Neural networks are well suited for complex classification problems where features or
attribute-values pairs are not available. However, they have larger memory and processing
requirements than, for example, decision tree learning. On the other hand, as we will show
in Section 6, these techniques are applicable in WSNs for static classification problems such as
data models or link quality estimation. In addition, they can be efficiently implemented even
on standard sensor nodes because of their relatively low memory requirements.
left
right
forward
backward
internal state
pool of possible
actions
select an action
fulfill an action
environment
reward
agent
Fig. 3. General reinforcement learning model. The agent selects one action according to its
current internal state (current view of the environment and previous knowledge), fulfills this
action and observes a reward.
2.3 Reinforcement Learning
Reinforcement learning (RL) (Mitchell, 1997; Sutton & Barto, 1998) is a biologically inspired
machine learning technique, where the learning agent acquires its knowledge from direct in-
teraction with its environment. A simple example is a mouse in a maze, trying to find the path
to a piece of cheese (see Figure 3). At any moment, it must select a direction to move. The re-
sult of each action is either finding cheese or not. This maps to the reinforcement learning
technique in which agents (e.g., the mouse) select actions (e.g., direction to move) and receive
rewards (e.g., cheese) from the environment for each action. A well-known and widely used
RL algorithm is Q-Learning, which model consists of:
Agent states. The learning agent has a finite set of possible states S and s
t
represents the
agent’s state at time step t. In our example from Figure 3, the state of the mouse is its current
position in the maze.
Actions. Q-Learning associates a different set of actions A
S
to each of the states in S. In
our maze environment, the actions are represented by the movement steps of the mouse —
forward, backward, left, right.
Immediate rewards. There is an associated immediate reward r
(s
t
, a
t
) with each of the state
transitions. In our example, all of the state transitions that do not lead to the goal state have
immediate rewards of 0 (no cheese) and the ones leading to the goal state have an immediate
reward of 1 (cheese reached). The agent can see only the actions with their associated rewards
from its current state. It does not have any global knowledge about the environment, its states
and their rewards.
Emerging Communications for Wireless Sensor Networks170
Action costs. In addition to rewards, there is also a cost c(s
t
, a
t
) associated with each action in
each state. This is again a scalar value, representing how costly this action is. In our example,
it costs one unit of energy (one bite of cheese) for the mouse to make any movement. Costs
are often considered negative rewards, thus they are subtracted directly from the immediate
reward.
Value function. In contrast to immediate rewards, which are associated to each action in each
state and are easily observable, the value function represents the expected total accumulated
reward. The goal of the agent is to learn a sequence of actions with a maximum value function,
that is, the reward on the taken path is maximized.
Q-Values. To represent the currently expected total future reward at any state, a Q-Value
is associated to each action and state Q
(s
t
, a
t
). The Q-Value represents the memory of the
learning agent in terms of the quality of the action in this particular state. In the beginning Q-
Values are usually initialized with zeros, representing the fact that the agent knows nothing.
Through trial and experience the agent learns how good some action was. The Q-Values of
the actions change through learning and finally represent the absolute value function. After
convergence, taking the actions with the greatest Q-Values in each state guarantees taking the
optimal decision (path).
Updating a Q-Value. A simple rule exists to update a Q-Value after each step of the agent:
Q
(s
t+1
, a
t
) = Q(s
t
, a
t
) + γ(R(s
t
, a
t
) − Q(s
t
, a
t
)) (1)
The new Q-Value of the pair
{s
t+1
, a
t
} in state s
t+1
after taking action a
t
in state s
t
is computed
as the sum of the old Q-Value and a correction term. This term consists of the received reward
and the old Q-Value. γ is the learning constant. It prevents the Q-Values from changing too
fast and thus oscillating. The total received reward is computed as:
R
(s
t
, a
t
) = r(s
t
, a
t
) + c(s
t
, a
t
) (2)
Where r
(s
t
, a
t
) is the immediate reward as defined above and c(s
t
, a
t
) is the cost of taking the
action a
t
in state s
t
.
Exploration strategy (action selection policy). Learning is performed in episodes, e.g., the
mouse takes actions in its environment and updates the associated Q-Values until reaching
the cheese. After completion, a new episode begins, repeating until the Q-Values no longer
change. The question is how to select the next action. Always taking the actions with max-
imum Q-Value (greedy policy) will result in finding locally minimal solutions. On the other
hand, selecting always random (random policy) will mean ignoring prior experience and
spending too much energy to learn the complete environment.
These two extreme strategies are called exploitation and exploration of routes. The problem
of combining and weigthing both so that optimal results are achieved as fast as possible has
been extensively studied in machine learning (Sutton & Barto, 1998). The most commonly
used strategy is called -greedy: with probability the agent takes a random action and with
probability
(1 − ) it takes the best available action.
RL is well suited for distributed problems such as routing. It has medium requirements for
memory and rather low computation needs at the individual nodes. This arises from the need
to keep many different possible actions and their values. It needs some time to converge, but
it is easy to implement, highly flexible to topology changes and learns the optimal solution
(e.g., shortest paths).
3. Neighborhood Management Layer
One major problem of communications in wireless sensor networks is the unreliability of the
links. At any time, a previously reliable link may disappear, while others might become more
reliable than before. This is influenced by the environmental conditions (weather, moving
people, etc.) and cannot be controlled or predicted. Unreliable links are a great challenge for
routing protocols, since selecting reliable routes is crucial for saving energy in the network as
a whole. Thus, a special layer is needed between the medium access and the routing layers
to provide the routing layer with up-to-date information of the reliability of connections to
neighbors. The resulting protocols are called link or neighborhood management protocols.
The most important properties of a good neighborhood management protocol are (Karl &
Willig, 2005):
• Precision. The links should be precisely evaluated in their quality and reliability.
• Agility. The link manager should react quickly to changes.
• Stability. The link manager should not be influenced by short aberrations.
• Energy efficiency. The link manager should spend as little communication and pro-
cessing power for its operation as possible.
Many researchers have put extensive effort in searching for good link estimators. Two main
classes exist: passive and active estimators. Passive estimators use readily available informa-
tion on the nodes for their estimations, such as RSSI of received packets, number of received
packets, etc. Active estimators pro-actively send probe packets to discover the link quality to
their neighbors. Of course combinations of passive and active estimators also exist that use
readily available information as much as possible and send additional probe packets when
needed.
Traditional approaches use rules of thumb to estimate the quality of links given some local
information on the nodes. Typically they use rules such as "if RSSI
> 80 then quality =
good", implement them on a hardware testbed, test it and fine-tune the parameters of the
approach. However, this design phase is long and inefficient, based mainly on experience
and intuition. Nevertheless, some of these approaches have been extensively evaluated and
widely used for real applications, e.g., through integration with existing routing protocols
such as MintRoute (Woo et al., 2003) or Arbutus (Puccinelli & Haenggi, 2008).
3.1 MetricMap: Supervised Learning for Link Quality Estimation.
A more sophisticated approach is to try to automatically gather relevant features and proper-
ties readily available at the nodes, and to learn to estimate the quality of the links from them. A
simple, yet powerful algorithm is MetricMap (Wang et al., 2006), developed at Princeton Uni-
versity in 2006. MetricMap uses decision tree learning to offline learn to estimate link quality
based on previously gathered link samples. The decision trees uses locally available data and
learns to classify links as good or bad. The acquired rules are integrated with a routing proto-
col (in this case MintRoute (Woo et al., 2003)) and are used online to predict link quality based
only on locally available information such as delivery rate or RSSI levels of incoming packets.
The authors of MetricMap designed their algorithm in two main steps: sample collection and
offline training. First, they used the MistLab
1
sensor network testbed at MIT to gather link
samples together with all available features, shown in Table 1. Each link sample was labeled
“good” or “bad”, according to its Link Quality Indication (LQI) value.
1
Machine Learning Across the WSN Layers 171
Action costs. In addition to rewards, there is also a cost c(s
t
, a
t
) associated with each action in
each state. This is again a scalar value, representing how costly this action is. In our example,
it costs one unit of energy (one bite of cheese) for the mouse to make any movement. Costs
are often considered negative rewards, thus they are subtracted directly from the immediate
reward.
Value function. In contrast to immediate rewards, which are associated to each action in each
state and are easily observable, the value function represents the expected total accumulated
reward. The goal of the agent is to learn a sequence of actions with a maximum value function,
that is, the reward on the taken path is maximized.
Q-Values. To represent the currently expected total future reward at any state, a Q-Value
is associated to each action and state Q
(s
t
, a
t
). The Q-Value represents the memory of the
learning agent in terms of the quality of the action in this particular state. In the beginning Q-
Values are usually initialized with zeros, representing the fact that the agent knows nothing.
Through trial and experience the agent learns how good some action was. The Q-Values of
the actions change through learning and finally represent the absolute value function. After
convergence, taking the actions with the greatest Q-Values in each state guarantees taking the
optimal decision (path).
Updating a Q-Value. A simple rule exists to update a Q-Value after each step of the agent:
Q
(s
t+1
, a
t
) = Q(s
t
, a
t
) + γ(R(s
t
, a
t
) − Q(s
t
, a
t
)) (1)
The new Q-Value of the pair
{s
t+1
, a
t
} in state s
t+1
after taking action a
t
in state s
t
is computed
as the sum of the old Q-Value and a correction term. This term consists of the received reward
and the old Q-Value. γ is the learning constant. It prevents the Q-Values from changing too
fast and thus oscillating. The total received reward is computed as:
R
(s
t
, a
t
) = r(s
t
, a
t
) + c(s
t
, a
t
) (2)
Where r
(s
t
, a
t
) is the immediate reward as defined above and c(s
t
, a
t
) is the cost of taking the
action a
t
in state s
t
.
Exploration strategy (action selection policy). Learning is performed in episodes, e.g., the
mouse takes actions in its environment and updates the associated Q-Values until reaching
the cheese. After completion, a new episode begins, repeating until the Q-Values no longer
change. The question is how to select the next action. Always taking the actions with max-
imum Q-Value (greedy policy) will result in finding locally minimal solutions. On the other
hand, selecting always random (random policy) will mean ignoring prior experience and
spending too much energy to learn the complete environment.
These two extreme strategies are called exploitation and exploration of routes. The problem
of combining and weigthing both so that optimal results are achieved as fast as possible has
been extensively studied in machine learning (Sutton & Barto, 1998). The most commonly
used strategy is called -greedy: with probability the agent takes a random action and with
probability
(1 − ) it takes the best available action.
RL is well suited for distributed problems such as routing. It has medium requirements for
memory and rather low computation needs at the individual nodes. This arises from the need
to keep many different possible actions and their values. It needs some time to converge, but
it is easy to implement, highly flexible to topology changes and learns the optimal solution
(e.g., shortest paths).
3. Neighborhood Management Layer
One major problem of communications in wireless sensor networks is the unreliability of the
links. At any time, a previously reliable link may disappear, while others might become more
reliable than before. This is influenced by the environmental conditions (weather, moving
people, etc.) and cannot be controlled or predicted. Unreliable links are a great challenge for
routing protocols, since selecting reliable routes is crucial for saving energy in the network as
a whole. Thus, a special layer is needed between the medium access and the routing layers
to provide the routing layer with up-to-date information of the reliability of connections to
neighbors. The resulting protocols are called link or neighborhood management protocols.
The most important properties of a good neighborhood management protocol are (Karl &
Willig, 2005):
• Precision. The links should be precisely evaluated in their quality and reliability.
• Agility. The link manager should react quickly to changes.
• Stability. The link manager should not be influenced by short aberrations.
• Energy efficiency. The link manager should spend as little communication and pro-
cessing power for its operation as possible.
Many researchers have put extensive effort in searching for good link estimators. Two main
classes exist: passive and active estimators. Passive estimators use readily available informa-
tion on the nodes for their estimations, such as RSSI of received packets, number of received
packets, etc. Active estimators pro-actively send probe packets to discover the link quality to
their neighbors. Of course combinations of passive and active estimators also exist that use
readily available information as much as possible and send additional probe packets when
needed.
Traditional approaches use rules of thumb to estimate the quality of links given some local
information on the nodes. Typically they use rules such as "if RSSI
> 80 then quality =
good", implement them on a hardware testbed, test it and fine-tune the parameters of the
approach. However, this design phase is long and inefficient, based mainly on experience
and intuition. Nevertheless, some of these approaches have been extensively evaluated and
widely used for real applications, e.g., through integration with existing routing protocols
such as MintRoute (Woo et al., 2003) or Arbutus (Puccinelli & Haenggi, 2008).
3.1 MetricMap: Supervised Learning for Link Quality Estimation.
A more sophisticated approach is to try to automatically gather relevant features and proper-
ties readily available at the nodes, and to learn to estimate the quality of the links from them. A
simple, yet powerful algorithm is MetricMap (Wang et al., 2006), developed at Princeton Uni-
versity in 2006. MetricMap uses decision tree learning to offline learn to estimate link quality
based on previously gathered link samples. The decision trees uses locally available data and
learns to classify links as good or bad. The acquired rules are integrated with a routing proto-
col (in this case MintRoute (Woo et al., 2003)) and are used online to predict link quality based
only on locally available information such as delivery rate or RSSI levels of incoming packets.
The authors of MetricMap designed their algorithm in two main steps: sample collection and
offline training. First, they used the MistLab
1
sensor network testbed at MIT to gather link
samples together with all available features, shown in Table 1. Each link sample was labeled
“good” or “bad”, according to its Link Quality Indication (LQI) value.
1
Emerging Communications for Wireless Sensor Networks172
Table 1. Link sample features used in MetricMap.
Feature Description Locality
RSSI received signal strength indication local
sendBuf send buffer size local
fwdBuf forward buffer size local
depth node depth from base station non-local
CLA channel load assessment local
pSend forward probability local
pRecv backward probability local
RSSI
depth RSSI
CLA
<=212
>212
RSSI
<=5
BAD GOOD
<=211
>211
BAD
>5
GOOD>223
<=223
GOOD
> 116
depth
<=116
320/37 79/34
425/31
275/38
62/8
Fig. 4. Part of the decision tree for estimating link quality, computed by MetricMap.
LQI is an indicator of the strength and quality of a received packet, introduced in the 802.15.4
standard and provided by the CC2420 radios of the MicaZ nodes in MistLab. Measurement
studies with LQI have shown it is a reliable metric when estimating link quality. However,
LQI is available only after sending the packet. It is not available for estimating the future
quality of some link before any packets are sent.
The training set, consisting of labeled link samples, was used to compute offline a decision
tree, which classifies the links as good or bad, based on the features from Table 1. The output
of the decision tree learner is presented in Figure 4 (a), together with classification results from
the training phase in the format: (total samples in category / false positive classifications).
The authors used the Weka workbench (Witten & Frank, 2005), which contains many different
implementations of machine learning techniques, including the C4.5 algorithm for decision
tree learning (see Section 2.1).
The acquired rules are used to instrument the original implementation of MintRoute. In a
comparative experimental evaluation on a testbed the authors showed that MetricMap out-
performs MintRoute significantly in terms of delivery rate and fairness, see Figure 4 (b) and
(c). MetricMap also does not incur any additional processing overhead, since the evaluation
of the decision tree is straightforward.
3.2 Discussion of MetricMap
The authors of MetricMap have clearly shown that supervised learning approaches are easy
to implement and use in a wireless sensor network environment and significantly improve
the routing performance of a real system. Similar approaches can be applied to other testbeds
and real deployments. The only requirement is that the general communication properties of
the network do not change over time. This could be particularly challenging in outdoor envi-
ronments, where weather, temperature, sunlight, etc., influence the wireless communications.
Detailed and long-running experiments under changing climate conditions are necessary to
demonstrate the applicability of MetricMap-like routing optimizations. However, the expec-
tation is that the offline learning procedure needs to be re-run in order to adapt to the changing
environment, which could be very costly. In case this hypothesis proves to be true, distributed
methods for automatic link quality estimation need to be developed. On the other hand, im-
plementing decision tree or rule-based learning on sensor nodes seems to be practical, since
these techniques do not have high memory or processing requirements.
4. Routing Layer
The routing challenge refers to the general problem of transferring a data packet from one node
in the network to another one, where direct communication between the nodes is impossible.
The problem is also known as multi-hop routing, referring to the fact that typically multiple
intermediate nodes are used to relay the data packet to its destination. A routing protocol
identifies the sequence of intermediate nodes to ensure delivery of the packet. A differentia-
tion between unicast and multicast routing protocols exists in which unicast protocols route
the data packet from a single source to a single destination, while multicast routing protocols
route the data packet to multiple destinations simultaneously.
There is a huge body of research on routing for WSNs and in general for wireless ad hoc
networks. The main challenges are managing unreliable communication links, node fail-
ures and node mobility, and, most importantly, using energy efficiently. Well-known uni-
cast routing paradigms for WSNs are for example Directed Diffusion (Silva et al., 2003) and
MintRoute (Woo et al., 2003), which select shortest paths based on hop counts, latency and link
reliability. Geographic routing protocols such as GPSR (Karp & Kung, 2000) use geographic
progress to the destination as a cost metric to greedily select the next hop.
Next we present an effort to achieve good routing performance and long network lifetimes
with Q-Learning, a reinforcement learning algorithm presented in Section 2.3. It uses a
latency-based cost metric to minimize delay to the destination and is one of the fundamental
works on applying machine learning to communication problems.
4.1 Q-Routing: Applying Q-Learning to Packet Routing
Q-Routing (Boyan & Littman, 1994) is one of the first applications of Q-Learning, as outlined
in Section 2.3 and (Watkins, 1989), to communications in dynamically changing networks.
Originally it was developed for wired packet-switched networks, but it is also easily adaptable
to the wireless domain.
The learning agents are the nodes in the network, which learn independently from one an-
other the minimum-delay route to the sink. At each node, the available actions are the node’s
neighbors. A value Q
x,t
(d, y) is associated with each neighbor, reflecting the delay estimate d
at time t of node x to reach the sink through neighbor y. The update rule for the Q-Values is:
Q
x, t+1
(d, y) = Q
x, t
(d, y) + γ
(
q + s + R − Q
x, t
(d, y)
)
(3)
where γ is the learning rate, fixed to 0.5 in the original Q-Routing paper (Boyan & Littman,
1994), q is the time the last packet spent in the queue of the node, s is the transmission time to
reach neighbor y and R is the reward received from neighbor y, calculated as: