Wireless Sensor Networks Part 14 potx
Bạn đang xem bản rút gọn của tài liệu. Xem và tải ngay bản đầy đủ của tài liệu tại đây (1.59 MB, 25 trang )
Wireless Sensor Networks 318
(b) Field 2
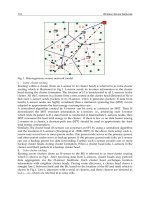
Fig. 12. Two simulation scenarios by using sensor node arrays with different distances.
6. Conclusions
A wireless network physiological signal and field signal monitoring systems in homecare
technology and precision agriculture were proposed in this chapter. We have finished
monitoring physiological signals such as heart rate, ECG, and body temperature as well as
temperature and moisture in air and soil, CO
2
, and illumination signals in the field. We used
Bluetooth technique to solve wireless transmission problem and to finish physiological
signals transceiver between mobile unit and Web server that might be useful in replacing
cables of physiological signal monitoring system. Additionally, we also used ZigBee
technique to finish field signals transceiver between acquiring unit and Web server that
might be useful for field signal monitoring. Most of healthcare-monitoring and
field-monitoring systems applications use mobile device and PC as main monitoring device
in their system. We used an SOC platform as the Web server that can effectively to reduce
cost and the physical size significantly. Because of the popularization of the internet that
displays the physiological and field signal values on the Web page in real-time through
RJ-45 of SP3 platform, the doctors or patient’s family can easily take care of the patient’s
health status while the researchers or farmers can easily look out of the product’s status in
the precision agriculture anytime and any place through the Web page. Additionally, we
also embedded the faulty sensor detection algorithm into sensor nodes on the two
simulation fields and obtain feasible faulty sensor detection accuracy.
Although the fault detection algorithm can be implemented in the wireless sensor networks
on the field to detect the faulty sensor nodes, we are still persecuted by the power supply
with batteries for the sensor nodes. Low power consumption is one of the advantages of the
Zigbee networks, but we must change batteries when the power were exhausted. Owing to
the sunlight being sufficient on the field, the solar cell will be used to support the power for
sensor nodes in the future.
72 m
18 m
16 m
8m
16 m
8m
16 m
16 m
7. Reference
P. Varady, Z. Benyo, and B. Benyo, “An open architecture patient monitoring system using
standard technologies,” IEEE Trans. Inf. Technol. Biomed., vol. 6, no. 1, pp. 95–98,
Mar. 2002.
J. Bai et al., “The design and preliminary evaluation of a home electrocardiography and
blood pressure monitoring network,” J. Telmed. Telecare, vol. 2, no. 2, pp. 100-06,
1996.
G. Williams, P. J. King, A. M. Capper, and K. Doughty, “The electronic doctor (TED)—A
home telecare system,” in Proc. 18th IEEE Annu. EMBS Int. Conf., Amsterdam, The
Netherlands, Oct. 31-ov. 3, 1996, vol. 1, pp. 53-4.
P. Johnson and D. C. Andrews, “Remote continuous physiological monitoring in the home,”
J. Telmed. Telecare, vol. 2, no. 2, pp. 107-13, 1996.
K. Doughty, K. Cameron, and P. Garner, “Three generations of telecare of elderly,” J. Telmed.
Telecare, vol. 2, no. 2, pp. 71-0, 1996.
M. J. Rodriguez, M. T. Arredondo, F. del Pozo, E. J. Gomez, A. Martinez, and A. Dopico, “A
home telecare management system,” J. Telmed. Telecare, vol. 1, no. 2, pp. 86-4,
1995.
M. Rezazadeh and N. E. Evans, “Multichannel physiological monitor plus simultaneous
full-duplex speech channel using a dial-up telephone line,” IEEE Transactions on
Biomedical Engineering, vol. 37, pp.:428 -32, 1990.
C. H. Ko, H. L. Chen, C. C. Kuo, G. Y. Yang, C. W. Yeh, B. C. Tsai, Y. T. Chiou, C. H. Chu,
“Multi-sensor wireless physiological monitor module,” Proceedings of 56th Conf. of
Electronic Components and Technology, pp. 673-676, May 2006.
E. Jovanov, D. Raskovic, A. O. Lords, P. Cox, R. Adharni, and F. Andrasik, “Synchronized
physiological monitoring using a distributed wireless intelligent sensor system,”
The 25th Int. Conf. on IEEE Engineering in Medicine and Biology Society, vol. 2,
pp.1368-1371, Sept. 2003.
I. Pavlidis, “Continuous physiological monitoring,” The 25th Int. Conf. on IEEE Engineering
in Medicine and Biology Society, vol. 2, pp.1084-1087, Sept. 2003.
C. Baber, A. Schwirtz, J, Knight, H. Bristow, T. N. Arvanitis and F. Psomadellis,
“Sensvest-on-body physiological monitoring system,” IEE Eurowearable, pp. 93-98,
Stevenage, Sept. 2003.
S N. Yu and J C. Cheng, “A wireless physiological signal monitoring system with
integrated bluetooth and WiFi technologies,” The 27th Int. Conf. on IEEE
Engineering in Medicine and Biology Society, vol. 2, pp.2203-2206, Shanghai,
China, Sept. 2005.
S. P. Nelwan, T. B. van Dam, P. Klootwijk, and S. H. Meij, “Ubiquitous mobiles access to
real-time patient monitoring data,” Comput. Cardiology, Rotterdam, the
Netherlands, pp 557-560, September 2002.
Y H. Lin, I-C. Jan, P. C I. Ko, Y Y. Chen, J M. Wong, and G J. Jan, “A wireless pda-based
physiological monitoring system for patient transport,” IEEE Trans. Biomed. Eng.,
pp 439-447, 2004.
B S. Lin, N K. Chou, F C. Chong, S J. Chen, “RTWPMS: A real-time wireless
physiological monitoring system,” IEEE Transactions on Information Technology in
Biomedicine, vol. 10, pp. 647-656, 2006.
Wireless Sensor Networks and Their Applications to the Healthcare and Precision Agriculture 319
(b) Field 2
Fig. 12. Two simulation scenarios by using sensor node arrays with different distances.
6. Conclusions
A wireless network physiological signal and field signal monitoring systems in homecare
technology and precision agriculture were proposed in this chapter. We have finished
monitoring physiological signals such as heart rate, ECG, and body temperature as well as
temperature and moisture in air and soil, CO
2
, and illumination signals in the field. We used
Bluetooth technique to solve wireless transmission problem and to finish physiological
signals transceiver between mobile unit and Web server that might be useful in replacing
cables of physiological signal monitoring system. Additionally, we also used ZigBee
technique to finish field signals transceiver between acquiring unit and Web server that
might be useful for field signal monitoring. Most of healthcare-monitoring and
field-monitoring systems applications use mobile device and PC as main monitoring device
in their system. We used an SOC platform as the Web server that can effectively to reduce
cost and the physical size significantly. Because of the popularization of the internet that
displays the physiological and field signal values on the Web page in real-time through
RJ-45 of SP3 platform, the doctors or patient’s family can easily take care of the patient’s
health status while the researchers or farmers can easily look out of the product’s status in
the precision agriculture anytime and any place through the Web page. Additionally, we
also embedded the faulty sensor detection algorithm into sensor nodes on the two
simulation fields and obtain feasible faulty sensor detection accuracy.
Although the fault detection algorithm can be implemented in the wireless sensor networks
on the field to detect the faulty sensor nodes, we are still persecuted by the power supply
with batteries for the sensor nodes. Low power consumption is one of the advantages of the
Zigbee networks, but we must change batteries when the power were exhausted. Owing to
the sunlight being sufficient on the field, the solar cell will be used to support the power for
sensor nodes in the future.
72 m
18 m
16 m
8m
16 m
8m
16 m
16 m
7. Reference
P. Varady, Z. Benyo, and B. Benyo, “An open architecture patient monitoring system using
standard technologies,” IEEE Trans. Inf. Technol. Biomed., vol. 6, no. 1, pp. 95–98,
Mar. 2002.
J. Bai et al., “The design and preliminary evaluation of a home electrocardiography and
blood pressure monitoring network,” J. Telmed. Telecare, vol. 2, no. 2, pp. 100-06,
1996.
G. Williams, P. J. King, A. M. Capper, and K. Doughty, “The electronic doctor (TED)—A
home telecare system,” in Proc. 18th IEEE Annu. EMBS Int. Conf., Amsterdam, The
Netherlands, Oct. 31-ov. 3, 1996, vol. 1, pp. 53-4.
P. Johnson and D. C. Andrews, “Remote continuous physiological monitoring in the home,”
J. Telmed. Telecare, vol. 2, no. 2, pp. 107-13, 1996.
K. Doughty, K. Cameron, and P. Garner, “Three generations of telecare of elderly,” J. Telmed.
Telecare, vol. 2, no. 2, pp. 71-0, 1996.
M. J. Rodriguez, M. T. Arredondo, F. del Pozo, E. J. Gomez, A. Martinez, and A. Dopico, “A
home telecare management system,” J. Telmed. Telecare, vol. 1, no. 2, pp. 86-4,
1995.
M. Rezazadeh and N. E. Evans, “Multichannel physiological monitor plus simultaneous
full-duplex speech channel using a dial-up telephone line,” IEEE Transactions on
Biomedical Engineering, vol. 37, pp.:428 -32, 1990.
C. H. Ko, H. L. Chen, C. C. Kuo, G. Y. Yang, C. W. Yeh, B. C. Tsai, Y. T. Chiou, C. H. Chu,
“Multi-sensor wireless physiological monitor module,” Proceedings of 56th Conf. of
Electronic Components and Technology, pp. 673-676, May 2006.
E. Jovanov, D. Raskovic, A. O. Lords, P. Cox, R. Adharni, and F. Andrasik, “Synchronized
physiological monitoring using a distributed wireless intelligent sensor system,”
The 25th Int. Conf. on IEEE Engineering in Medicine and Biology Society, vol. 2,
pp.1368-1371, Sept. 2003.
I. Pavlidis, “Continuous physiological monitoring,” The 25th Int. Conf. on IEEE Engineering
in Medicine and Biology Society, vol. 2, pp.1084-1087, Sept. 2003.
C. Baber, A. Schwirtz, J, Knight, H. Bristow, T. N. Arvanitis and F. Psomadellis,
“Sensvest-on-body physiological monitoring system,” IEE Eurowearable, pp. 93-98,
Stevenage, Sept. 2003.
S N. Yu and J C. Cheng, “A wireless physiological signal monitoring system with
integrated bluetooth and WiFi technologies,” The 27th Int. Conf. on IEEE
Engineering in Medicine and Biology Society, vol. 2, pp.2203-2206, Shanghai,
China, Sept. 2005.
S. P. Nelwan, T. B. van Dam, P. Klootwijk, and S. H. Meij, “Ubiquitous mobiles access to
real-time patient monitoring data,” Comput. Cardiology, Rotterdam, the
Netherlands, pp 557-560, September 2002.
Y H. Lin, I-C. Jan, P. C I. Ko, Y Y. Chen, J M. Wong, and G J. Jan, “A wireless pda-based
physiological monitoring system for patient transport,” IEEE Trans. Biomed. Eng.,
pp 439-447, 2004.
B S. Lin, N K. Chou, F C. Chong, S J. Chen, “RTWPMS: A real-time wireless
physiological monitoring system,” IEEE Transactions on Information Technology in
Biomedicine, vol. 10, pp. 647-656, 2006.
Wireless Sensor Networks 320
Ting-Chen Ke Kuo-Yu Yang, “A wireless patch-type physiological monitoring microsystem,”
IEEE Sensors, EXCO, Daegu, Korea, October 22-25, pp. 1143-1146, 2006.
N. Zhang M. Wang, and N. Wang; Precision Agriculture – a Worldwide Overview;
Computers and Electronics in Agriculture, vol. 36, pp. 113-132, 2002.
C. T. Leon et al.; Utility of Remote Sensing in Predicting Crop and Soil Characteristics;
Precision Agriculture, Kluwer Academic Publishers, vol. 4, pp. 359-384, 2003.
V. I. Adamchuk “On-the-go Soil Sensors for Precision Agriculture,” Computers and
Electronics in Agriculture, vol. 44, pp. 71-91, 2004.
R. Beckwith “Report from the Field: Results from an Agricultural Wireless Sensor Network,”
Proceedings of the 29
th
Annual IEEE International Conference on Local Computer
Networks (LCN’04), pp. 471-478, 2004.
Xilinx International Co., XILINX SPARTAN-3, silicon_
solutions /fpgas/spartan_series/spartan3_fpgas/index.htm.
C.M.J Alves-Serodio, J. L. Monteiro, and C.A.C. Couto, “An integrated network for
agricultural management applications,” IEEE International Symposium on Industrial
Electronics, Pretoria, South Africa, pp. 679.683, 1998.
T. Fukatsu and M. Hirafuji, “Field monitoring using sensor-nodes with a web server,” J. of
Robotics and Mechatronics, vol. 17, no. 2, pp. 164-172, 2005.
K. Langendoen, A. Baggio, and O.Visser,”Murphy loves potatoes: experiences from a pilot
sensor network deployment in precision agriculture,” The 20th Int. Parallel and
Distributed Processing Symposium, pp. 25-29, April 2006.
N. Wang, N. Zhang, M. Wang, “Wireless sensors in agriculture and food industry—recent
development and future perspective,” Comp. Electron. Agric. vol. 50, no. 1, pp.
1-14 2006.
T. Fukatsu and M. Hirafuji, “Field monitoring using sensor-nodes with a web server,” J. of
Robotics and Mechatronics, vol. 17, no. 2, pp. 164-172, 2005.
Sunnorth, SPCE061A compiler user menu v1.0, www.sunnorth.com.cn.
Spectrum Technologies Inc., External temperature sensor category #3667,
www.specmeters.com.
Spectrum Technologies Inc., Watermark soil moisture sensor category #6450WD,
www.specmeters.com.
E. P. Eldredge, C. C. Shock, and T. D. Stieber, “Calibration of granular matrix sensors for
irrigation management,” Agronomy Journal, vol. 85, pp.1228-1232, 1993.
S. J. Thomson, T. Youmos, and K. Wood, “Evaluation of calibration equations and
application methods for the Watermark granular matrix soil moisture sensor,”
Appl. Eng. Agric., vol. 12, pp. 99-103, 1996.
Electronique-Diffusion Company Inc., REHS135, www.elecdif.com.
Allguy International Co., Ltd., CDS photoconductive cells, merce.
com.tw/modules.php?modules=company&action=company_inside&ID=
A0001712&s=h.
Ready International Inc., ZigBee 3160 module,
M. Yu, H. Mokhtar, and M. Merabti, “A survey on Management in wireless sensor
networks,” www.cms.livjm.ac.uk/pgnet2007/Proceedings/Papers
/2007-099.pdf.
Sapon Tanachaiwiwat, Pinalkumar Dave, Rohan Bhindwale, Ahmed Helmy, “Secure
locations: routing on trust and isolating compromised sensors in location-aware
sensor networks,” SenSys’03, pp. 324-325, LA, CA, USA, Nov. 5–7, 2003.
S Harte, A Rahman, K M Razeeb, “Fault tolerance in sensor networks using self-diagnosing
sensor Node,” The IEE Int. Workshop on Intelligent Environments, pp. 7-12, 2005.
D. Estrin, R. Govindan, J. S. Heidemann, S. Kumar, “Next century challenges: scalable
coordination in sensor networks,” In Mobile Computing and Networking, pp.
263-270, 1999.
A. T. Tai, K. S. Tso, W. H. Sanders. “Cluster-based failure detection service for large-scale ad
hoc wireless network applications in dependable systems and networks,”
Proceedings of the 2004 Int. Conf. on Dependable Systems and Networks, DSN ' 04.
2004.
T. Clouqueur, K. Saluja, P. Ramanathan, “Fault tolerance in collaborative sensor networks
for target detection,” IEEE Transactions on Computers, vol. 53, pp. 320-333, 2004.
M. Ding, D. Chen, K. Xing, X. Cheng. “Localized fault- tolerant event boundary detection in
sensor networks,” in Proceedings of INFOCOM, 2005.
J. Chen, S. Kher, and A. Somani, “Distributed fault detection of wireless sensor networks,”
DIWANS'06, Los Angeles, USA:ACM Pres, pp. 65-72, 2006.
Wireless Sensor Networks and Their Applications to the Healthcare and Precision Agriculture 321
Ting-Chen Ke Kuo-Yu Yang, “A wireless patch-type physiological monitoring microsystem,”
IEEE Sensors, EXCO, Daegu, Korea, October 22-25, pp. 1143-1146, 2006.
N. Zhang M. Wang, and N. Wang; Precision Agriculture – a Worldwide Overview;
Computers and Electronics in Agriculture, vol. 36, pp. 113-132, 2002.
C. T. Leon et al.; Utility of Remote Sensing in Predicting Crop and Soil Characteristics;
Precision Agriculture, Kluwer Academic Publishers, vol. 4, pp. 359-384, 2003.
V. I. Adamchuk “On-the-go Soil Sensors for Precision Agriculture,” Computers and
Electronics in Agriculture, vol. 44, pp. 71-91, 2004.
R. Beckwith “Report from the Field: Results from an Agricultural Wireless Sensor Network,”
Proceedings of the 29
th
Annual IEEE International Conference on Local Computer
Networks (LCN’04), pp. 471-478, 2004.
Xilinx International Co., XILINX SPARTAN-3, silicon_
solutions /fpgas/spartan_series/spartan3_fpgas/index.htm.
C.M.J Alves-Serodio, J. L. Monteiro, and C.A.C. Couto, “An integrated network for
agricultural management applications,” IEEE International Symposium on Industrial
Electronics, Pretoria, South Africa, pp. 679.683, 1998.
T. Fukatsu and M. Hirafuji, “Field monitoring using sensor-nodes with a web server,” J. of
Robotics and Mechatronics, vol. 17, no. 2, pp. 164-172, 2005.
K. Langendoen, A. Baggio, and O.Visser,”Murphy loves potatoes: experiences from a pilot
sensor network deployment in precision agriculture,” The 20th Int. Parallel and
Distributed Processing Symposium, pp. 25-29, April 2006.
N. Wang, N. Zhang, M. Wang, “Wireless sensors in agriculture and food industry—recent
development and future perspective,” Comp. Electron. Agric. vol. 50, no. 1, pp.
1-14 2006.
T. Fukatsu and M. Hirafuji, “Field monitoring using sensor-nodes with a web server,” J. of
Robotics and Mechatronics, vol. 17, no. 2, pp. 164-172, 2005.
Sunnorth, SPCE061A compiler user menu v1.0, www.sunnorth.com.cn.
Spectrum Technologies Inc., External temperature sensor category #3667,
www.specmeters.com.
Spectrum Technologies Inc., Watermark soil moisture sensor category #6450WD,
www.specmeters.com.
E. P. Eldredge, C. C. Shock, and T. D. Stieber, “Calibration of granular matrix sensors for
irrigation management,” Agronomy Journal, vol. 85, pp.1228-1232, 1993.
S. J. Thomson, T. Youmos, and K. Wood, “Evaluation of calibration equations and
application methods for the Watermark granular matrix soil moisture sensor,”
Appl. Eng. Agric., vol. 12, pp. 99-103, 1996.
Electronique-Diffusion Company Inc., REHS135, www.elecdif.com.
Allguy International Co., Ltd., CDS photoconductive cells, merce.
com.tw/modules.php?modules=company&action=company_inside&ID=
A0001712&s=h.
Ready International Inc., ZigBee 3160 module,
M. Yu, H. Mokhtar, and M. Merabti, “A survey on Management in wireless sensor
networks,” www.cms.livjm.ac.uk/pgnet2007/Proceedings/Papers
/2007-099.pdf.
Sapon Tanachaiwiwat, Pinalkumar Dave, Rohan Bhindwale, Ahmed Helmy, “Secure
locations: routing on trust and isolating compromised sensors in location-aware
sensor networks,” SenSys’03, pp. 324-325, LA, CA, USA, Nov. 5–7, 2003.
S Harte, A Rahman, K M Razeeb, “Fault tolerance in sensor networks using self-diagnosing
sensor Node,” The IEE Int. Workshop on Intelligent Environments, pp. 7-12, 2005.
D. Estrin, R. Govindan, J. S. Heidemann, S. Kumar, “Next century challenges: scalable
coordination in sensor networks,” In Mobile Computing and Networking, pp.
263-270, 1999.
A. T. Tai, K. S. Tso, W. H. Sanders. “Cluster-based failure detection service for large-scale ad
hoc wireless network applications in dependable systems and networks,”
Proceedings of the 2004 Int. Conf. on Dependable Systems and Networks, DSN ' 04.
2004.
T. Clouqueur, K. Saluja, P. Ramanathan, “Fault tolerance in collaborative sensor networks
for target detection,” IEEE Transactions on Computers, vol. 53, pp. 320-333, 2004.
M. Ding, D. Chen, K. Xing, X. Cheng. “Localized fault- tolerant event boundary detection in
sensor networks,” in Proceedings of INFOCOM, 2005.
J. Chen, S. Kher, and A. Somani, “Distributed fault detection of wireless sensor networks,”
DIWANS'06, Los Angeles, USA:ACM Pres, pp. 65-72, 2006.
On the Design and Analysis of Transport Protocols over Wireless Sensor Networks 323
On the Design and Analysis of Transport Protocols over Wireless Sensor
Networks
Suman Kumar and Seung-Jong Park
x
On the Design and Analysis of Transport
Protocols over Wireless Sensor Networks
Suman Kumar and Seung-Jong Park
Computer Science Department and Centre for Computation and Technology
Louisiana State University
USA
1. Introduction
Sensor networks are typically data driven where the whole network cooperates in
communicating data from source sensors to sinks (typical repository/server). One of the
main characteristics of a typical sensor node is the limited power supply it has (Kahn et al.,
1999). Usually, it is battery operated which might last for some months to a year (depending
on the type of application and other application specifications). Sensing nodes typically
exhibit limited capabilities in terms of processing, communication, and especially, power
(Pottie et al., 2000). Different application would have different constraints and priorities on
how their sensor network must behave. Thus, energy conservation is of prime consideration
in sensor network protocols in order to maximize the network's operational lifetime. Rather
than sending individual data items from sensors to sinks, it is more energy efficient to send
aggregated data. The net effect of this aggregation is, by transmitting less data units,
considerable energy savings can be achieved which is the main idea behind in-network
(Madden et al., 2002) aggregation and further distributed processing of the data.
Since enabling communication between sensors and sinks is the major role of sensor
networks, many research works [Gopalsamy et al., 2002] have investigated energy-aware
data delivery. However, sensor networks experience wireless errors and congestion more
severely than other wireless networks because of the low capability to recover from losses
and the high node-density. Therefore, robustness is also important to energy conservation
since unreliable data delivery, which increases the probability of data retransmission under
high loss rates, results in the consumption of a large amount of energy. Although the
problem has been addressed by previous works [Heinzelman et al., 1999 & Ye et al., 2003] in
the context of wireless ad-hoc networks, such approaches cannot be directly applied to the
sensor environment. Because of the distinctive characteristics of multipoint-to-point
communication vs. point-to-multipoint communication, the data delivery problem in sensor
networks can be seen as consisting of two problems: downstream and upstream data
delivery. Therefore, we address these problems as two separate ones. Firstly, a sink-to-
sensors energy-aware data delivery scheme is proposed to solve the downstream problem
while considering robustness simultaneously. Secondly, a sensors-to-sink energy-aware
data delivery scheme is proposed to address the upstream problem.
16
Wireless Sensor Networks 324
Therefore, in this chapter, first we construct a probability model for existence of such
redundancy among closely related sensor nodes. In the model, we assume sensor nodes are
generated with two associated bi-variate Poisson distribution in a plane. We then propose a
scalable framework for reliable data delivery. The proposed framework addresses and
leverages the characteristics of the wireless sensor networks while achieving the reliability
in an efficient manner. First, for downstream data delivery, we formulated the reliable data
delivery problem theoretically using the minimum set cover problem and transformed it to
the minimum dominating set (MDS) problem. For upstream data delivery, we formulate the
perfectly correlated data aggregation problem using the Steiner minimum tree (SMT). We
propose a decentralized aggregation method by integrating the shortest path tree and the
minimum dominating set to approximate the optimal solution, the SMT. We evaluate the
performance of the proposed approach with other previous schemes and we show that the
proposed scheme performs substantially. With the help of proposed probability model for
redundancy condition, we comment on the design of such schemes.
2. Condition for Data Redundancy between Sensing Nodes
In this section, we introduce a heuristic model for data redundancy in spatially distributed
sensor network to characterize the amount of redundancy existing among near neighbour
nodes. For the general scenario, although in our analysis we introduce two different kind of
sensor nodes (further referred as A and B), it does not affect the general analysis for uniform
sensor node scenario. However, it may lead to useful result considering that there are at
least two kinds of sensor nodes that differ in some sense1 and still lead to a simplified
analysis. We consider that whatever differences sensors have, they are distributed with the
same master Poisson process. We recognise that the near neighbour distribution is the main
factor contributing to the overlap of sensing regions among nodes that introduces data
redundancy among sensor nodes. We give a probabilistic expression giving near node
distribution and argue that for a given sensing range how many sensors can deliver partially
redundant data.
2.1 System Model
Continuing our two node scenario and assuming data is uniformly distributed throughout
the spatial region, the data collected by some node
in its sensing region
is proportional
to the sensing area.
Hence, data sensed in area
Where, is some proportionality
constant that depends on sensing ability of sensors. Hence, for sensing nodes A and B, the
correlation factor is given by,
(1)
Assuming uniform node configuration of all the nodes, the sensing radius is r
s
and
transmission range is r
t
. the sensing area is given as
.
For a particular node say s, all the other nodes in area
, shares some degree of redundant
information with s. In figure 1, two nodes A and B has position vectors r and r’ respectively
and r
s
is their sensing range, the condition that these two nodes share redundant
information is given by,
(2)
Fig. 1. Condition for Data Redundancy between two nodes A & B
Hence, to quantify the redundancy for all the neighbours around a sensor node we have to
find out its near neighbour distribution in its own sensing range. Next section presents an
analysis, assuming sensor nodes follows a spatial bi-variate distribution for sensor nodes, A
and B. Here, we consider nodes A and B which are different in terms of sensing rate or some
other figure of merit, say, sensing capability factor or can be totally different sensors.
2.2 Nearest Neighbour Distribution
Maritz (Maritz, 1952) obtained the probability generating function for the bivariate poison
assuming that, in any interval of length dt, the combinations (
) of the two
events A and B, occur with probabilities dt, dt, dt and 1 - (++)dt. Since, this analysis
involves time bivariate distribution, we write the spatial bivariate distribution by following
the same line of analysis by assuming event A represents the
sensor type A and B represents
sensor type B.
The distribution of the distance between two adjacent points, the nearest neighbour
distribution considering marginal distributions are Poisson, we get the following
relationship,
prob(X
BB
(distance from a point B to next nearest point B)<r)=1-
(3)
and similarly for A. The distribution of the distance from a point A to a nearest point B may
be derived as follows:
prob (X
AB
(distance from a point A to nearest point B) > r)
= prob (A single) prob (distance from A to nearest B > r A single) + prob (A double) prob
(distance from A to nearest B > r A double)
=
(4)
Hence, prob (X
AB
< r)=
On the Design and Analysis of Transport Protocols over Wireless Sensor Networks 325
Therefore, in this chapter, first we construct a probability model for existence of such
redundancy among closely related sensor nodes. In the model, we assume sensor nodes are
generated with two associated bi-variate Poisson distribution in a plane. We then propose a
scalable framework for reliable data delivery. The proposed framework addresses and
leverages the characteristics of the wireless sensor networks while achieving the reliability
in an efficient manner. First, for downstream data delivery, we formulated the reliable data
delivery problem theoretically using the minimum set cover problem and transformed it to
the minimum dominating set (MDS) problem. For upstream data delivery, we formulate the
perfectly correlated data aggregation problem using the Steiner minimum tree (SMT). We
propose a decentralized aggregation method by integrating the shortest path tree and the
minimum dominating set to approximate the optimal solution, the SMT. We evaluate the
performance of the proposed approach with other previous schemes and we show that the
proposed scheme performs substantially. With the help of proposed probability model for
redundancy condition, we comment on the design of such schemes.
2. Condition for Data Redundancy between Sensing Nodes
In this section, we introduce a heuristic model for data redundancy in spatially distributed
sensor network to characterize the amount of redundancy existing among near neighbour
nodes. For the general scenario, although in our analysis we introduce two different kind of
sensor nodes (further referred as A and B), it does not affect the general analysis for uniform
sensor node scenario. However, it may lead to useful result considering that there are at
least two kinds of sensor nodes that differ in some sense1 and still lead to a simplified
analysis. We consider that whatever differences sensors have, they are distributed with the
same master Poisson process. We recognise that the near neighbour distribution is the main
factor contributing to the overlap of sensing regions among nodes that introduces data
redundancy among sensor nodes. We give a probabilistic expression giving near node
distribution and argue that for a given sensing range how many sensors can deliver partially
redundant data.
2.1 System Model
Continuing our two node scenario and assuming data is uniformly distributed throughout
the spatial region, the data collected by some node
in its sensing region
is proportional
to the sensing area.
Hence, data sensed in area
Where, is some proportionality
constant that depends on sensing ability of sensors. Hence, for sensing nodes A and B, the
correlation factor is given by,
(1)
Assuming uniform node configuration of all the nodes, the sensing radius is r
s
and
transmission range is r
t
. the sensing area is given as
.
For a particular node say s, all the other nodes in area
, shares some degree of redundant
information with s. In figure 1, two nodes A and B has position vectors r and r’ respectively
and r
s
is their sensing range, the condition that these two nodes share redundant
information is given by,
(2)
Fig. 1. Condition for Data Redundancy between two nodes A & B
Hence, to quantify the redundancy for all the neighbours around a sensor node we have to
find out its near neighbour distribution in its own sensing range. Next section presents an
analysis, assuming sensor nodes follows a spatial bi-variate distribution for sensor nodes, A
and B. Here, we consider nodes A and B which are different in terms of sensing rate or some
other figure of merit, say, sensing capability factor or can be totally different sensors.
2.2 Nearest Neighbour Distribution
Maritz (Maritz, 1952) obtained the probability generating function for the bivariate poison
assuming that, in any interval of length dt, the combinations (
) of the two
events A and B, occur with probabilities dt, dt, dt and 1 - (++)dt. Since, this analysis
involves time bivariate distribution, we write the spatial bivariate distribution by following
the same line of analysis by assuming event A represents the
sensor type A and B represents
sensor type B.
The distribution of the distance between two adjacent points, the nearest neighbour
distribution considering marginal distributions are Poisson, we get the following
relationship,
prob(X
BB
(distance from a point B to next nearest point B)<r)=1-
(3)
and similarly for A. The distribution of the distance from a point A to a nearest point B may
be derived as follows:
prob (X
AB
(distance from a point A to nearest point B) > r)
= prob (A single) prob (distance from A to nearest B > r A single) + prob (A double) prob
(distance from A to nearest B > r A double)
=
(4)
Hence, prob (X
AB
< r)=
Wireless Sensor Networks 326
ͳ െ ݁
ି
ሺ
ఓା௩
ሻ
గ
మ
ሺ
ݒ
ሺ௫ǡሻௗ௫
౮ಭೝ
ା௩
ሻ (5)
When A and B are independent, i.e. when ݒ = 0 , 5 reduces to the distribution of the
distance from a random point to the nearest point B which is the same distribution as given
in equation 3. For the sensing range 2r
s
equation 4 gives the condition for two sensors
sharing redundant data as below:
ͳ െ ݁
ି
ሺ
ఓା௩
ሻ
గ
ೞ
మ
ሺ
ݒ
ሺ௫ǡሻௗ௫
౮ಭమೝ
ೞ
ା௩
ሻ (6)
3. Down Stream Reliable Data Delivery over Sensor Network
In this section, we consider the problem of reliable downstream point-to-multipoint data
delivery, from the sink to the sensors, in wireless sensor networks (WSNs). The need (or lack
thereof) for reliability in a sensor network is clearly dependent upon the specific application
the sensor network is used for. Consider a security application where image sensors are
required to detect and identify the presence of critical targets. Given the critical nature of the
application, it can be argued that any message from the sink has to reach the sensors
reliably. The problem of reliable data delivery in multi-hop wireless networks is by itself not
new, and has been addressed by several existing works in the context of wireless ad-hoc
networks (Tang & Gerla, 2001). However, such approaches do not directly apply to a sensor
environment because of three unique challenges imposed by the following considerations:
The issue of reliability is addressed in following context:
Downstream Reliability: We restrict the scope of this work to downstream reliability.
Communication and Node failures: A scheme that addresses reliability in a sensor network
environment, has to deal with communication failures and node failures. The proposed
algorithm will handle both communication and node failures.
Message size: We assume that the message size to be sent by the sink consists of one or more
packets.
Metrics: We consider latency and energy consumption as the metrics of interest for
comparison with other existing approaches. The goals is to minimize these metrics.
Network Model: We assume that both the sink and the sensors in the network remain static.
We also assume that there is exactly one sink coordinating the sensors in the field. Further,
since sensor networks have a large number of sensor nodes, the proposed approach must be
scalable to the number of nodes in the network.
3.1 Design Choices and Challenges
We have following basic design choices:
1. A NACK based loss recovery scheme is preferable to an ACK based scheme as the latter
suffers from the ACK implosion problem.
2. Local and dynamically assigned designated servers are essential to minimize the
retransmission data overhead.
3. Out-of-sequence forwarding should be preferred to maximize the spatial reuse in the
network.
We outline following challenges that need to be addressed to provide effective downstream
data delivery:
1. Environment Constraints: It is evident that sensor network have two main constraints.
First, Bandwidth and energy constraint and second frequent node failure problem.
2. ACK/NACK Paradox: This challenge stems out from the constraints imposed by typical
message types that can be expected to use the downstream reliability. While the query-data
and control code can be expected to be of non-trivial message size, queries pose a unique
problem because of their short message sizes. While an ACK based recovery scheme would
address the problems, its other deficiencies (in terms of ACK implosion) however clearly
prohibit it from being used. Whereas, NACKs cannot handle the unique case of all packets
in a message being lost at a particular node in the network. Since the node is not aware that
a message is expected, it cannot possibly advertise a NACK to request retransmissions.
NACK based scheme require in-sequence forwarding of data by nodes in the network to
prevent a NACK implosion (Wan et al., 2002). This will clearly limit the spatial re-use
achieved in the network.
3.2 Ideal Solution: Minimum Set Cover Problem
To solve the reliability problem at wireless sensor networks, it is necessary to formulate the
problem into an optimization problem which has been known as a common and typical
problem and investigated for optimal solutions. Assuming that the lost packet can be
retransmitted and recovered by one of neighbours which received the lost packet before, a
solution tries to designate a set of nodes, called recovery servers, which retransmit the lost
packet in an optimal fashion. We will call this problem as loss recovery server designation
problem. By the nature of local broadcasting of wireless communication, one recovery
server can recover the lost packet of all neighbours around it. Therefore, it is optimal to
minimize a size of the set of recovery servers covering all nodes which did not receive the
packet. And it is necessary to find the optimal recovery sets for different loss patterns of
each packet. The above loss recovery server designation problem can be defined as a set
cover problem in the graph theory, the problem of covering a base set (nodes which did
received a packet successfully) with as few elements of a given subset system (a set of
recovery servers) as possible. However, Karp (Karp, 1972) showed that the decision version
of the minimum set cover (MSC) is NP-complete. A common approach of coping with NP-
hard problems is approximation algorithms that run in polynomial time and deliver
solutions that are close to the optimal solution.
Therefore, we address the loss recovery server designation problem with an alternative
which has similar complexity and advantages to solve the problem in decentralized fashion.
In a graph, a dominating set is a subset of nodes such that for every node v in a graph, either
a) v is in the dominating set or b) a direct neighbour of v is in the dominating set. The
minimum dominating set problem asks for a dominating set of minimum size. The reason to
choose MDS is considering the fact that MSC is equivalent to the MDS problem under L-
reduction closely related to each other and have been shown to be NP-hard (Garey &
Johnson, 1979). Although the MDS problem has different instances reduced from different
instances of MSC problem, an instance for MDS problem can include a whole network by
covering a set of nodes and edges which are not adjacent to a given set S. Therefore, we can
handle the MDS problem without concerning the loss pattern S although there are trade-
offs: the advantage of MDS is that we can solve MDS problem without considering different
On the Design and Analysis of Transport Protocols over Wireless Sensor Networks 327
ͳ െ ݁
ି
ሺ
ఓା௩
ሻ
గ
మ
ሺ
ݒ
ሺ௫ǡሻௗ௫
౮ಭೝ
ା௩
ሻ (5)
When A and B are independent, i.e. when ݒ = 0 , 5 reduces to the distribution of the
distance from a random point to the nearest point B which is the same distribution as given
in equation 3. For the sensing range 2r
s
equation 4 gives the condition for two sensors
sharing redundant data as below:
ͳ െ ݁
ି
ሺ
ఓା௩
ሻ
గ
ೞ
మ
ሺ
ݒ
ሺ௫ǡሻௗ௫
౮ಭమೝ
ೞ
ା௩
ሻ (6)
3. Down Stream Reliable Data Delivery over Sensor Network
In this section, we consider the problem of reliable downstream point-to-multipoint data
delivery, from the sink to the sensors, in wireless sensor networks (WSNs). The need (or lack
thereof) for reliability in a sensor network is clearly dependent upon the specific application
the sensor network is used for. Consider a security application where image sensors are
required to detect and identify the presence of critical targets. Given the critical nature of the
application, it can be argued that any message from the sink has to reach the sensors
reliably. The problem of reliable data delivery in multi-hop wireless networks is by itself not
new, and has been addressed by several existing works in the context of wireless ad-hoc
networks (Tang & Gerla, 2001). However, such approaches do not directly apply to a sensor
environment because of three unique challenges imposed by the following considerations:
The issue of reliability is addressed in following context:
Downstream Reliability: We restrict the scope of this work to downstream reliability.
Communication and Node failures: A scheme that addresses reliability in a sensor network
environment, has to deal with communication failures and node failures. The proposed
algorithm will handle both communication and node failures.
Message size: We assume that the message size to be sent by the sink consists of one or more
packets.
Metrics: We consider latency and energy consumption as the metrics of interest for
comparison with other existing approaches. The goals is to minimize these metrics.
Network Model: We assume that both the sink and the sensors in the network remain static.
We also assume that there is exactly one sink coordinating the sensors in the field. Further,
since sensor networks have a large number of sensor nodes, the proposed approach must be
scalable to the number of nodes in the network.
3.1 Design Choices and Challenges
We have following basic design choices:
1. A NACK based loss recovery scheme is preferable to an ACK based scheme as the latter
suffers from the ACK implosion problem.
2. Local and dynamically assigned designated servers are essential to minimize the
retransmission data overhead.
3. Out-of-sequence forwarding should be preferred to maximize the spatial reuse in the
network.
We outline following challenges that need to be addressed to provide effective downstream
data delivery:
1. Environment Constraints: It is evident that sensor network have two main constraints.
First, Bandwidth and energy constraint and second frequent node failure problem.
2. ACK/NACK Paradox: This challenge stems out from the constraints imposed by typical
message types that can be expected to use the downstream reliability. While the query-data
and control code can be expected to be of non-trivial message size, queries pose a unique
problem because of their short message sizes. While an ACK based recovery scheme would
address the problems, its other deficiencies (in terms of ACK implosion) however clearly
prohibit it from being used. Whereas, NACKs cannot handle the unique case of all packets
in a message being lost at a particular node in the network. Since the node is not aware that
a message is expected, it cannot possibly advertise a NACK to request retransmissions.
NACK based scheme require in-sequence forwarding of data by nodes in the network to
prevent a NACK implosion (Wan et al., 2002). This will clearly limit the spatial re-use
achieved in the network.
3.2 Ideal Solution: Minimum Set Cover Problem
To solve the reliability problem at wireless sensor networks, it is necessary to formulate the
problem into an optimization problem which has been known as a common and typical
problem and investigated for optimal solutions. Assuming that the lost packet can be
retransmitted and recovered by one of neighbours which received the lost packet before, a
solution tries to designate a set of nodes, called recovery servers, which retransmit the lost
packet in an optimal fashion. We will call this problem as loss recovery server designation
problem. By the nature of local broadcasting of wireless communication, one recovery
server can recover the lost packet of all neighbours around it. Therefore, it is optimal to
minimize a size of the set of recovery servers covering all nodes which did not receive the
packet. And it is necessary to find the optimal recovery sets for different loss patterns of
each packet. The above loss recovery server designation problem can be defined as a set
cover problem in the graph theory, the problem of covering a base set (nodes which did
received a packet successfully) with as few elements of a given subset system (a set of
recovery servers) as possible. However, Karp (Karp, 1972) showed that the decision version
of the minimum set cover (MSC) is NP-complete. A common approach of coping with NP-
hard problems is approximation algorithms that run in polynomial time and deliver
solutions that are close to the optimal solution.
Therefore, we address the loss recovery server designation problem with an alternative
which has similar complexity and advantages to solve the problem in decentralized fashion.
In a graph, a dominating set is a subset of nodes such that for every node v in a graph, either
a) v is in the dominating set or b) a direct neighbour of v is in the dominating set. The
minimum dominating set problem asks for a dominating set of minimum size. The reason to
choose MDS is considering the fact that MSC is equivalent to the MDS problem under L-
reduction closely related to each other and have been shown to be NP-hard (Garey &
Johnson, 1979). Although the MDS problem has different instances reduced from different
instances of MSC problem, an instance for MDS problem can include a whole network by
covering a set of nodes and edges which are not adjacent to a given set S. Therefore, we can
handle the MDS problem without concerning the loss pattern S although there are trade-
offs: the advantage of MDS is that we can solve MDS problem without considering different
Wireless Sensor Networks 328
instances for different loss patterns; and the disadvantage of MDS is that the cost of optimal
solution for an instance of MDS is larger than that of optimal solution for an instance of
MSC for given loss pattern S. we can use the approximated solution of MDS to solve the
MSC which is the optimal solution of the loss recovery server designation problem
3.3 A Framework for Down Stream Data Delivery Scheme
The centerpiece of proposed design is an instantaneously constructible loss recovery
infrastructure called the core. The core is an approximation of the minimum dominating
set (MDS) of the network sub-graph to which reliable message delivery is desired. While
using the notion of a MDS to solve networking problems is not new (Sivakumar et al., 1999),
the contributions of this work lie in establishing the following for the specific target
environment: the relative optimality of the core for the loss recovery process, how the core is
constructed, how the core is used for the loss recovery, and how the core is made to scalably
support multiple reliable semantics.
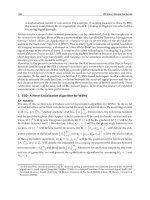
3.3.1 Core Construction
We assume that the first packet is reliably delivered for the initial discussions. The core
forms the set of local designated loss recovery servers that help in the loss recovery process.
The core is constructed using the first packet delivery. The reliable delivery of the first
packet determines the hop count of the node in the network, which is the distance of the
node from the sink. A node, which has a hop count that is a multiple of three, elects itself as
a core if it has not heard from any other core node. In this fashion, the core selection
procedure approximates the MDS structure in a distributed fashion (Figure 3). The
uniqueness of the core design in this approach lies in the following characteristics: (i) the
core is constructed using a single packet flood, more specifically during the flood of the first
packet; and (ii) the structure of the sensor network topology (with sensors placed at fixed
distances from the sink) is leveraged for more efficient, and fair core construction.
Fig. 3. Core Construction as an approximation of MDS
The core construction uses following algorithm:
Sink: When the sink sends the first packet, it stamps the packet with a “band-id” (bId) of 0.
When a sensor receives the first packet successfully, it increments its bId by one, and sets the
resulting value as its own band-id. The band-id is representative of the approximate number
of hops from the sink to the sensor.
Nodes in 3i bands: Only sensors with band-ids of the form 3i, where i is a positive integer, are
allowed to elect themselves as core nodes. When a sensor S
0
with a band-id of the form 3i
forwards the packet (after a random waiting delay from the time it received the packet), it
chooses itself as a core node if it had not heard from
any other core node in the same band.
Once a node chooses itself as a core node, all packet transmissions (including the first) carry
information indicating the same. If any node in the core band that has not selected itself to
be a core receives a core solicitation message explicitly, it chooses itself as a core node at that
stage. Every core node S
3
in the 3(i+1) band should also know of at least one core in the 3i
band. If it receives the first packet through a core in the 3i band, it can determine this
information implicitly as every packet carries the previously visited core node's identifier,
bId, and Amap. However, to tackle a condition where this does not happen, S
3
maintains
information about the node (S
2
) it received the first packet from, and the S
2
node maintains
information from the node (S
1
) it received the first packet from. After a duration equal to the
core election timer, S
3
sends an explicit upstream core solicitation message to S
2
, which in
turn forwards the message to S
1
. Note that by this time, S
1
will already have chosen a core
node, and hence it responds with the relevant information.
Nodes in 3i+1 bands: When a sensor S
1
with a band-id of the form 3i+1 receives the rst packet,
it checks to see if the packet arrived from a core node or from a non-core node. If the source
S
0
was a core node, S
1
sets its core node as S
0
. Otherwise, it sets S
0
as a candidate core node,
and starts a core election timer. If S
1
hears from a core node S
0
before the core election timer
expires, it sets its core node to S
0
. However, if the core election timer expires before hearing
from any other core node, it sets S
0
as its core node, and sends a unicast message to S
0
informing it of the decision.
Nodes in 3i+2 bands: When a sensor S
2
with a band-id of the form 3i+2 receives the first
packet, it cannot (at that point) know of any 3(i+1) sensor. Hence, it forwards the packet
without choosing its core node, but starts its core election timer. If it hears from a core node
in the 3(i+1) band before the timer expires, it chooses the node as its core node. Otherwise, it
arbitrarily picks any of the sensors that it heard from in the 3(i+1) band as its core node and
informs the node of its decision through a unicast message. If it so happens that S2 does not
hear from any of the nodes in the 3(i+1) band (possible, but unlikely), it sends an anycast
core solicitation message with only the target band-id set to 3(i+1). Any node in the 3(i+1)
band that receives the anycast message is allowed to respond after a random waiting delay.
The delay is set to a smaller value for core nodes to facilitate re-use of an already elected
core node. A boundary condition that arises when a sensor with a band-id of 3i+2 is right at
the edge of the network, is handled by making the band act just as a candidate core band
(3i). Such a condition can be detected when nodes in that band do not receive any response
for the anycast core solicitation message. Thus, at the end of the first packet delivery phase,
each node knows its bId, whether it is a core node or not, and in the latter case its core node
information. In addition, every core node in the 3(i+1) band knows of at least one core node
in the 3i band.
On the Design and Analysis of Transport Protocols over Wireless Sensor Networks 329
instances for different loss patterns; and the disadvantage of MDS is that the cost of optimal
solution for an instance of MDS is larger than that of optimal solution for an instance of
MSC for given loss pattern S. we can use the approximated solution of MDS to solve the
MSC which is the optimal solution of the loss recovery server designation problem
3.3 A Framework for Down Stream Data Delivery Scheme
The centerpiece of proposed design is an instantaneously constructible loss recovery
infrastructure called the core. The core is an approximation of the minimum dominating
set (MDS) of the network sub-graph to which reliable message delivery is desired. While
using the notion of a MDS to solve networking problems is not new (Sivakumar et al., 1999),
the contributions of this work lie in establishing the following for the specific target
environment: the relative optimality of the core for the loss recovery process, how the core is
constructed, how the core is used for the loss recovery, and how the core is made to scalably
support multiple reliable semantics.
3.3.1 Core Construction
We assume that the first packet is reliably delivered for the initial discussions. The core
forms the set of local designated loss recovery servers that help in the loss recovery process.
The core is constructed using the first packet delivery. The reliable delivery of the first
packet determines the hop count of the node in the network, which is the distance of the
node from the sink. A node, which has a hop count that is a multiple of three, elects itself as
a core if it has not heard from any other core node. In this fashion, the core selection
procedure approximates the MDS structure in a distributed fashion (Figure 3). The
uniqueness of the core design in this approach lies in the following characteristics: (i) the
core is constructed using a single packet flood, more specifically during the flood of the first
packet; and (ii) the structure of the sensor network topology (with sensors placed at fixed
distances from the sink) is leveraged for more efficient, and fair core construction.
Fig. 3. Core Construction as an approximation of MDS
The core construction uses following algorithm:
Sink: When the sink sends the first packet, it stamps the packet with a “band-id” (bId) of 0.
When a sensor receives the first packet successfully, it increments its bId by one, and sets the
resulting value as its own band-id. The band-id is representative of the approximate number
of hops from the sink to the sensor.
Nodes in 3i bands: Only sensors with band-ids of the form 3i, where i is a positive integer, are
allowed to elect themselves as core nodes. When a sensor S
0
with a band-id of the form 3i
forwards the packet (after a random waiting delay from the time it received the packet), it
chooses itself as a core node if it had not heard from
any other core node in the same band.
Once a node chooses itself as a core node, all packet transmissions (including the first) carry
information indicating the same. If any node in the core band that has not selected itself to
be a core receives a core solicitation message explicitly, it chooses itself as a core node at that
stage. Every core node S
3
in the 3(i+1) band should also know of at least one core in the 3i
band. If it receives the first packet through a core in the 3i band, it can determine this
information implicitly as every packet carries the previously visited core node's identifier,
bId, and Amap. However, to tackle a condition where this does not happen, S
3
maintains
information about the node (S
2
) it received the first packet from, and the S
2
node maintains
information from the node (S
1
) it received the first packet from. After a duration equal to the
core election timer, S
3
sends an explicit upstream core solicitation message to S
2
, which in
turn forwards the message to S
1
. Note that by this time, S
1
will already have chosen a core
node, and hence it responds with the relevant information.
Nodes in 3i+1 bands: When a sensor S
1
with a band-id of the form 3i+1 receives the rst packet,
it checks to see if the packet arrived from a core node or from a non-core node. If the source
S
0
was a core node, S
1
sets its core node as S
0
. Otherwise, it sets S
0
as a candidate core node,
and starts a core election timer. If S
1
hears from a core node S
0
before the core election timer
expires, it sets its core node to S
0
. However, if the core election timer expires before hearing
from any other core node, it sets S
0
as its core node, and sends a unicast message to S
0
informing it of the decision.
Nodes in 3i+2 bands: When a sensor S
2
with a band-id of the form 3i+2 receives the first
packet, it cannot (at that point) know of any 3(i+1) sensor. Hence, it forwards the packet
without choosing its core node, but starts its core election timer. If it hears from a core node
in the 3(i+1) band before the timer expires, it chooses the node as its core node. Otherwise, it
arbitrarily picks any of the sensors that it heard from in the 3(i+1) band as its core node and
informs the node of its decision through a unicast message. If it so happens that S2 does not
hear from any of the nodes in the 3(i+1) band (possible, but unlikely), it sends an anycast
core solicitation message with only the target band-id set to 3(i+1). Any node in the 3(i+1)
band that receives the anycast message is allowed to respond after a random waiting delay.
The delay is set to a smaller value for core nodes to facilitate re-use of an already elected
core node. A boundary condition that arises when a sensor with a band-id of 3i+2 is right at
the edge of the network, is handled by making the band act just as a candidate core band
(3i). Such a condition can be detected when nodes in that band do not receive any response
for the anycast core solicitation message. Thus, at the end of the first packet delivery phase,
each node knows its bId, whether it is a core node or not, and in the latter case its core node
information. In addition, every core node in the 3(i+1) band knows of at least one core node
in the 3i band.
Wireless Sensor Networks 330
Fig. 4. Core Construction
3.3.2 Loss Recovery Process
Once the core is constructed, the framework employs a two-stage recovery process that first
involves the core nodes recovering from all lost packets, and then the recovery of lost
packets at the non-core nodes. The reasons for using two-stage recovery are threefold: (i) the
number of non-core nodes will be a substantial portion of the total number of nodes in the
network, and hence precluding any contention from them is desirable; (ii) when the core
nodes perform retransmissions for other core nodes, holes corresponding to a single packet
among a core node's neighbours would also be filled with a single retransmission; and (iii)
when only the core nodes are performing retransmissions during the second phase, due to
the nature of the core (ideally, no two core nodes are within two hops of each other), the
chances for collisions between retransmissions from different core nodes are minimized. The
recovery process for the core nodes is performed in parallel with the underlying default
message-forwarding (Figure 5). This parallel recovery process for the core nodes does not
increase the contention in the network significantly because the fraction of core nodes is
very small compared to the total number of nodes in the network, and all requests and
retransmissions are performed as unicast transmissions to the nearest upstream core that
has a copy of the lost packet.
Fig. 5. Loss recovery for Core Nodes
The second phase of the loss recovery starts only when a non-core node overhears an A-map
from the core node indicating that the core node has received all the packets in a message.
Hence, the second phase of the loss recovery does not overlap with that of the first phase in
each local area, preventing any contention with the basic flooding mechanism, and with the
first phase recovery. To inhibit unnecessary retransmission requests, proposed scheme uses
a scalable A-map (Availability Map) exchange between core nodes that conveys meta-level
information representing availability of packets with bits set. Any downstream core node
initiates a request for a missing packet only if it receives an A-map from an upstream core
node with the corresponding bit set. The core recovery phase is highly efficient as the core
nodes initiate requests only when they are sure of an upstream core node having a
particular packet.
3.3.3 Role of WFP Pulse Transmission
Reliable single packet delivery is leveraged for the instantaneous core construction. To
achieve that, we use WFP pulse transmission. WFP Pulse can be regarded as a short period
signal which does not include any information, the transmission period of the WFP pulse is
significantly smaller when compared to the transmission time T
D
required for a regular data
packet. Also, twice the regular transmission power is used to transmit the pulses to achieve
relative amplitude of 3dB at the receiver. To increase the robustness of the pulse detection,
every set of pulse transmission includes p pulses transmitted consecutively within a period
T
P
(T
P
<< T
D
). Figure 6 shows the transmission scheme for the WFP pulse. Hence, receivers
infer an incoming WFP signal only after detecting p pulses. As shown in figure, the
WFP
pulse is forced in this design.
Fig. 6. Example for Single or First Packet Delivery
Figure 6 shows the basic procedure of the single or the first packet delivery with a simple
topology. When a sink wants to initiate a reliable single first packet delivery, it sends a set of
forced WFP pulses without sensing the wireless channel. When neighbouring sensors hear
WFP pulses, they send a set of forced WFP pulses immediately. After a deterministic period
that is set based on the diameter of the network, the sink transmits the single first data
packet subject to the medium access scheme, e.g., CSMA. If the node A receives the
single/first packet, it changes its operation from the advertisement mode to the delivery
On the Design and Analysis of Transport Protocols over Wireless Sensor Networks 331
Fig. 4. Core Construction
3.3.2 Loss Recovery Process
Once the core is constructed, the framework employs a two-stage recovery process that first
involves the core nodes recovering from all lost packets, and then the recovery of lost
packets at the non-core nodes. The reasons for using two-stage recovery are threefold: (i) the
number of non-core nodes will be a substantial portion of the total number of nodes in the
network, and hence precluding any contention from them is desirable; (ii) when the core
nodes perform retransmissions for other core nodes, holes corresponding to a single packet
among a core node's neighbours would also be filled with a single retransmission; and (iii)
when only the core nodes are performing retransmissions during the second phase, due to
the nature of the core (ideally, no two core nodes are within two hops of each other), the
chances for collisions between retransmissions from different core nodes are minimized. The
recovery process for the core nodes is performed in parallel with the underlying default
message-forwarding (Figure 5). This parallel recovery process for the core nodes does not
increase the contention in the network significantly because the fraction of core nodes is
very small compared to the total number of nodes in the network, and all requests and
retransmissions are performed as unicast transmissions to the nearest upstream core that
has a copy of the lost packet.
Fig. 5. Loss recovery for Core Nodes
The second phase of the loss recovery starts only when a non-core node overhears an A-map
from the core node indicating that the core node has received all the packets in a message.
Hence, the second phase of the loss recovery does not overlap with that of the first phase in
each local area, preventing any contention with the basic flooding mechanism, and with the
first phase recovery. To inhibit unnecessary retransmission requests, proposed scheme uses
a scalable A-map (Availability Map) exchange between core nodes that conveys meta-level
information representing availability of packets with bits set. Any downstream core node
initiates a request for a missing packet only if it receives an A-map from an upstream core
node with the corresponding bit set. The core recovery phase is highly efficient as the core
nodes initiate requests only when they are sure of an upstream core node having a
particular packet.
3.3.3 Role of WFP Pulse Transmission
Reliable single packet delivery is leveraged for the instantaneous core construction. To
achieve that, we use WFP pulse transmission. WFP Pulse can be regarded as a short period
signal which does not include any information, the transmission period of the WFP pulse is
significantly smaller when compared to the transmission time T
D
required for a regular data
packet. Also, twice the regular transmission power is used to transmit the pulses to achieve
relative amplitude of 3dB at the receiver. To increase the robustness of the pulse detection,
every set of pulse transmission includes p pulses transmitted consecutively within a period
T
P
(T
P
<< T
D
). Figure 6 shows the transmission scheme for the WFP pulse. Hence, receivers
infer an incoming WFP signal only after detecting p pulses. As shown in figure, the
WFP
pulse is forced in this design.
Fig. 6. Example for Single or First Packet Delivery
Figure 6 shows the basic procedure of the single or the first packet delivery with a simple
topology. When a sink wants to initiate a reliable single first packet delivery, it sends a set of
forced WFP pulses without sensing the wireless channel. When neighbouring sensors hear
WFP pulses, they send a set of forced WFP pulses immediately. After a deterministic period
that is set based on the diameter of the network, the sink transmits the single first data
packet subject to the medium access scheme, e.g., CSMA. If the node A receives the
single/first packet, it changes its operation from the advertisement mode to the delivery
Wireless Sensor Networks 332
mode by halting the WFP pulses, and by sending the single/first data packet after carrier-
sensing. However, if the single/first packet is lost, nodes will continue to transmit the WFP
pulses, which in turn trigger retransmissions. Figure 7 shows the case of retransmission.
Since the forced WFP pulses sent every Ts period play the role of a NACK signal, node B
will wait for a duration of at least Ts to send next set of forced WFP pulses. Therefore, the
latency for the single/first packet delivery is directly dependent upon T
s
.
Fig. 7. Loss Recovery using WFP Pulse Transmission
To reduce the latency, it uses another kind of WFP pulse which a node sends after a regular
carrier sensing operation. Node B sends p number of WFP pulses after carrier-sensing
(WFP
cs
) opportunistically (unless it has received the single/first packet) with a period T
c
which is smaller than T
s
. The period T
c
should be proportional to the hop distance of the
node B from the sink because a node should wait until the upstream nodes between the
node and the sink receives the single/first packet. Since a node senses the state of channel
before transmitting WFP
cs
pulses, the WFP
cs
pulses have a lesser probability of colliding
with data packets than WFP pulses. When a node gets to transmit WFP
cs
pulses, it resets the
timer corresponding to the Ts time period for forced WFP pulses.
4. A Framework for Energy Efficient Upstream Data Delivery
In Section 2, probability condition (Equation 6) is derived based on near neighbour
distribution for spatial correlation among data between neighbouring nodes. In this Section,
we consider the problem of data aggregation in environments where the data from the
different sensors are spatially correlated to each other. To do that, we present a simple,
scalable, and distributed approach for approximating the Steiner minimum tree, and
thereby achieve the potential cost benefits introduced earlier. Moreover, we can solve the
upstream data delivery problem without any overhead because the proposed approach uses
the same minimum dominating set structure, the core, which already has been constructed
through the query delivery. To aggregate perfectly correlated data in an energy-efficient
way, we use two structures that have been constructed during downstream data delivery: (i)
the minimum dominating set (MDS) which is same to the core structure proposed in Section
4.6 and (ii) the shortest path tree which is constructed through a basic flooding. The purpose
of the MDS structure is to aggregate correlated data from neighbouring sources; that of SPT
is to gather aggregated data among core nodes in the MDS. The correlation factor depends
on the degree of correlation i.e., the probability of finding a near neighbour node to a
particular node. The probabilistic model is helping to design such an Up-stream data
delivery mechanism however, it is not limited to any particular case of distribution and
hence provides a generalized approach.
Although there have been many previous works in (Hwang et al., 1992) on the
approximation of the SMT, those schemes still require computational and communication
overheads that WSNs cannot support. In this section, we design an aggregation structure
that approximate the optimal solution in a distributed fashion with less amount of overhead
than distributed approximation of the SMT. From the definition of the Steiner minimum tree
(SMT), we need to find an additional set of nodes that are not sources and inserted into the
SMT in order to achieve the shortest connectivity. In graph theory, this set is called “Steiner
points. Therefore, one of the above heuristics also tries to find these Steiner points. However,
since these Steiner points depend on the locations of sources, we need to find the optimal set
of Steiner points after we know the exact locations of sources. Instead of solving the SMT
problem of which optimal solutions are different to each other based on given set of sources,
we address it with the minimum dominating set (MDS) problem of which optimal solution
is not changed irrespective of given set of sources. Assuming perfect correlation among all
data, it is well known that the early aggregation around sources is to reduce redundant data
in tree structures. And, we can utilize the above heuristic using the MDS approach. Each
node in MDS can work as a Steiner point if it has any neighbouring sources around it.
After a query flooding constructs the core structure, data aggregation can use the core to
find the set of Steiner points which aggregate data from neighboring sources. Then the data
at some core nodes can be forwarded to its upstream core locating at inside core band since
the core structure has the shortest path information toward a sink. Eventually, all data from
core nodes will reach a sink through the shortest path that was constructed while a query
was flooded. Although there is a gap between the optimal solution of the Steiner minimum
tree and the approximated solution using the minimum dominating set, the proposed MDS
approach can obtain a promising result compared to other approximations that assume
centralized coordination and high computational complexity.
The following are the key goals that the design of proposed data aggregation strategy is
based on following:
Perfect Correlation: Since our focus is on the aggregation problem, assuming all data from
sensors are perfectly correlated, the amount of aggregated data is equal to the amount of
original data before aggregation.
Efficiency: Since the energy conservation is the critical issue in WSNs, the goal of design is to
minimize the energy consumption at data aggregation. To minimize the energy
consumption, it is better to reduce redundancy among data while data are delivered.
Therefore, the proposed scheme will aggregate correlated data as soon as and as much as
possible to reduce redundancy.
Scalability: In general, WSNs might have more than tens of thousands sensors. The proposed
scheme should be operated efficiently with reasonable amount of overhead linearly
increasing to the scale of WSNs.
Decentralization: Since using global information in a distributed environment such as a
sensor network can incur high overheads, the proposed scheme should use purely local
information in its approach. Then it will be operated in a decentralized fashion over large
scale of WSNs.
Loose Synchronization: To minimize the cost of aggregation, most of theoretical solutions use
tree structures, e.g., the shortest path tree, the minimum spanning tree and the Steiner
On the Design and Analysis of Transport Protocols over Wireless Sensor Networks 333
mode by halting the WFP pulses, and by sending the single/first data packet after carrier-
sensing. However, if the single/first packet is lost, nodes will continue to transmit the WFP
pulses, which in turn trigger retransmissions. Figure 7 shows the case of retransmission.
Since the forced WFP pulses sent every Ts period play the role of a NACK signal, node B
will wait for a duration of at least Ts to send next set of forced WFP pulses. Therefore, the
latency for the single/first packet delivery is directly dependent upon T
s
.
Fig. 7. Loss Recovery using WFP Pulse Transmission
To reduce the latency, it uses another kind of WFP pulse which a node sends after a regular
carrier sensing operation. Node B sends p number of WFP pulses after carrier-sensing
(WFP
cs
) opportunistically (unless it has received the single/first packet) with a period T
c
which is smaller than T
s
. The period T
c
should be proportional to the hop distance of the
node B from the sink because a node should wait until the upstream nodes between the
node and the sink receives the single/first packet. Since a node senses the state of channel
before transmitting WFP
cs
pulses, the WFP
cs
pulses have a lesser probability of colliding
with data packets than WFP pulses. When a node gets to transmit WFP
cs
pulses, it resets the
timer corresponding to the Ts time period for forced WFP pulses.
4. A Framework for Energy Efficient Upstream Data Delivery
In Section 2, probability condition (Equation 6) is derived based on near neighbour
distribution for spatial correlation among data between neighbouring nodes. In this Section,
we consider the problem of data aggregation in environments where the data from the
different sensors are spatially correlated to each other. To do that, we present a simple,
scalable, and distributed approach for approximating the Steiner minimum tree, and
thereby achieve the potential cost benefits introduced earlier. Moreover, we can solve the
upstream data delivery problem without any overhead because the proposed approach uses
the same minimum dominating set structure, the core, which already has been constructed
through the query delivery. To aggregate perfectly correlated data in an energy-efficient
way, we use two structures that have been constructed during downstream data delivery: (i)
the minimum dominating set (MDS) which is same to the core structure proposed in Section
4.6 and (ii) the shortest path tree which is constructed through a basic flooding. The purpose
of the MDS structure is to aggregate correlated data from neighbouring sources; that of SPT
is to gather aggregated data among core nodes in the MDS. The correlation factor depends
on the degree of correlation i.e., the probability of finding a near neighbour node to a
particular node. The probabilistic model is helping to design such an Up-stream data
delivery mechanism however, it is not limited to any particular case of distribution and
hence provides a generalized approach.
Although there have been many previous works in (Hwang et al., 1992) on the
approximation of the SMT, those schemes still require computational and communication
overheads that WSNs cannot support. In this section, we design an aggregation structure
that approximate the optimal solution in a distributed fashion with less amount of overhead
than distributed approximation of the SMT. From the definition of the Steiner minimum tree
(SMT), we need to find an additional set of nodes that are not sources and inserted into the
SMT in order to achieve the shortest connectivity. In graph theory, this set is called “Steiner
points. Therefore, one of the above heuristics also tries to find these Steiner points. However,
since these Steiner points depend on the locations of sources, we need to find the optimal set
of Steiner points after we know the exact locations of sources. Instead of solving the SMT
problem of which optimal solutions are different to each other based on given set of sources,
we address it with the minimum dominating set (MDS) problem of which optimal solution
is not changed irrespective of given set of sources. Assuming perfect correlation among all
data, it is well known that the early aggregation around sources is to reduce redundant data
in tree structures. And, we can utilize the above heuristic using the MDS approach. Each
node in MDS can work as a Steiner point if it has any neighbouring sources around it.
After a query flooding constructs the core structure, data aggregation can use the core to
find the set of Steiner points which aggregate data from neighboring sources. Then the data
at some core nodes can be forwarded to its upstream core locating at inside core band since
the core structure has the shortest path information toward a sink. Eventually, all data from
core nodes will reach a sink through the shortest path that was constructed while a query
was flooded. Although there is a gap between the optimal solution of the Steiner minimum
tree and the approximated solution using the minimum dominating set, the proposed MDS
approach can obtain a promising result compared to other approximations that assume
centralized coordination and high computational complexity.
The following are the key goals that the design of proposed data aggregation strategy is
based on following:
Perfect Correlation: Since our focus is on the aggregation problem, assuming all data from
sensors are perfectly correlated, the amount of aggregated data is equal to the amount of
original data before aggregation.
Efficiency: Since the energy conservation is the critical issue in WSNs, the goal of design is to
minimize the energy consumption at data aggregation. To minimize the energy
consumption, it is better to reduce redundancy among data while data are delivered.
Therefore, the proposed scheme will aggregate correlated data as soon as and as much as
possible to reduce redundancy.
Scalability: In general, WSNs might have more than tens of thousands sensors. The proposed
scheme should be operated efficiently with reasonable amount of overhead linearly
increasing to the scale of WSNs.
Decentralization: Since using global information in a distributed environment such as a
sensor network can incur high overheads, the proposed scheme should use purely local
information in its approach. Then it will be operated in a decentralized fashion over large
scale of WSNs.
Loose Synchronization: To minimize the cost of aggregation, most of theoretical solutions use
tree structures, e.g., the shortest path tree, the minimum spanning tree and the Steiner
Wireless Sensor Networks 334
minimum tree. Although these tree structures reduce the redundancy among data, they also
requires synchronization among nodes that transmit, aggregate or forward data. However,
since the synchronization is also one of hard problems in WSNs, the proposed scheme will
relax the degree of synchronization so that it can be operated without assumption of other
synchronization algorithms.
Mobility and Node Failures: The dynamic change of network topology due to mobility and
node failures makes aggregation schemes in WSNs inefficient and even more out of service.
Therefore, the proposed scheme will address this problem by constructing an aggregation
structure, dynamically and instantaneously.
4.1 Core Construction
Same core construction mechanism is used as presented in section 3. Based on this core
structure, a node in a network should be one of core nodes, non-core nodes, or leaf nodes.
A core node is a node at a core band of which band-id2is 3i. Two core nodes in the same
core band should have at least two-hop distance between each other to reduce the total
number of core nodes. A core node also keeps the information of a precedent in the shortest
path tree root at a sink, so
that the core at 3i band can transmit the data to another core node
at inner core 3(i-1) band, eventually.
Fig. 8. Instantaneous Core Construction in Up-Stream Data Delivery Scheme
All nodes at non-core bands 3i+1 or 3i-1 should be a non-core node. And some nodes at core
band 3i might become a non-core node based on the core construction procedure. All non-
core nodes should access two nodes: its core node at 3i band and its precedent in the SPT, of
which band-id is less than its band-id. Some non-core nodes at 3i+1 or 3i-1 band cannot have
a neighboring core node at 3i band. In this case, they can still access a core node
at 3i band through its neighboring non-core node at 3i band indirectly. For exceptional
cases, some non-core nodes of which band-id is 3i+2 cannot have any neighboring nodes
located at core band 3i+3. These non-core nodes declare themselves as a leaf node. Then they
always transmit data to a precedent that is a non-core node at inner band 3i+1. Figure 8
shows the instant result for core construction by disseminating a query through a network.
4.2. Two Stages of Data Aggregation
Stage 1: Original Data Transmission
We assume that all nodes know the start time of data transmission for each query.
Fig. 9. Stage 1: Original Data Transmission
If a non-core node at 3i-1 or 3i+1 band is a source node, it will transmit data to its core at
core bands after some delay. If the receiving node at core band 3i does not declare itself as a
core node, it will forward the data to its core node at the same core band 3i. We use a
contention-free medium access control scheme to coordinate all non-core sources around a
core node based on the number of non-core nodes around the core node. In Figure 9, all
non-core nodes, white circles, send data to core nodes, gray circles. Between different
groups around each core node, we don't need to consider scheduling because they are
separated with each other at least two-hop distance.
If a leaf node at 3i+2 band is a source node, it will transmit data immediately to its
neighbouring non-core node at 3i+1 bands so that the neighbouring non-core node can
receive the data successfully before it sends its own data. In Figure 9, leaf nodes at band 5,
checked circles, send data to transmit data successfully to a non-core node within that delay.
Fig. 10. Stage 2: Aggregated Data Transmission
If a core node at core bands is not a source node, it does not need to transmit data unless it
receives any data from its non-core nodes or core nodes at outer core band. Although the
core node has data to send, it will wait for some time. so that it can wait and aggregate its
own data with incoming data from other core nodes that are located at outer bands.
On the Design and Analysis of Transport Protocols over Wireless Sensor Networks 335
minimum tree. Although these tree structures reduce the redundancy among data, they also
requires synchronization among nodes that transmit, aggregate or forward data. However,
since the synchronization is also one of hard problems in WSNs, the proposed scheme will
relax the degree of synchronization so that it can be operated without assumption of other
synchronization algorithms.
Mobility and Node Failures: The dynamic change of network topology due to mobility and
node failures makes aggregation schemes in WSNs inefficient and even more out of service.
Therefore, the proposed scheme will address this problem by constructing an aggregation
structure, dynamically and instantaneously.
4.1 Core Construction
Same core construction mechanism is used as presented in section 3. Based on this core
structure, a node in a network should be one of core nodes, non-core nodes, or leaf nodes.
A core node is a node at a core band of which band-id2is 3i. Two core nodes in the same
core band should have at least two-hop distance between each other to reduce the total
number of core nodes. A core node also keeps the information of a precedent in the shortest
path tree root at a sink, so
that the core at 3i band can transmit the data to another core node
at inner core 3(i-1) band, eventually.
Fig. 8. Instantaneous Core Construction in Up-Stream Data Delivery Scheme
All nodes at non-core bands 3i+1 or 3i-1 should be a non-core node. And some nodes at core
band 3i might become a non-core node based on the core construction procedure. All non-
core nodes should access two nodes: its core node at 3i band and its precedent in the SPT, of
which band-id is less than its band-id. Some non-core nodes at 3i+1 or 3i-1 band cannot have
a neighboring core node at 3i band. In this case, they can still access a core node
at 3i band through its neighboring non-core node at 3i band indirectly. For exceptional
cases, some non-core nodes of which band-id is 3i+2 cannot have any neighboring nodes
located at core band 3i+3. These non-core nodes declare themselves as a leaf node. Then they
always transmit data to a precedent that is a non-core node at inner band 3i+1. Figure 8
shows the instant result for core construction by disseminating a query through a network.
4.2. Two Stages of Data Aggregation
Stage 1: Original Data Transmission
We assume that all nodes know the start time of data transmission for each query.
Fig. 9. Stage 1: Original Data Transmission
If a non-core node at 3i-1 or 3i+1 band is a source node, it will transmit data to its core at
core bands after some delay. If the receiving node at core band 3i does not declare itself as a
core node, it will forward the data to its core node at the same core band 3i. We use a
contention-free medium access control scheme to coordinate all non-core sources around a
core node based on the number of non-core nodes around the core node. In Figure 9, all
non-core nodes, white circles, send data to core nodes, gray circles. Between different
groups around each core node, we don't need to consider scheduling because they are
separated with each other at least two-hop distance.
If a leaf node at 3i+2 band is a source node, it will transmit data immediately to its
neighbouring non-core node at 3i+1 bands so that the neighbouring non-core node can
receive the data successfully before it sends its own data. In Figure 9, leaf nodes at band 5,
checked circles, send data to transmit data successfully to a non-core node within that delay.
Fig. 10. Stage 2: Aggregated Data Transmission
If a core node at core bands is not a source node, it does not need to transmit data unless it
receives any data from its non-core nodes or core nodes at outer core band. Although the
core node has data to send, it will wait for some time. so that it can wait and aggregate its
own data with incoming data from other core nodes that are located at outer bands.
Wireless Sensor Networks 336
Stage 2: Aggregated Data Transmission
After stage 1, we assume that all data from non-core nodes are received by core nodes and
aggregated with other data. The remaining procedure is to deliver the aggregated data to a
sink. To deliver these aggregated data, this scheme uses the shortest path tree that was
constructed during the corresponding query flooding. Figure 10 shows delivery paths
between core nodes at different core bands. Compared to the original shortest path tree, the
paths have some differences. Instead of reaching a sink directly using the SPT, it is better to
reach another core node at inner band since it can reduce redundancy among other
aggregated data. Whenever a non-core node at core bands receives aggregated data from
other core nodes at outer bands, it will forward them to its core node at the same core band.
5. Peformance Analysis and Discussion
This section is focussed on a formal analysis and performance evaluation of the protocol
design proposed in this chapter.
5.1. Downstream Data Delivery
For easy reference we call our downstream data delivery scheme GARUDA. The NS2
simulator is used for all evaluations. For all experiments: (a) the rst 100 nodes are placed in a
grid fashion within a 650m x 650m square area to ensure connectivity, while the remaining
nodes are randomly deployed within that area, and the sink node is located at the centre of
one of the edges of the square; (b) transmission range of each node is 65m ; (c) channel
capacity is 1 Mbps; and (d) each message consists of 100 packets (except for the single packet
delivery part); and the size of packet is 1 KB. CSMA/CA is used as the MAC protocol. We
use basic flooding as the routing protocol. All the simulation results are shown after
averaging the metrics over 20 randomly generated topologies and calculating 95%
confidence intervals. We choose a fixed packet loss rate of 5% for wireless channel error, and
vary the number of nodes in the network, which in turn increases the degree of contention
in the network.
5.1.1 Latency
The latency involved in receiving a single packet reliably and multiple packet delivery with
increasing number of sensors is presented in Figure 11(a) and (b) respectively for both the
proposed framework and the ACK based scheme. The latency of the proposed scheme was
significantly smaller because of the two radio approach, which used an implicit NACK
scheme. This means that there was no explicit NACK sent to the sender of a packet if a
packet was not received, thus not increasing the load in the network. Although, our core
construction scheme used out-of-sequence delivery, we piggybacked the A-map of the core
node along with the transmission of each packet which allows the non-core nodes to wait
for the core to recover from all loses prior to any retransmission requests thus eliminating
the NACK implosion problem.
(a) (b)
Fig. 11. Latency Comparison between proposed Down Stream Data Delivery Scheme and
Basic ACK Scheme for (a) First/Single Packet Delivery and (b) Multiple Packets Delivery
5.1.2 Number of Data Packet Sent
(a) (b)
Fig. 12. Number of Data Packets Sent among among the proposed approach and (a) Basic
ACK Scheme for First/Single Packet Delivery (b) Alternatives for Multiple Packets Delivery
Figure 12(a) shows the number of data sent by the proposed framework and the ACK based
scheme. It is interesting to note that in our proposed framework, the number of data sent
increased more or less linearly (with a slope of 1 approximately) as the number of nodes
increased. The implicit NACK scheme coupled with the inherent redundancy involved in
the flooding process itself is the main reason for this trend. The implicit NACK scheme
alleviates congestion related losses, while the inherent redundancy and the broadcast nature
of the flooding process ensures that the packet is received successfully without any need for
retransmission even in the presence of losses. For the ACK based scheme, the number of
data packets sent was appreciably higher and showed a nonlinear increasing trend with
increasing number of nodes in the network. This is again because of the increased load in
the network due to the presence of ACK transmissions thus increasing the losses in the
network. We observe in the case of multiple packet delivery (Figure 12(b)), that the
proposed scheme outperforms alternative schemes.
On the Design and Analysis of Transport Protocols over Wireless Sensor Networks 337
Stage 2: Aggregated Data Transmission
After stage 1, we assume that all data from non-core nodes are received by core nodes and
aggregated with other data. The remaining procedure is to deliver the aggregated data to a
sink. To deliver these aggregated data, this scheme uses the shortest path tree that was
constructed during the corresponding query flooding. Figure 10 shows delivery paths
between core nodes at different core bands. Compared to the original shortest path tree, the
paths have some differences. Instead of reaching a sink directly using the SPT, it is better to
reach another core node at inner band since it can reduce redundancy among other
aggregated data. Whenever a non-core node at core bands receives aggregated data from
other core nodes at outer bands, it will forward them to its core node at the same core band.
5. Peformance Analysis and Discussion
This section is focussed on a formal analysis and performance evaluation of the protocol
design proposed in this chapter.
5.1. Downstream Data Delivery
For easy reference we call our downstream data delivery scheme GARUDA. The NS2
simulator is used for all evaluations. For all experiments: (a) the rst 100 nodes are placed in a
grid fashion within a 650m x 650m square area to ensure connectivity, while the remaining
nodes are randomly deployed within that area, and the sink node is located at the centre of
one of the edges of the square; (b) transmission range of each node is 65m ; (c) channel
capacity is 1 Mbps; and (d) each message consists of 100 packets (except for the single packet
delivery part); and the size of packet is 1 KB. CSMA/CA is used as the MAC protocol. We
use basic flooding as the routing protocol. All the simulation results are shown after
averaging the metrics over 20 randomly generated topologies and calculating 95%
confidence intervals. We choose a fixed packet loss rate of 5% for wireless channel error, and
vary the number of nodes in the network, which in turn increases the degree of contention
in the network.
5.1.1 Latency
The latency involved in receiving a single packet reliably and multiple packet delivery with
increasing number of sensors is presented in Figure 11(a) and (b) respectively for both the
proposed framework and the ACK based scheme. The latency of the proposed scheme was
significantly smaller because of the two radio approach, which used an implicit NACK
scheme. This means that there was no explicit NACK sent to the sender of a packet if a
packet was not received, thus not increasing the load in the network. Although, our core
construction scheme used out-of-sequence delivery, we piggybacked the A-map of the core
node along with the transmission of each packet which allows the non-core nodes to wait
for the core to recover from all loses prior to any retransmission requests thus eliminating
the NACK implosion problem.
(a) (b)
Fig. 11. Latency Comparison between proposed Down Stream Data Delivery Scheme and
Basic ACK Scheme for (a) First/Single Packet Delivery and (b) Multiple Packets Delivery
5.1.2 Number of Data Packet Sent
(a) (b)
Fig. 12. Number of Data Packets Sent among among the proposed approach and (a) Basic
ACK Scheme for First/Single Packet Delivery (b) Alternatives for Multiple Packets Delivery
Figure 12(a) shows the number of data sent by the proposed framework and the ACK based
scheme. It is interesting to note that in our proposed framework, the number of data sent
increased more or less linearly (with a slope of 1 approximately) as the number of nodes
increased. The implicit NACK scheme coupled with the inherent redundancy involved in
the flooding process itself is the main reason for this trend. The implicit NACK scheme
alleviates congestion related losses, while the inherent redundancy and the broadcast nature
of the flooding process ensures that the packet is received successfully without any need for
retransmission even in the presence of losses. For the ACK based scheme, the number of
data packets sent was appreciably higher and showed a nonlinear increasing trend with
increasing number of nodes in the network. This is again because of the increased load in
the network due to the presence of ACK transmissions thus increasing the losses in the
network. We observe in the case of multiple packet delivery (Figure 12(b)), that the
proposed scheme outperforms alternative schemes.
Wireless Sensor Networks 338
5.1.3 Energy Efficiency
(a) (b)
Fig. 13. Energy Consumption per node Comparison between proposed Down Stream Data
Delivery Scheme and Basic ACK Scheme for (a) First/Single Packet Delivery and (b)
Multiple Packets Delivery
Figure 13 shows energy consumption per node comparison between proposed scheme and
other alternative schemes. The average energy consumed per node is significantly smaller
for the our case when compared to the other two cases (Figure 13(b)). The average energy
consumed for all three cases was directly proportional to the number of transmissions,
which was the sum of the number of requests sent and the number of data sent per node.
Hence, the reduction in energy consumption follows.
5.2 Up Stream Energy Efficient Data Delivery
Likewise, we refer GARUDA-UP in the graphs for easy reference in this section for
upstream data delivery scheme proposed in this chapter. We assume a typical one-shot
query-response model in sensor networks. In this model, a sink broadcasts a query to the
entire network and sensors that have corresponding information will reply with one
message.
In terms of message size, we assume that every source sends one message of the same size,
but the specific length of the message does not matter. We use a discrete event simulator for
all evaluations. The simulation topologies are largely similar to that used in general sensor
networks: 2000 to 8000 nodes uniformly distributed within a circular field of radius 400m.
The number of sources that generate messages for one specific query varies from 1/10 to
1/4 of the total number of nodes in the network. We compare GARUDA-UP with SPT since
most of the current routing protocols in the context of WSNs such as Directed Diffusion and
GPSR try to approximate the message complexity of SPT. We
are interested in how
GARUDA-UP performs better compared to the centralized algorithm. We also compare it
with MST, which represents the optimal solution in the target environment. Ideally, we
should have compared it with the Steiner minimum tree. But as we mentioned before, the
computation overhead is very high, especially since we are considering thousands of nodes,
and the time it takes to generate even one sample is prohibitive. For this reason, we use MST
to approximate Steiner Tree performance which has the same message complexity order,
that of Steiner minimum tree, but a much less computation cost. We generate SPT with
Dijkstra's algorithm and MST with Prim's algorithm. We evaluate the GARUDA-UP
approach using message complexity that is equal to the total cost of data aggregation. For
message complexity, we measure the total number of transmissions required for all
responses to reach the sink. To focus on the comparison of aggregation efficiency of
different structures, we assume a perfect MAC layer that avoids collisions for all
approaches. All the simulation results are derived after averaging results over 10 random
seeds and are presented within 95% confidence intervals.
5.2.1 Node Densities
From Figure 14(a) and (b), we observe that proposed scheme outperforms the SPT scheme
under all situations. Therefore, from the simulation results, we can say that GARUDA-UP is
a good decentralized approximation to the MST. We can also see that the cost of the SPT
increases faster than that of the proposed approach as the number of nodes increases. This is
expected since more number of nodes reduces the efficiency of aggregation in the SPT as the
paths chosen by different sources are less likely to overlap.
(a) (b)
Fig. 14. Performance Comparison among SPT, MST, and Proposed Upstream scheme for
Varying Number of Nodes and Fixing the Ratio of Number of Nodes to that of Sources to (a)
10 and (b) 4
Therefore, the proposed approach can be considered as a more scalable decentralized
approach as the number of nodes increases. Furthermore, it is observed that the difference
between two schemes increases as the ratio of the number of sources to the number of
nodes, decreases because more number of sources increase the probability of aggregation for
the SPT.
5.2.2. Role of Redundancy
We outline that upstream design is very much dependent on spatial distribution of sensor
nodes in a plane. It is interesting to know with what probability we can find sensor nodes in
the neighbourhood that support this kind of scheme. To illustrate this, we
take an isotropic
On the Design and Analysis of Transport Protocols over Wireless Sensor Networks 339
5.1.3 Energy Efficiency
(a) (b)
Fig. 13. Energy Consumption per node Comparison between proposed Down Stream Data
Delivery Scheme and Basic ACK Scheme for (a) First/Single Packet Delivery and (b)
Multiple Packets Delivery
Figure 13 shows energy consumption per node comparison between proposed scheme and
other alternative schemes. The average energy consumed per node is significantly smaller
for the our case when compared to the other two cases (Figure 13(b)). The average energy
consumed for all three cases was directly proportional to the number of transmissions,
which was the sum of the number of requests sent and the number of data sent per node.
Hence, the reduction in energy consumption follows.
5.2 Up Stream Energy Efficient Data Delivery
Likewise, we refer GARUDA-UP in the graphs for easy reference in this section for
upstream data delivery scheme proposed in this chapter. We assume a typical one-shot
query-response model in sensor networks. In this model, a sink broadcasts a query to the
entire network and sensors that have corresponding information will reply with one
message.
In terms of message size, we assume that every source sends one message of the same size,
but the specific length of the message does not matter. We use a discrete event simulator for
all evaluations. The simulation topologies are largely similar to that used in general sensor
networks: 2000 to 8000 nodes uniformly distributed within a circular field of radius 400m.
The number of sources that generate messages for one specific query varies from 1/10 to
1/4 of the total number of nodes in the network. We compare GARUDA-UP with SPT since
most of the current routing protocols in the context of WSNs such as Directed Diffusion and
GPSR try to approximate the message complexity of SPT. We
are interested in how
GARUDA-UP performs better compared to the centralized algorithm. We also compare it
with MST, which represents the optimal solution in the target environment. Ideally, we
should have compared it with the Steiner minimum tree. But as we mentioned before, the
computation overhead is very high, especially since we are considering thousands of nodes,
and the time it takes to generate even one sample is prohibitive. For this reason, we use MST
to approximate Steiner Tree performance which has the same message complexity order,
that of Steiner minimum tree, but a much less computation cost. We generate SPT with
Dijkstra's algorithm and MST with Prim's algorithm. We evaluate the GARUDA-UP
approach using message complexity that is equal to the total cost of data aggregation. For
message complexity, we measure the total number of transmissions required for all
responses to reach the sink. To focus on the comparison of aggregation efficiency of
different structures, we assume a perfect MAC layer that avoids collisions for all
approaches. All the simulation results are derived after averaging results over 10 random
seeds and are presented within 95% confidence intervals.
5.2.1 Node Densities
From Figure 14(a) and (b), we observe that proposed scheme outperforms the SPT scheme
under all situations. Therefore, from the simulation results, we can say that GARUDA-UP is
a good decentralized approximation to the MST. We can also see that the cost of the SPT
increases faster than that of the proposed approach as the number of nodes increases. This is
expected since more number of nodes reduces the efficiency of aggregation in the SPT as the
paths chosen by different sources are less likely to overlap.
(a) (b)
Fig. 14. Performance Comparison among SPT, MST, and Proposed Upstream scheme for
Varying Number of Nodes and Fixing the Ratio of Number of Nodes to that of Sources to (a)
10 and (b) 4
Therefore, the proposed approach can be considered as a more scalable decentralized
approach as the number of nodes increases. Furthermore, it is observed that the difference
between two schemes increases as the ratio of the number of sources to the number of
nodes, decreases because more number of sources increase the probability of aggregation for
the SPT.
5.2.2. Role of Redundancy
We outline that upstream design is very much dependent on spatial distribution of sensor
nodes in a plane. It is interesting to know with what probability we can find sensor nodes in
the neighbourhood that support this kind of scheme. To illustrate this, we
take an isotropic
Wireless Sensor Networks 340
Gaussian case and show how probability of detection of redundancy varies with distance.
We integrate equation 6 over the region of the area Ͷߨ
ୱ
ଶ
. We get the following equation:
ሺ
ܺ
൏ʹݎ
௦
ሻ
ൌͳെ݁
ି
ሺ
ఓା௩
ሻ
గ
ೞ
మ
ቌ ݒ
భ
ర
ට
ഏ
ೌ
ି
ට
భ
రೌ
ୣ୰ሺଶ
ೞ
ሻ
ା௩
ቍ (7)
where,
and erf(x) is error function for each element of x.
Event type AB is related to the event that A and B both occur i.e., the event type AB. Hence,
we are interested in the variation of pr(X
AB
< r) with radial distance r. In figure 4, we show
the probability variation for three values. As we can see, when it is very low (0.001), the
pr(X
AB
< r) is low and as we increase the value of the probability, its value increases. Those
values play an important role in nearest neighbour probability. For a densely distributed
sensor network, value is large and hence results into more redundant data collected by
neighbourhood nodes.
(a) (b)
Fig. 15. Near Neighbour probability Variation with relative distance r for (a) different
2
(Sigma2) values for = 0:1, = 0:1, = 0.1 and =
1
and (b) different (mu) values for
2
=1 values for = 0.1, = 0.1, = 0.1 and
1
= 1
Figure 15(b) shows the variation of pr(X
AB
< r) with distance r for different variance values.
As the value of variance increases, we expect less redundancy in the data values as shown in
the figure. The figure demonstrates that variance is one critical design parameter. In both
figures (15(a) and (b)), we see as distance increases, probability to find a nearest neighbour
point increases and converge to 1. However, not necessarily they all satisfy the condition of
redundancy. Only those sensors first the condition of redundancy that are separated by not
more than sum of their sensing ranges. There are different sensing ranges for different
sensor networks and under the given distribution, we can easily calculate the probability of
two sensors overlapping each other's sensing ranges. We show the figures for only 3m range
as after that the probability converge to 1 (however it may not be true for all the
distributions) and remain constant for larger values of radial distance. Hence, the upstream
protocol gives better results if nodes are closely located and can exploit the redundancy.
6. Conclusion
Dense deployment of sensor network results in better operation using collaborative nature
of wireless sensor networks. This collaboration results in redundant data which proved as a
unique characteristic of a typical sensor network. In this chapter, we introduced a
redundancy model. In this model, we observed that redundant data occurs when the nearby
sensor devices are separated by not more than twice their sensing radius. It is seen that
when condition of redundancy meets near neighbour distribution, which is a very
important factor which gives the degree of overlap among sensors in the near neighbour
distribution. We proposed the reliable downstream data delivery. Reliable data delivery
problem is formulated theoretically using the minimum set cover problem and transformed
it to the minimum dominating set (MDS) problem for a practical and feasible standpoint.
Proposed framework consist of (i) the core to approximate the MDS; (ii) WFP pulses to
tackle a new challenge, lost-all-packet problem; (iii) two-stage recovery to reduce possibility
of collision as well as utilize the broadcast nature of wireless networks; and (iv) A-map to
prevent error propagation. Performance of this scheme is evaluated with other previous
schemes; and showed that it outperforms other schemes in terms of latency and the number
of retransmissions and per node energy efficiency.
Upstream energy efficient framework is formulated for the perfectly correlated data
aggregation problem by using the Steiner minimum tree (SMT) and showed the upper
bound for message complexity. We also compare the performance of this approach with the
SPT and the minimum spanning tree (MST) through simulations and showed that it
outperforms the SPT and closely approaches the SMT with less computational complexity
and without global coordination. We believe in addition to the shortest path tree and the
minimum dominating set, one can also exploit the characteristics of the minimum spanning
tree or minimum set cover with small amount of overhead and distributed coordination.
The other way is to find an optimal solution for the upstream data aggregation problem
assuming a correlation factor between 0 and 1; and then design an approximation solution
for the general aggregation problem in a decentralized fashion so that one can implement it
over wireless sensor networks. We also discuss the role of near neighbour distribution in
design of such schemes.
7. References
GAREY, M. R. & JOHNSON, D. S.(1979), Computers and Intractability, A Guide to the
Theory of NP-completeness. Freeman, 1979.
GOPALSAMY, T., SINGHAL, M., PANDA, D., and SADAYAPPAN, P.(2002), A reliable
multicast algorithm for mobile ad hoc networks, in Proceedings of 22nd
International Conference on Distributed Computing Systems, (Vienna, Austria), pp.
563-570, July 2002.
On the Design and Analysis of Transport Protocols over Wireless Sensor Networks 341
Gaussian case and show how probability of detection of redundancy varies with distance.
We integrate equation 6 over the region of the area Ͷߨ
ୱ
ଶ
. We get the following equation:
ሺ
ܺ
൏ʹݎ
௦
ሻ
ൌͳെ݁
ି
ሺ
ఓା௩
ሻ
గ
ೞ
మ
ቌ ݒ
భ
ర
ට
ഏ
ೌ
ି
ට
భ
రೌ
ୣ୰ሺଶ
ೞ
ሻ
ା௩
ቍ (7)
where,
and erf(x) is error function for each element of x.
Event type AB is related to the event that A and B both occur i.e., the event type AB. Hence,
we are interested in the variation of pr(X
AB
< r) with radial distance r. In figure 4, we show
the probability variation for three values. As we can see, when it is very low (0.001), the
pr(X
AB
< r) is low and as we increase the value of the probability, its value increases. Those
values play an important role in nearest neighbour probability. For a densely distributed
sensor network, value is large and hence results into more redundant data collected by
neighbourhood nodes.
(a) (b)
Fig. 15. Near Neighbour probability Variation with relative distance r for (a) different
2
(Sigma2) values for = 0:1, = 0:1, = 0.1 and =
1
and (b) different (mu) values for
2
=1 values for = 0.1, = 0.1, = 0.1 and
1
= 1
Figure 15(b) shows the variation of pr(X
AB
< r) with distance r for different variance values.
As the value of variance increases, we expect less redundancy in the data values as shown in
the figure. The figure demonstrates that variance is one critical design parameter. In both
figures (15(a) and (b)), we see as distance increases, probability to find a nearest neighbour
point increases and converge to 1. However, not necessarily they all satisfy the condition of
redundancy. Only those sensors first the condition of redundancy that are separated by not
more than sum of their sensing ranges. There are different sensing ranges for different
sensor networks and under the given distribution, we can easily calculate the probability of
two sensors overlapping each other's sensing ranges. We show the figures for only 3m range
as after that the probability converge to 1 (however it may not be true for all the
distributions) and remain constant for larger values of radial distance. Hence, the upstream
protocol gives better results if nodes are closely located and can exploit the redundancy.
6. Conclusion
Dense deployment of sensor network results in better operation using collaborative nature
of wireless sensor networks. This collaboration results in redundant data which proved as a
unique characteristic of a typical sensor network. In this chapter, we introduced a
redundancy model. In this model, we observed that redundant data occurs when the nearby
sensor devices are separated by not more than twice their sensing radius. It is seen that
when condition of redundancy meets near neighbour distribution, which is a very
important factor which gives the degree of overlap among sensors in the near neighbour
distribution. We proposed the reliable downstream data delivery. Reliable data delivery
problem is formulated theoretically using the minimum set cover problem and transformed
it to the minimum dominating set (MDS) problem for a practical and feasible standpoint.
Proposed framework consist of (i) the core to approximate the MDS; (ii) WFP pulses to
tackle a new challenge, lost-all-packet problem; (iii) two-stage recovery to reduce possibility
of collision as well as utilize the broadcast nature of wireless networks; and (iv) A-map to
prevent error propagation. Performance of this scheme is evaluated with other previous
schemes; and showed that it outperforms other schemes in terms of latency and the number
of retransmissions and per node energy efficiency.
Upstream energy efficient framework is formulated for the perfectly correlated data
aggregation problem by using the Steiner minimum tree (SMT) and showed the upper
bound for message complexity. We also compare the performance of this approach with the
SPT and the minimum spanning tree (MST) through simulations and showed that it
outperforms the SPT and closely approaches the SMT with less computational complexity
and without global coordination. We believe in addition to the shortest path tree and the
minimum dominating set, one can also exploit the characteristics of the minimum spanning
tree or minimum set cover with small amount of overhead and distributed coordination.
The other way is to find an optimal solution for the upstream data aggregation problem
assuming a correlation factor between 0 and 1; and then design an approximation solution
for the general aggregation problem in a decentralized fashion so that one can implement it
over wireless sensor networks. We also discuss the role of near neighbour distribution in
design of such schemes.
7. References
GAREY, M. R. & JOHNSON, D. S.(1979), Computers and Intractability, A Guide to the
Theory of NP-completeness. Freeman, 1979.
GOPALSAMY, T., SINGHAL, M., PANDA, D., and SADAYAPPAN, P.(2002), A reliable
multicast algorithm for mobile ad hoc networks, in Proceedings of 22nd
International Conference on Distributed Computing Systems, (Vienna, Austria), pp.
563-570, July 2002.
Wireless Sensor Networks 342
HEINZELMAN, W. R., KULIK, J., and BALAKRISHNAN, H.(1999), Adaptive protocols for
information dissemination in wireless sensor networks, in MOBICOM, pp. 174-185,
Aug 1999.
HWANG, F., RICHARDS, D., and WINTER, P.(1992), The Steiner Tree Problem. North-
Holland,1992.
Kahn, J.; Katz, & Pister K. (1999). Next century challenges: Mobile networking for smart
dust. In Fifth annual international conference on Mobile computing and
networking (MobiCom 99), pages 263-270, Seattle, USA, August 1999.
KARP, R. M.(1972), Reducibility among combinatorial problems, Complexity of Computer
Computations, pp. 85-103, May 1972.
Madden, Samuel ; Franklin, Michael J. ; Hellerstein, Joseph M.; & Hong, Wei(2002) . Tag: a
tiny aggregation service for ad-hoc sensor networks. Proceedings of the 5th
symposium on Operating systems design and implementation, 39:131-146, 2002.
Maritz, J. S.(1952). Note on a certain family of discrete distributions. Biometrika, 39:196-8,
1952.
Pottie, G.J. and Kaiser, W.J.(2000). Wireless integrated network sensors. Communications of
the ACM, 43(5):51-58, May 2000.
SIVAKUMAR, R., SINHA, P., & BHARGHAVAN, V.(1999), CEDAR: a Core-Extraction
Distributed Ad hoc Routing algorithm, IEEE Journal on Selected Areas in
Communications (Special Issue on Ad-hoc Routing), vol. 17, pp. 1454-1465, Aug.
1999.
TANG, K. and GERLA, M.(2001), MAC reliable broadcast in ad hoc networks, in Proc. IEEE
MILCOM, (Virginia, USA), pp. 1008-1013, Aug. 2001.
WAN, C Y., CAMPBELL, A., & KRISHNAMURTHY, L.(2002), PSFQ: A Reliable Transport
Protocol for Wireless Sensor Networks, in Proc. ACM International Workshop on
Sensor Networks and Architectures, (Atlanta, USA), pp. 1-11, Sept. 2002.
YE, Z., KRISHNAMURTHY, S., & TRIPATHI, S.(2003), A framework for reliable routing in
mobile ad hoc networks, in Proceedings of IEEE INFOCOM, (San Francisco, USA),
pp. 270-280, Mar. 2003.