Environmental Management Part 7 pdf
Bạn đang xem bản rút gọn của tài liệu. Xem và tải ngay bản đầy đủ của tài liệu tại đây (530.51 KB, 20 trang )
Implementation of Strategic Environmental Assessment in Serbia
with Special Reference to the Regional Plan of Waste Management
109
In Table 7. are shown indicators and the competent authorities for monitor the
environmental situation in the area covered by Regional waste management plan of the
Kolubara region. Monitoring program is developed and key indicators have been
established for water, air quality, climate change and transport. These are aspects of the
environment in which the implementation plan is likely to have impact. An additional set of
indicators includes indicators that are not affected significantly. This refers to biodiversity,
landscapes and so on. Additionally to the above mentioned it has to be stated that the
presented SEA is found to promote quite balanced sustainability, with the lowest score
found within social benefits and the highest in economical (Crnčević, Therivel, 2009).
4. Conclusions
The paper emphasis is put on presenting methodological approach was develop for SEA of
the Regional Waste Management Plan for 11 municipalities of Kolubara region, which is
made in the Institute of Architecture and Urban and Spatial Planning of Serbia. It was used
planning approach where aims and indicators are defined and evaluated in the context of
the realization of the plan solution and not technological. The presented methodology is
based on the experience of making SEA in developed countries, because even after more
then five years after the adoption of the SEA in Serbia still missing the adequate Regulations
as well guidelines which would help experts in developing methodological approach for
SEA. The presented methodological approach is based on multicriterion evaluation of
planning solutions in respect to the defined SEA aims and indicators of sustainable
development. It was used qualitative evaluations based on expert knowledge and
professional literature. Within the research were defined 24 indicators to evaluate planning
solutions that can have an impact on the environment as well the evaluation of existing
conditions for the analysis of existing potentials and was made a qualitative assessment of
the impacts of planned activities on these potentials. The appropriate protective measures
are defined and as well indicators for monitoring of the state of the environment. In SEA
presented in this paper were defined 15 indicators for monitoring. The aforementioned
methodological approach is broadly applicable to all areas of planning, but the concrete
contribution of the presented SEA is seen in the choice of relevant aims and indicators based
on the basic principles of waste management plan.
Way of selecting and displaying significant strategic impacts through the chart as presented
allows easy access to the results of the evaluation process and make the presentation of the
project easier. The results of the assessment of the planning solutions represent a good basis
for determining appropriate measures for environmental protection and guiding of
planning solutions in the context of achieving the desired goals. That is exactly the main
task of SEA and the aforementioned model that will certainly be developed over time.
Minor problems have been shown due to the lack of national databases, relevant data about
the environment, so their availability varied depending on the measurements which are
(not) being done in some municipalities. To overcome this problem it was implemented the
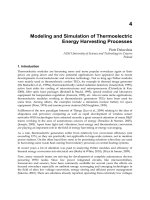
program called CORINA - the unique European information base about the environment
and the use of space (Fig 3). It is also used the internal informational basis in GIS, formed in
IAUS for the needs of spatial plans. The system supported by such information base made it
possible relatively high quality and rapid analysis of environmental data on the researched
area (Josimović, Ilić, Filipović, 2009).
Environmental Management
110
Fig. 3. CORINE map for Kolubara region
Implementation of Strategic Environmental Assessment in Serbia
with Special Reference to the Regional Plan of Waste Management
111
Scientific contribution of this work is reflected in the adjustment of SEA methodology
(developed in IAUS) for the presented sectoral regional waste management plan where
applied methodology can be used for other plans and programs for waste management in
different hierarchy levels. Adjustments are primarily related to the selection of relevant
strategic aims and indicators in the context of the current state of the environment in the
planning area and the possible negative impacts of the plan to the environment, but also
how the evaluation is presented using the chart.
Directions for future research in environmental protection in the field of waste management
should include following:
• development of information base of the space which will form the basis for effective
environmental protection,
• development of indicators adapted to the needs of the SEA,
• development of indicators in the function for monitoring the environment in areas
where are established systems of waste management
• the implementation of the education program of the population on contemporary
principles and technologies of waste management treatment and waste disposal in
order to reduce resistance of the population which is particularly evident in the location
of landfill space.
The implementation of these settings would contribute to the systematic and
methodological problem solving of environmental management in the planning and
development of the SEA and completed the researches of spatial aspects of waste
management. So by this way this issue will be seen from the perspective that in the spatial
sense enables the establishment of modern waste management system based on a good
(effective) organization of space with the protection of all environmental factors.
This paper was completed as a part of the project “Spatial, social and ecological aspects of
development in great mining basins” TP 16008, which has been financed by the Serbian Ministry of
Science and Technological Development”.
5. References
Crnčević, T. (2005). The Law on Strategic Environmental Assessment - tool for implementing
sustainable development strategy or just another administrative duty, Planning
and and normative space and environmental protection, pp. 57-67, ISBN 86-82657-
53-8, Belgrade, April 2005, Serbian Association of Space Planners and Faculty
of Geography, Belgrade.
Crnčević, T. (2007). Strategic Environmental Assessment as an instrument for enhancement
of public participation in planning, SPATIUM Journal, No 15/16, Institute of
Architecture and Urban & Spatial Planning of Serbia, pp. 72-78, ISSN 1450-569X.
Crnčević, T. (2009). Strategic Environmental Assessment in urban planning - support to the
development of the theory and practice, Monographic issue No. 60, Sasa Milijic,
Jasna Petric (Ed.), pp. 1-183, Institute of Architecture and Urban & Spatial Planning
of Serbia, ISBN 978-86-80329-62-8, Belgrade.
Crnčević, T.; Therivel, R. (2009). Acheiving sustainability in planning: English and Serbian
experiences, Spatial Planning and Strategic Governance, pp. 83-106, ISBN 978-86-
80329-61-1, Belgrade, December 2009, Institute of Architecture and Urban & Spatial
Planning of Serbia, Belgrade.
Environmental Management
112
European Parliament and the Council. (2001). Council Directive 2001/42/ EC on the
Assessment of the Effects of Certain Plans and Programmes on the Environment.
Josimović, B., Crnčević, T. (2006). Procedures of Strategic Environmental Assessment of the
Plan of detailed regulation of the business complexes, Architecture and Urbanism,
No.18/19, pp. 113 -117, ISSN 0354-6055.
Josimović, B. et al. (2010). Strategic Environmental Assessment for Waste Management
Regional Plan for 11 Municipalities in Kolubara region in Serbia, pp. 1-102, Institute
of Architecture and Urban & Spatial Planning of Serbia, Belgrade.
Josimović B.; Crnčević, T. (2009). Impact evaluation within Strategic Environmental
Assessment: The Case Study of the Waste Management Regional Plan for Kolubara
region in Serbia, Environmental Engineering and Management Journal, Vol8, No3,
Department of Environmental Engineering and Management-Faculty of Chemical
Engineering, IASI, pp.457-462, ISSN 1582-9596.
Josimović, B.; Ilić, M.; Filipović, D. (2009). Planning of Municipal Waste Management, book,
Mila Pucar (Ed.), pp. 1-157, Institute of Architecture and Urban & Spatial Planning
of Serbia, ISBN 978-86-80329-59-8, Belgrade.
Josimović, B.; Krunić, N. (2008). Implementation of GIS in selection of Locations for Regional
Landfill in the Kolubara Region, SPATIUM Journal, No 17-18, Institute of
Architecture and Urban & Spatial Planning of Serbia, pp. 72-78, ISSN 1450-569X.
Republic of Serbia. (2004). Law on Strategic Environmental Assessment, Official
gazette–Republic of Serbia No 135/04.
Stojanović, B. (2006). Strategic Environmental Assessment for Valjevo Municipality, pp. 1-65,
Institute of Architecture and Urban & Spatial Planning of Serbia, Belgrade.
Stojanovic, B.; Mitrovic, I. (2007). A critical review of the guidelines for the implementation
of the Law on strategic environmental assessment, pp. 361-370, ISBN 978-86-82657-
54-4, Belgrade, April 2007, Serbian Association of Space Planners and Faculty
of Geography, Belgrade.
Stojanovic, B., Spasic, N. (2006). A critical review of the implementation of the Law on
Strategic Environmental Assessment in the Spatial and Urban Planning,
Construction - Journal, No.1-2, CEAU, pp. 5-11, ISSN 0350-5421.
5
Incentives of Environmental Design and
Management in Urban Neighborhoods
GAO Xiaolu
Key Laboratory of Regional Sustainable Development Modeling,
Institute of Geographical Sciences and Natural Resources Research,
Chinese Academy of Sciences,
China
1. Introduction
Historically, many planning policies have been implemented to protect urban residential
environments, such as controls of land use change, regulations of green space, and
protection of landscapes. The importance of effective environmental management has been
recognized not only for its ability to enhance a sense of community identity, but also for
creating added value in residential areas (Adams & Leedy, 1987; de Haas et al., 1999; Jim,
2004; Murtagh, 1997).
Since the period of Reform and Opening in the late 1970s, China has been transforming from a
planned economy to a market economy. With rapid development for over 30 years in urban
areas, the quality of life of city-dwellers has greatly improved and the need for desirable and
high-profile residential environments has increased accordingly. In the process of large-scale
urban development, many new issues have surfaced, such as the sharp change of urban
landscapes and the dilapidation of old neighborhoods. For instance, during the period of the
welfare-housing system, most people lived in gated housing blocks maintained and managed
by their work units. In 1998, the system of allocating free housing to employees through their
work units was abolished, and it shifted to the allocation of housing subsidies. Many
residential blocks were commercialized and new inhabitants moved in. As work units no
longer had any management responsibilities, the environments of many areas have suffered
tremendously. The expanding gaps between new and old residential areas have significantly
reduced the overall quality of urban environments and have resulted in more and more social
problems. Therefore, it is critical to introduce a new market-based system of environmental
management of residential areas, the benefits of which must be clarified.
2. Aims and method
This chapter attempts to explore the critical determinants of environmental management
and clarify the benefits of environmental management using a micro-economic approach.
Many studies have been conducted in this field. For example, Lichfield (1988), Carter &
Bramley (2002), Coeterier (2002), and İpekoğlu (2006) analyzed the value of preserving
historic sites and traditional houses from the perspectives of urban forms and culture.
Gómez-Sal (2003) compared the effects of different environmental management policies
Environmental Management
114
using a landscape assessment system for residential areas consisting of ecological, economic,
and social indices. Prato (2000) presented a model for evaluating landscape management
schemes where a variety of ecological, economic, and policymaking attributes were
considered. Groat (1984) investigated public opinions toward the contextual fit of urban
space, providing the basis for planning and design rules for urban development.
In China, a great number of community-based evaluation systems of residential
environment have been presented in which indices of location, abundance of green space,
infrastructure and public facilities, housing price, and the social and economic attributes of
residents are commonly included (Xie, 1997; Ning & Cha, 1999; Hua, 1999; Li & Ye, 1999;
Chen et al., 2000; Li & Li, 2006; Wang et al., 2002; Wu et al., 2003; Zhang et al., 2004).
However, these studies have not emphasized the quality of environmental management.
Although sanitation, security, and landscape management in residential areas are thought to
be important factors of environmental quality (Wu et al., 1995), quantitative studies on the
economic value of environmental management are scarce.
This study is based on a site survey and an investigation of the previously-owned housing
market in Beijing. First, we conducted a site survey in the sample area and studied the main
determinants of environmental management in residential blocks using a factor analysis
method. Then, a hedonic regression approach was adopted to estimate the benefit of
environmental management from an analysis of housing prices.
3. Data
3.1 Study area
A basic assumption underlying the hedonic regression approach is that the valuations of
environmental products are homogeneous in the study area. Therefore, the scope of the
study area should be appropriately confined; otherwise, it is possible for the estimates to be
affected by the differentiation of submarkets. Accordingly, the study area is limited to the
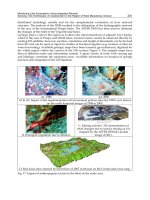
Asian Sports Village and Olympic areas in Beijing (the shaded areas in Fig. 1).
Beijing has a typical mono-centric structure. There are five ring roads around the Forbidden
City and several radical highways that form the main framework of the developed areas.
The study area lies across the northern Fourth and Fifth Ring Roads, occupying about 25
km
2
. It is next to highways in the east and west, and borders a river in the north and an
arterial road in the south. The area is located around the Asian Sports Village (built for the
1992 Asian Olympic Games), the Olympic Green Center, and National Forest Park
(constructed for the 2008 Olympic Games). There are a variety of residential compounds in
this area, e.g., old neighborhoods built in the 1970s and 1980s, large communities
constructed in the early 1990s, and new commercial housing blocks developed since 2000.
3.2 Site survey of residential blocks
We randomly chose 63 residential blocks and conducted a site survey, focusing on their
environmental design and management situations. The characteristics of the blocks were
captured from five perspectives: ‘building design’, ‘planning’, ‘management’, ‘community’,
and ‘surrounding relationship’. The survey involves 39 indices with scores of ‘+1’, ‘0’, and ‘-
1’. Table 1 lists the content of the survey and the standard of scoring.
The survey was conducted in May, 2007. To ensure objectivity in the survey, a detailed manual
was prepared, with concrete descriptions of the scoring standard and sample pictures for
reference. In addition, the property fee levels of each residential block were investigated.
Incentives of Environmental Design and Management in Urban Neighborhoods
115
1 Asian Sports Village, 2 Olympic Green, 3 National Forest Park
Fig. 1. Location of sample area in Beijing
Group Item Content Scoring standard
Elevation design Color, ratio, roof, silhouette, etc. +1: good; 0: average; -1: poor
Architectural style Creativity, cultural meaning +1: good; 0: average; -1: poor
Exterior Decoration materials +1: good; 0: average; -1: poor
Building management Safeguards and monitoring systems +1: complete; 0: simple; -1:
none
Ground plane design Design of hall and entrance,
connection with path and garden
+1: good; 0: average; -1: poor
Building
design
(6)
Barrier-free Barrier-free design +1: yes; 0: no
Harmony of buildings harmonious form, color, etc. +1: good; 0: average; -1: poor
Mixing building ages Similar age, quality, etc. +1: good; 0: average; -1: poor
Mixing land use Amount of industries and
commercial use incompatible to
residential use
+1: none; 0: some; -1: many
Road system Systematic and smooth +1: good; 0: average; -1: poor
Road quality Pavement, sewage system, lighting,
etc.
+1: good; 0: average; -1: poor
Open space Size and quality of public open space +1: good; 0: average; -1: poor
Central park Size of central park +1: good; 0: average; -1: poor
Waterscape Special design of waterscape +1: yes; 0: no
Garden Garden design of public green space +1: good; 0: average; -1: poor
Planning
(14)
Details Detail design of public space +1: good; 0: average; -1: poor
Changping District
Chaoyang
District
Shunyi District
Tongzhou
District
Daxing
District
3rd Rin
g
Rd.
Xuanwu District
Haidian District
Shijingshan
District
Badaling
Highway
Jingcheng
Highway
Fangshan
District
5th Rin
g
Rd.
4th Ring Rd.
Chongwen
District
Fengtai
District
Chang’an Steet
Xicheng
District
1
2
3
Dongcheng
District
Airport
Highway
Environmental Management
116
Group Item Content Scoring standard
Sight focus Sight focus design +1: good; 0: average; -1: poor
Facilities of public
space
Variety and quality of public
furniture and facilities
+1: good; 0: average; -1: poor
Partitions and walls Design of partitions and walls +1: good; 0: average; -1: poor
Electricity poles/lines Style and layout design of electricity
poles/lines
+1: underground; 0: tidy and
above ground; -1: disorderly
and above ground
Security Entrance guard and monitoring +1: strict and formal;
0: average; -1: poor
Instructions and signs Block maps, traffic signs, parking
instructions, etc.
+1: good; 0: average; -1: poor
Car parking Management of car parking +1: good; 0: average; -1: poor
Bicycle parking Management of bicycle parking +1: good; 0: average; -1: poor
Environmental
sanitation
Garbage collection and sweeping +1: very clean; 0: average;
-1: dirty
Maintenance of green
areas
Maintenance of public green areas +1: good; 0: average; -1: poor
Maintenance of
building appearance
Erosion, fading, peeling, etc. +1: none; 0: some; -1: heavy
Pasting and graffiti Scribbles, doodles, stickers +1: none; 0: some; -1: many
Peddlers Management of peddlers in the block +1: good; 0: average: -1: poor
Maintenance of public
facilities
Fitness facilities, dustbins, etc. +1: good; 0: average; -1: poor
Manage
ment (11)
Informal structures Shelters and informal buildings on
balconies, etc.
+1: none; 0: some; -1: many
Information exchange Community bulletin board +1: good; 0: average; -1: poor
Commun
ity (2)
Community
atmosphere
Atmosphere of coexistence and
communication
+1: good; 0: average; -1: poor
Neighboring service
facilities
Continuity of shopping and service
facilities, etc.
+1: integrated; 0: some;
-1: separated
Surrounding
transportation
Influence of noise and pollution +1: none; 0: some; -1: severe
Surrounding building
forms
Conformity in building height, style,
etc.
+1: good; 0: average; -1: poor
Surrounding road
system
Integration of road system with
surrounding blocks
+1: good; 0: average; -1: poor
Openness to
surrounding areas
Style of walls, gates, fences of the
block
+1: open block; 0: semi-open;
-1: completely closed
Surround
ing
relations
hip (6)
Grade difference of
blocks
difference in the quality of adjacent
residential blocks
+1: little; 0: some; -1: large
Table 1. Survey items on the environmental design and management of residential blocks
4. Critical determinants of environmental management
4.1 Factor analysis
Among the data obtained from the site survey, the scores between different indices and
those between different levels of the same index are not linear. In addition, many indices are
Incentives of Environmental Design and Management in Urban Neighborhoods
117
correlated. To obtain the critical factors of environmental management, the 39 indices have
to be summarized. With the method of factor analysis, seven principal components with
eigenvalues above 1 were composed, accounting for 78% of the variance of the 39 indices.
After rotating the eigenvector matrix, seven factors were drawn (Table 2). According to their
correlations with the original indices, we defined them as: (1) planning and design; (2)
contextual fit; (3) property management; (4) conformity of urban design; (5) completeness of
facilities; (6) surrounding influence; and (7) mixture of composition.
4.2 Classification of residential blocks by environmental type
The scores of each residential block were computed on the seven dimensions. Then, a cluster
analysis was conducted with the factor scores. As a result, the 63 residential blocks were
classified into 6 types. Their respective features are shown in Table 3. The average levels of
property management fees were also given. It was found that the property management fee
of type 1 is the lowest (1.05RMB/m
2
per month), followed by types 3, 2, 5, 4. The average fee
of the 6th type is the highest (3.74RMB/m
2
per month). Quality of environmental
management is correlated to property management fees: the fees are higher in residential
blocks with better environments.
1 2 3 4 5 6 7
Factors
Planning
& design
contextual
fit
property
management
conformity
of urban
design
completeness
of facilities
surrounding
influences
mixture of
composition
Elevation
design
0.409 -0.006 0.536 -0.576 -0.180 -0.155 0.153
Architectural
style
0.803 -0.077 0.263 -0.372 -0.036 -0.108 -0.011
Exterior 0.797 -0.002 0.256 -0.220 -0.178 0.085 0.005
Building
management
0.633 -0.011 0.534 -0.238 0.047 0.110 0.278
Ground plane
design
0.772 0.132 0.435 -0.239 0.165 -0.100 -0.059
Barrier-free 0.755 0.237 0.196 -0.328 0.115 -0.085 -0.029
Harmony of
buildings
0.164 0.040 0.364 -0.734 0.006 -0.184 -0.217
Mixing
building ages
0.187 0.152 0.294 -0.202 -0.006 -0.202 -0.765
Mixing
land use
0.012 0.050 0.730 -0.309 0.308 -0.263 -0.093
Road system 0.208 -0.255 0.382 -0.371 0.029 -0.179 -0.503
Road quality 0.697 0.050 0.511 -0.036 -0.070 -0.092 -0.132
Open space 0.001 -0.188 0.676 -0.066 0.263 -0.192 -0.226
Central park 0.116 -0.432 0.075 -0.104 0.673 0.217 -0.026
Waterscape 0.299 0.088 -0.074 -0.378 0.392 0.010 -0.102
Garden 0.794 -0.202 0.193 0.081 0.287 -0.107 -0.193
Details 0.788 -0.320 0.040 -0.076 0.058 -0.201 -0.111
Sight focus 0.814 -0.186 -0.089 -0.047 0.197 0.034 -0.091
Environmental Management
118
1 2 3 4 5 6 7
Factors
Planning
& design
contextual
fit
property
management
conformity
of urban
design
completeness
of facilities
surrounding
influences
mixture of
composition
Facilities of
public space
0.369 -0.323 0.235 -0.001 0.661 0.229 -0.008
Partitions and
walls
0.748 -0.219 0.149 0.030 -0.133 -0.300 -0.140
Electric
poles/lines
0.634 -0.496 0.345 -0.091 -0.045 0.113 -0.072
Security 0.734 -0.015 0.460 -0.208 -0.021 -0.057 -0.105
Instructions
and signs
0.738 -0.292 0.345 0.085 0.056 0.231 -0.268
Car parking 0.332 0.061 0.705 -0.242 -0.224 -0.041 -0.224
Bicycle parking 0.597 -0.147 0.615 -0.112 0.271 -0.061 0.031
Environmental
sanitation
0.383 -0.514 0.560 0.178 0.058 -0.090 -0.316
Maintenance of
green areas
0.615 -0.385 0.409 0.087 0.053 0.128 -0.110
Maintenance of
building
appearance
0.459 -0.168 0.677 -0.222 0.006 0.195 -0.130
Pasting and
graffiti
0.433 -0.032 0.520 -0.291 -0.046 0.164 -0.507
Peddlers 0.211 0.149 0.867 -0.196 -0.051 -0.003 -0.082
Maintenance of
public facilities
0.288 0.031 0.817 -0.060 0.044 0.052 -0.037
Informal
structures
0.238 -0.190 0.777 -0.099 0.063 0.045 -0.109
Information
exchange
0.285 -0.383 0.403 0.222 0.349 0.199 -0.235
Community
atmosphere
-0.223 -0.117 0.056 0.164 0.767 -0.288 0.095
Neighboring
service facilities
0.259 -0.813 0.180 -0.005 0.074 -0.128 0.105
Surrounding
transportation
0.247 -0.056 0.066 -0.175 -0.026 -0.759 -0.171
Surrounding
building forms
-0.032 -0.395 0.166 -0.776 0.063 -0.104 -0.193
Surrounding
road system
0.122 -0.881 -0.138 -0.170 0.116 -0.008 0.041
Openness to
surrounding
areas
0.398 -0.177 0.295 -0.616 -0.130 0.125 0.000
Grade
difference of
blocks
-0.056 -0.849 -0.082 -0.122 0.247 0.013 -0.038
Table 2. Factor analysis of evaluation indices
Incentives of Environmental Design and Management in Urban Neighborhoods
119
Type Features
Property
management fee
(RMB/m
2
per
month)
Sample
size
1
• Old multi-story and high-density residential blocks
• Dull planning and design, consisting mostly of 6-story
row buildings
• Lack of basic management, with significantly worse
environment than surrounding residential areas
• Mature communities with a pleasant living atmosphere
1.05 8
2
• Middle-density and large scale residential blocks mainly
developed in the early 1990s
• Satisfactory property management
1.44 5
3
• Middle-density blocks mixed with buildings of various
types and ages
• Unharmonious environment with intensively mixed
building types and land use
• Average property management quality
• Big difference with surrounding residential areas
1.24 21
4
• Middle- and high-density new commercial housing
blocks
• High-quality planning and design
• Good environmental management system
2.38 20
5
• Middle-density residential blocks mostly developed
around the year 2000
• Formal property management
• Good sense of community
1.95 1
6
• High-end and small-scale new blocks
• Highly closed, entrance permission strictly controlled
• Superior environment
• Lack of community atmosphere
3.74 8
Table 3. Types of residential blocks with environmental characteristics
5. Economic values of environmental management
5.1 A hedonic approach
Many studies have focused on the economic value of residential environments, defined as
the willingness of residents to pay for the improvement of their residential environments. In
practice, this is often examined using a contingent valuation approach (Willis & Garrod,
1993; Tyrvainen & Vaananen, 1998) or by identifying the implicit prices of environments
using a hedonic regression approach (McLeod, 1984; Tyrvainen, 1997; Geoghegan, 1997;
Tyrvainen & Miettinen, 2000).
Here, a hedonic approach is adopted to examine the impact of residential environments on
housing prices. By assumption, the quality of residential environments may affect the prices
of houses. In a well-functioning market, this effect is fully capitalized in market prices.
Utility-maximizing households will purchase houses so that their willingness to pay for a
marginal increase in the residential environment equals its marginal price, i.e. its hedonic
price. In equilibrium, the hedonic price can be interpreted as the willingness of a household
to pay for the residential environment (Cheshire and Mills, 1999; Boardman et al., 2001).
Environmental Management
120
Therefore, the marginal effect of residential environments can be obtained by regression on
the market prices of housing, which implies the benefit and cost to households.
5.2 Variable of environmental management
The categorical variable of environmental management type of residential blocks shown in
Table 3 was used as the indicator of environmental management. Although the factor scores
of the residential blocks constitute a more straightforward indicator of environmental
quality, they are constrained by property management fees. In order to maximize their
utility, households will choose an equilibrium point between satisfactory environmental
management and an appropriate property management fee. Because the variable of
environmental management type already takes the property management fee into account,
it is more suitable for the hedonic regression analysis.
5.3 Hedonic housing price model
In practice, the supply of new commercial housing is less than the demand. To avoid sample
bias caused by an incomplete market, the previously-owned housing market was taken as
the sample. Through Beijing Housing Information Network, a search for previously-owned
housing for sale within the 63 residential blocks in May 2006 yielded 460 matches. After
confirming the lowest prices and concrete conditions of each listing with real estate agencies
by phone, a final sample of 279 valid items was obtained.
The data included price (provided by real estate agencies), housing size, room type, building
type, direction (the direction of main rooms), building age, interior finishing level, floors,
etc. Detailed information on the location and land use of the residential blocks was collected
from urban real estate statistics and GIS data, including the floor-to-area ratio, green
coverage ratio, household density, and the distance to the nearest subway station, school,
hospital, and to the boundary of Olympic facilities (including Asian Sports Village, Olympic
Green Center, and National Forest Park).
A simple linear model was established:
0
1
/
m
ii
i
PindoorS a a x
ε
=
=
+×+
∑
(1)
where P/indoorS is the indoor size-based unit price of apartments, a
0
is a constant term, x
i
(for
i=1 to m) indicates the i-th attribute, a
i
is the coefficient to be estimated, and ε is an error
term. For the clarity of interpretation, the specification of the simple linear form was
preferred and it was proven to be satisfactory compared with other forms, such as the
logarithm model and semi-logarithm model. Table 4 gives the results of the stepwise
regression.
To improve the model, the assumptions of independent variables were carefully studied,
and some of the variables were transformed. For example, building age was transformed to
ln(building age), assuming that its effect on the unit price decreases as the buildings age. To
capture the non-linear effect on the unit prices, the variables housing size, building scale, and
household density were transformed to categorical forms. The coefficient of 1/indoorS reveals
the costs of kitchen and toilet facilities, which are stable regardless of house size. Housing
size S was transformed to discrete variables in order to identify the nonlinear effect of
housing size on unit price.
Incentives of Environmental Design and Management in Urban Neighborhoods
121
Term Estimate Std Error t Ratio Prob>|t| Interpretation
Intercept 12.423 0.662 18.77 0.000
Building type[row-type] -0.317 0.082 -3.89 0.000
Row-type, -0.317;
tower type, +0.317
Direction{W&E-NW&S&NE&SW&SE} -0.173 0.101 -1.71 0.089 W and E, -0.173
Direction{NW&S&NE&SW-SE} -0.160 0.115 -1.39 0.165 NW, -0.185
Direction{NW-S&NE&SW} -0.199 0.196 -1.01 0.312 NE, -0.205
Direction{S&NE-SW} 0.003 0.117 0.02 0.980 SE, +0.332
Direction{S-NE} 0.419 0.134 3.14 0.002 SW, +0.209
S, +0.63
Environmental management{3&1&6-5&2&4} -0.531 0.069 -7.66 0.000 Type {1,3,6}, -0.531
Environmental management{5&2-4} -0.336 0.131 -2.56 0.011 Type {2, 5}, +0.195
Type {4}, +0.867
Green coverage ratio
0.029 0.008 3.79 0.000
+1% of green space in
block, +0.029
Distance to school
-1.005 0.480 -2.09 0.037
Distance from block
center to nearest school
+1km, -1.005
ln(building age)
-0.843 0.147 -5.72 0.000
Building age (year)
increase by e times,
-0.843
1/indoors
57.407 26.797 2.14 0.033
1/(indoor size (m
2
))
+1, +57.407
S{(0,80)-[80,190)} 0.068 0.259 0.26 0.793 S<50, -0.311
S{(0,60)-[60&80)} 0.053 0.154 0.34 0.732 S€[50-60), +0.554
S{(0,50)-[50,60)} -0.433 0.214 -2.02 0.044 S€ [60-80), +0.015
S{[80,190)-[190,220)} 0.731 0.344 2.13 0.034 S€ [80-190), +0.610
S≥190, -0.731
Distance to subway station
-0.393 0.041 -9.51 0.000
Distance from block
center to nearest subway
station +1km, -0.393
Distance to Olympic park
-0.747 0.080 -9.31 0.000
Distance from block
center to Asian Sports
Village, Olympic Green,
or National Forest Park
+1km, -0.747
Building scale {>300} -1.012 0.247 -4.10 0.000
Average building scale
in block >300 units,
-1.012; ≤300 units,
+1.012
Household density {≥120} 0.342 0.143 2.39 0.018
Household density of
block ≥120 units/ha,
+0.342; <120, -0.342
R
2
=0.629, Adj. R
2
=0.601
Table 4. Regression model on unit price* (thousand RMB/m
2
)
Environmental Management
122
The model in Table 4 has 12 independent variables, all being significant. They accounted for
62.9% of the total variance of housing prices. Multi-collinearity tests showed that the 12
variables had no strong correlations. Regression tests that randomly neglected different
variables demonstrated that the estimates and significance levels of the remaining variables
were stable. These tests implied that the estimates of Table 4 were accurate.
The coefficients of the 12 variables give the marginal prices of each variable. Significant
structural attributes of housing price include building type, direction, and ln(building age). The
effects of location variables on housing prices were strong, including distance to school,
distance to subway station, and distance to Olympic park. green coverage ratio had a positive effect
on housing prices. In addition, the negative coefficients of building scale and household density
revealed the cost of dwelling density.
An important finding is that environmental management had a significant effect on prices.
Among the six types, type 4 was valued the highest (867 RMB/m
2
above average), followed
by types 2 and 5 (both 195 RMB/m
2
above average). In contrast, the values of types 1, 3, and
6 were much lower (531 RMB/m
2
below average).
Looking at Table 3, the results can be interpreted. Blocks belonging to type 4 were
developed in recent years with up-to-date concepts of environmental design and
management; Types 2 and 5 were built earlier but were maintained well through good
management. Blocks belonging to types 1 and 3 were unfavorable due to management
deficiencies. Type 6 blocks had superior environments, but residents’ willingness-to-pay
was low because the property management fees were excessively high. This fact suggests
that high environmental quality of residential blocks is desirable only if the management fee
is reasonable.
6. Discussion of the results
6.1 Critical factors of residential environments
Table 2 reveals that the principal factors of residential environments in residential blocks
are: (1) planning and design; (2) contextual fit; (3) property management; (4) conformity of
urban design; (5) completeness of facilities; (6) surrounding influences; and (7) mixture of
composition. Planning and design, contextual fit, and property management are the most
important factors of environmental quality.
The important indices related to the planning and design of residential buildings are:
Architectural style; Exterior; Ground plane design; Barrier-free design of buildings; Garden;
Detail; Partitions and walls; and Instructions and signs. In a sense, these are the
comprehensive planning and design concepts of modern residential blocks. In practice,
these planning and design factors have often been neglected in older traditional residential
blocks, leading to low environmental quality. In contrast, commercial housing
developments from the late 1990s have emphasized these aspects.
Contextual fit is another important factor for judging the quality of residential
environments. It reflects the problems associated with a lack of consideration of residential
areas in their entirety, their non-proximity to and lack of correspondence with neighboring
blocks, and a large contrast in landscapes and environmental grades. In practice, there are
many newly developed residential blocks which are completely closed off from one another.
Due to the need for these residential compounds to have individualized identities, the
context of the area as a whole is totally neglected. At the same time, new urban poverty
Incentives of Environmental Design and Management in Urban Neighborhoods
123
areas are being formed because of the environmental deterioration of old neighborhoods.
These issues must be addressed in the environmental management of urban areas.
The role of property management is important in residential blocks. Specifically, the key
factors are: Regulations on incompatible land use; Management of car parking and peddlers;
Maintenance of public facilities; and Control of informal buildings. Enhancing management
of the above aspects will effectively improve the environments of residential compounds.
6.2 Incentives of environmental management
The marginal prices of environmental management obtained from the linear regression
model revealed the benefits of environmental management. According to Table 3, the values
of the same kinds of houses can differ by up to 1359 RMB/m
2
(852+507) due to differences
in environmental management alone.
It is highly valuable to know that appropriate environmental management can significantly
increase the economic values of existing residential blocks. Residential blocks of
environmental management types 1, 3, 2, and 5 might also enjoy this benefit by improving
landscape design, maintaining greenery, providing suitable facilities, and improving
sanitation, parking, and security in the compounds. These kinds of improvements are highly
feasible for existing residential blocks. The clarification of the benefits generates the
incentives for existing areas to adopt an effective environmental management system.
The result that the values of environmental management types 1, 3, and 6 are significantly
lower than the values of other types is also noteworthy. A common feature of these blocks is
that their environmental qualities are quite different from the surrounding areas: Types 1 and
3 are worse than the surrounding areas, while Type 6 is much better. The regression results
imply that non-conforming landscapes and environments may reduce the value of residential
blocks; that is, landscape and environmental gaps have a negative external effect on urban
environments. Therefore, it is necessary to promote holistic urban planning and design.
6.3 Appropriate levels of property management fees
The variable of environmental management type was used with the hedonic regression
model instead of the absolute quality of environments because the latter is constrained by
property management fees. This strategy was proven to be correct by the regression results.
In fact, the marginal price of residential blocks of environmental management type 6, where
the environmental quality is the best and the property management fee is the highest, was
507RMB/m
2
lower than the average level.
A satisfactory residential block should not only have effective environmental management;
its level of property management fees should also be reasonable. As shown in Table 3,
the property management fees in residential blocks with environmental management types
2, 4, and 5 (where the benefits are higher than the average level) are 1.44 RMB/m
2
,
2.38 RMB/m
2
, and 1.95 RMB/m
2
per month, respectively. In the current market, it appears
that the preferential level of property management fees should be 1.5-2.5 RMB/m
2
per
month.
7. Conclusions
This chapter has explored the critical factors in the environmental management of urban
residential areas and clarified the incentives related to urban environmental management
Environmental Management
124
policies. It was determined that planning and design, contextual fit, and property
management are the most critical determinants of the environmental quality of residential
blocks. The level of environmental management has a significant effect on housing prices,
and their marginal prices have quantified the benefits brought by the improvement of
environmental management.
Environmental management also involves many soft aspects which are crucial during the
stages after planning and design. For existing residential areas, this point is extremely
important. It suggests that it is possible to improve the values of properties by
maintaining adequate levels of environmental management, thereby bringing substantial
benefits to residents. In other words, environmental management provides an effective
way to revitalize existing residential areas. It is therefore critically important to introduce
new environmental management systems to save the older neighborhoods from
dilapidation.
In the above analysis, we have also offered suggestions for promoting the contextual fit of
urban areas through planning policies and guidelines for setting an appropriate standard of
property management fees. Despite the fact that the study area is limited to Beijing,
the main implications of this study should be applicable to many other similar urban
areas, though the results of quantitative analysis may differ somewhat depending on the
area.
8. Acknowledgements
This study was funded by the Natural Science Foundation of China (NSFC: 40671063) and
the Ministry of Education, China. Prof. Yasushi Asami, Prof. Tian Chen and Prof. Jiabin Lin
have provided valuable comments. A part of this work was published in Gao, Xiaolu (2007)
Incentives of environmental design and management in residential areas of Beijing, Acta
Geographica Sinica, 62(2), pp. 147-156. (In Chinese)
9. References
Adams, L.W. and Leedy, D.L. (Eds) (1987) Integrating Man and Nature in the Metropolitan
Environment, Columbia MD: National Institute for Urban Wildlife.
Boardman, A., Greenberg, D.H., Vining, A.R. and Weimer, D.L. (2001) Cost Benefit Analysis:
Concepts and Practice (Second Edition), Prentice Hall.
Carter, R.W. and Bramley, R. (2002) Defining heritage values and significance for improved
resource management: an application to Australian tourism. International Journal of
Heritage Studies, 8(3), 175–199.
Chen, F. (2000) Evaluation of urban residential environments and satisfactions. City Planning
Review, 15(4), 20-23. (In Chinese)
Cheshire, P. and Mills, E.S. (1999) Handbook of Regional and Urban Economics,
Amsterdam: Elsevier Science.
Coeterier, J.F. (2002) Lay people’s evaluation of historic sites. Landscape and Urban Planning,
59(2), 111-123.
de Haas, W., Kranendonk, R. and Pleijte, M. (1999) Valuable man-made landscapes (VMLs)
in the Netherlands: a policy evaluation. Landscape and Urban Planning, 46, 133-141.
Incentives of Environmental Design and Management in Urban Neighborhoods
125
Geoghegan, J., Wainger, L.A. and Bockstael, N.E. (1997) Spatial landscape indices in a
hedonic framework: an ecological economics analysis using GIS. Ecological
Economics, 23, 251-264.
Gómez-Sal, A., Belmontes, J.A. and Nicolau, J.M. (2003) Assessing landscape values: a
proposal for a multidimensional conceptual model. Ecological Modelling, 168(3), 319-
341.
Groat, L. (1984) Public opinion of contextual fit. Journal of American Institute of Architects, 73,
72-75.
Hua, H. (1999) The assessment of environment quality in old urban residential areas.
Environmental Protection, 6, 26-28. (In Chinese)
İpekoğlu, B. (2006) An architectural evaluation method for conservation of traditional
dwellings. Building Environment, 41(3), 386-394.
Jim, C.Y. (2004) Green-space preservation and allocation for sustainable greening of compact
cities. Cities, 21(4), 311-320.
Li, W.M. and Ye, X.Y. (1999) The assessment of urban human settlements, Economic
Geography, 19(2), 38-43. (In Chinese)
Li, X.M. and Li, J.H. (2006) Analysis of urban space in Dalian. Acta Geographica Sinica, 61(8),
809-817. (In Chinese)
Lichfield, N. (1998) Economics in Urban Conservation, Cambridge University Press.
McLeod, P.B. (1984) The demand for local amenity: a hedonic price analysis. Environment
and Planning A, 16, 389-400.
Murtagh, W.J. (1997) Keeping Time: The History and Theory of Preservation in America
(Revised edition), John Wiley & Sons Inc.
Ning, Y.M. and Cha, Z.Q. (1999) A study on urban human settlements assessment and
optimization measures. City Planning Review, 23(6), 15-20. (In Chinese)
Prato, T. (2000) Multiple attribute evaluation of landscape management. Journal of
Environmental Management, 60(4), 325-337.
Tyrvainen, L. (1997). The amenity value of the urban forest: an application of the hedonic
pricing method. Landscape and Urban Planning, 37, 211-222.
Tyrvainen, L. and Miettinen, A. (2000) Property prices and urban forest amenities. Journal of
Environment and Economic Management, 39, 205-223.
Tyrvainen, L. and Vaananen, H. (1998) The economic value of urban forest amenities: an
application of the contingent valuation method. Landscape and Urban Planning, 43,
105-118.
Wang, M.J., Zhang, X.X. and Zhang, W.Z. (2002) An evaluation of spatial structure of urban
residential environment in Dalian based on a local resource model, 21(6), 753-762.
(In Chinese)
Willis, K.G. and Garrod, G.D. (1993) Valuing landscape: a contingent valuation approach.
Journal of Environmental Management, 37(1), 1-22.
Wu, S.X. et al. (1995) Evaluation of factors affecting the living and environmental quality of
resident areas. Acta Scientiae Circumstantiae, 15(3), 354-362. (In Chinese)
Wu Z.Q. et al. (2003) Evaluation System of Sustainable Human Settlements in China, Beijing:
Science Press. (In Chinese)
Environmental Management
126
Xie, R.Z. (1997) Comprehensive evaluation of the environmental quality and the
sustainability of urban residential areas in China. City, 03, 38-40. (In Chinese)
Zhang, W.Z., Liu, W. and Meng, B. (2004) A study on location advantage value of residential
environment in urban and suburban Beijing. Acta Geographica Sinica, 60(1), 115-121.
(In Chinese)
6
Leadership Development
and Management of Environmental
Non-Governmental Organizations
Koushen Douglas Loh
Texas A&M University
United States of America
1. Introduction
The Overview section depicts the emerging power and the role of the 3
rd
Sector in general
and environmental non-governmental organizations or NGOs in particular in advancing
environmental causes. A history of their coming-into-being and their evolution triggered by
“Silent Spring” is introduced. Possible future role of environmental NGOs in effecting
changes toward a better environment is discussed. This section sets the tune for further
elaborations on how an environmental NGO may best develop its structure, leadership,
programs and management scheme.
1.1 Historical background
"Non-governmental organizations" or NGOs, as we know them today are generally thought
to have come into existence in then industrialized European countries and in the United
States around the mid-nineteenth century (WANGO, 2008). In the United States, Founded in
1892, Sierra Club is probably the oldest NGO with an environmental focus in the States. A
century or so later the importance of NGOs was officially recognized by the United Nations
(UN). The term came into use in 1945 by UN to differentiate in its Charter between
participation rights for intergovernmental specialized agencies and those for international
private organizations (Mostashari, 2005). At the UN Congress in San Francisco in 1968, a
provision was made in Article 71 of the Charter of the United Nations framework that
qualified NGOs in the field of economic and social development to receive consultative
status with the Economic and Social Council. At the UN, virtually all types of private bodies
can be recognized as NGOs. They only have to be independent from government control,
not seeking to challenge governments either as a political party or by a narrow focus on
human rights, non-profit-making and non-criminal.
The non-profit-making qualifier is an important attribute of NGOs. Often they are also
referred to as Non-Profit Organizations or NPOs. NGOs or NPOs are regarded as a force for
good by virtually all nations in the world. As a whole, they are considered as the “Third
Sector,” while the government and the private sector are the 1
st
and the 2
nd
sector,
respectively. Their unique role is usually recognized and defined legally in a country they
operate in. For example, those who qualify and meet specific requirements stipulated by the
Internal Revenue Service (IRS) of the Untied States are typically called the 501 (c) (3)
Environmental Management
128
organizations. A 501 (c) (3) entity has a tax-exempt status, a privilege that allows it to
dispense its financial resources to do more good to the society. Qualified activities include:
Religious, Educational, Charitable, Scientific, Literacy, Testing for Public Safety, to Foster
National or International Amateur Sports Competition, and Prevention of Cruelty to
Children or Animals (IRS, 2008). Virtually all reputable NGOs with an environmental focus,
or Environmental NGOs for short, in the United States, are registered with the U.S.
government as 501 (c) (3) entities. Examples include the Natural Resources Defense Council,
the Environmental Defense Fund, and the Sierra Club, just to name a few.
Recent decades have seen an increase in the number, role, and functions of environmental
NGOs. The one, single most notable watershed event took place in 1962 when Rachel
Carson published “Silent Spring.” Her book depicted how destructive such chemicals as
DDT are to the environment. Her alarm touched off a national debate in the United States. It
set in motion set in motion a course of events that would resulted in the ban of domestic
production of DDT in 1964 and the creation of a grass-roots movement demanding
protection of the environment through state and federal regulation. Carson’s writing
initiated a transformation in the relationship between humans and the natural world and
stirred the awakening of public environmental consciousness (Carson et al., 2002). Her
inspiration triggered the sprouting of many environmental NGOs, e.g. the coming-into-
being of the Environmental Defense Fund in 1967 and the Natural Resources Defense
Council in 1970. These and other NGOs have become champions for the environment.
1.2 Post “Silent Spring” era: the character defining moment of the environmental
NGOs
Today, environmental NGOs are playing increasingly vital roles in directly impact and
influence environmental issues on the international, national, and local levels. The
environment emerged as a new critical international issue in the 1970s. Concerns such as the
depletion of natural resources, climate change, and harmful pollutants began to gain
awareness in the public’s mind. In the United States, the environmental movement emerged
from incidents and individuals reacting to governments who might be slow, unable or
unwilling to address issues and problems. The long and winding road toward the “Clean
Air Act” typifies how the environmental movement in general and the NGOs in particular
have been defined their unique character – environmental advocacy.
In 1923, leaded gasoline was introduced to the market to enhance engine performance of
automobiles. Although the harmful effects of lead to health are increasingly recognized,
auto makers fight mandatory emissions control for their cars. In 1967, Congress finally
passed a bill called “Air Quality Bill of 1968,” the first federal legislation aimed at reducing
pollution. Without setting standards, imposing hard deadlines, and providing enforcement,
though, it failed to accomplish its goals. It was, however, a good first step that provided a
framework for more effective legislation down the pipeline.
In 1970, Senator Gaylord Nelson (D-WI, 1963-1981) found inspiration in the 1969 anti-war
movement and proposed a large-scale demonstration on behalf of the environment. He
organized and founded Earth Day, the first mega-scale grassroots environmental rally. On
April 22, 1970 millions of participants across the country simultaneously voiced their
environmental concerns. The idea was big enough to make headlines across the country in
major news outlets, which report on the planned event in the preceding months. A
masterpiece was the one printed on the New York Times, which reads: “Rising concern
about the environmental crisis is sweeping the nation's campuses with an intensity that may