Health and Quality of Life Outcomes BioMed Central Research Open Access Changes in health-related doc
Bạn đang xem bản rút gọn của tài liệu. Xem và tải ngay bản đầy đủ của tài liệu tại đây (272.19 KB, 9 trang )
BioMed Central
Page 1 of 9
(page number not for citation purposes)
Health and Quality of Life Outcomes
Open Access
Research
Changes in health-related quality of life from 6 months to 2 years
after discharge from intensive care
Reidar Kvale* and Hans Flaatten
Address: Department of Anaesthesia and Intensive Care, Haukeland University Hospital, N-5021 Bergen, Norway
Email: Reidar Kvale* - ; Hans Flaatten -
* Corresponding author
Abstract
Background: Intensive care patients have, both before and after the ICU stay, a health-related
quality of life (HRQOL) that differs from that of the normal population. Studies have described
changes in HRQOL in the period from before the ICU stay and up to 12 months after. The aim of
this study was to investigate possible longitudinal changes in HRQOL in adult patients (>18 years)
from 6 months to 2 years after discharge from a general, mixed intensive care unit (ICU) in a
university hospital.
Methods: This is a prospective cohort study. Follow-up patients were found using the ICU
database and the Peoples Registry. HRQOL was measured with the Short Form 36 (SF-36)
questionnaire. Answers at 6 months and 2 years were compared for all patients, surgical and
medical patients, and different admission cohorts.
Differences are presented with 95% confidence intervals. The SF-36 data were scored according
to designed equations. SPSS 11.0 was used to perform t-tests and Mann-Whitney tests.
Results: A total of 100 patients (26 medical and 74 surgical) answered the SF-36 after 6 months
and again after 2 years. There was overall moderate improvement in 6 out of 8 dimensions of the
SF-36, and the average increase in score was + 4.0 for all 8 dimensions. The changes for surgical
and medical patients were similar. Neurological and respiratory patients reported increased
average HRQOL scores, while cardiovascular patients did not. Patients with worsening of scores
from 6 months to 2 years were insignificantly older than patients with improved scores (55.3 vs.
49.7 years), and both groups had comparable severity scores (simplified acute physiology score,
SAPS II, 37.2 vs. 36.3) and length of ICU stay (2.7 vs. 3.2 days). The statistically significant changes
in HRQOL (in the Role Physical and Social Functioning dimensions) were, due to sample size, barely
clinically relevant.
Conclusion: In a mixed ICU population we found moderate increases in HRQOL both for medical
and surgical patients from 6 months to 2 years after ICU discharge, but the sample size is a
limitation in this study.
Background
Intensive care patients have a higher mortality than the
normal population up to 1–2 years after ICU discharge,
but from that time further survival is comparable [1–3].
Health-related quality of life (HRQOL) is an important
outcome measure after intensive care. A number of
Published: 24 March 2003
Health and Quality of Life Outcomes 2003, 1:2
Received: 28 February 2003
Accepted: 24 March 2003
This article is available from: />© 2003 Kvale and Flaatten; licensee BioMed Central Ltd. This is an Open Access article: verbatim copying and redistribution of this article are permitted in
all media for any purpose, provided this notice is preserved along with the article's original URL.
Health and Quality of Life Outcomes 2003, 1 />Page 2 of 9
(page number not for citation purposes)
questionnaires have been introduced to investigate HR-
QOL [4,5]. Results are found to be influenced by diagno-
sis, severity of illness, age and pre-morbid health status
[6,7]. Quality of life studies are often difficult to compare,
since different intensive care populations have been stud-
ied and a variety of quality of life measures have been
used, at different times after ICU discharge. In addition,
the practice of intensive care varies [8].
In general post-ICU HRQOL is found to be markedly re-
duced compared with population scores [9–14]. Several
studies have found changes in HRQOL from before ICU
and up to 6 or 12 months after, with worsening for pa-
tients suffering acute pathologies (i.e. predominantly sur-
gical patients) and improvement or no change for patients
with pre-existing ill health (i.e. predominantly medical
patients) [6,7,15–18].
It has been suggested that follow-up after ICU discharge
should last until further survival match population surviv-
al (after 2 years) and that simultaneous longitudinal
changes in HRQOL can be a measure of effectiveness of re-
habilitation and rate of recovery [19]. Few such studies
have been performed. The aim of this study was to use the
Short Form 36 (SF-36) [20] questionnaire to investigate
possible longitudinal changes in HRQOL from 6 months
to 2 years after ICU discharge in a general, mixed ICU
population. Our hypothesis was that average HRQOL
would improve from 6 months to 2 years after discharge.
Methods
Haukeland University Hospital is a 1000-bed tertiary re-
ferral hospital for 900 000 inhabitants in Western Nor-
way. The 10-bed mixed ICU is predominantly surgical
(70% of admissions). Heart surgery patients, neonates
and burn patients are treated in specialized units outside
the ICU. All ICU admissions are recorded in a database.
Approximately 360 patients are admitted annually, with
an average age of 49.5 years and an average ICU length of
stay (LOS) of 5.0 days. Hospital mortality from 1997 to
2001 has been in the range of 28% to 32%. The main rea-
son for ICU admission is chosen from 8 categories: neuro-
logical, respiratory, cardiovascular, gastrointestinal,
postoperative, renal failure, trauma and miscellaneous.
SAPS II is used for severity scoring.
Adults (>18 years) with an ICU stay of more than 24
hours who were discharged between July 1999 and August
2000 were eligible to enter this prospective study. The
Peoples Registry of Norway (Folkeregisteret) was used to
identify survivors 6 months after ICU discharge. These
were sent the SF-36 questionnaire with an information
letter. The responders were sent the questionnaire again
two years after ICU discharge. Non-responders received
one reminder.
The SF-36 is a generic, self-administered general health
status survey with 36 questions aggregated into 8 do-
mains/dimensions: General health (GH), Physical Func-
tioning (PF), Role Physical (RP), Role Emotional (RE),
Social Functioning (SF), Bodily Pain (BP), Vitality (VT)
and Mental Health (MH). Each is scored from 0 (worst
score) to 100 (best score). It has been tested and found
both valid and reliable in the ICU setting [21], and is one
of the recommended outcome measures [5]. The SF-36
has also been found to be stable over time [22].
SF-36 scores after 6 months were compared with scores af-
ter 2 years for a) all patients, b) medical patients, c) surgi-
cal patients and d) the 3 largest admission categories
(neurological, respiratory and cardiovascular). We also
compared the SF-36 scores after 6 months for the 26 pa-
tients who answered only once with the 100 patients who
answered again after 2 years.
There is no overall SF-36 score, but Mental Component
Summary (MCS) and Physical Component Summary
(PCS) have been used [13,23]. In this study we chose to
summarize the 8 dimension scores for each patient after 6
months and compare the sum with the individual sums
after 2 years, thus dividing patients into one group with
unchanged or reduced "total score" and another with in-
creased "total score". These 2 groups were compared, as
were medical and surgical patients, to see if there were dif-
ferences with respect to age, severity of illness (SAPS II),
length of ICU stay (LOS) and intermittent positive pres-
sure ventilation (IPPV) times. All age data refer to age at
ICU admission.
The study was approved by the regional ethical
committee.
Statistical methods
Continuous and discrete data (when appropriate) are giv-
en as mean values with standard deviations (SD) and me-
dian values with range. Differences between groups are
presented with the corresponding 95% confidence inter-
vals. The SF-36 data were collected in a FileMaker 5.0 da-
tabase and automatically scored using previously
published equations [24]. SPSS 11.0 was used to perform
t-tests and paired t-tests for SF-36 scores. The results were
controlled with Wilcoxon signed rank sum test. The
Mann-Whitney test was used for skewed continuous data.
Results
Included patients
In the study period a total of 226 patients above 18 years
and with an ICU stay of more than 24 hours were dis-
charged alive from the ICU. Four were in the ICU for pure
observational reasons, 31 died within 6 months after ICU
discharge, 9 were lost to follow-up, 126 answered the SF-
Health and Quality of Life Outcomes 2003, 1 />Page 3 of 9
(page number not for citation purposes)
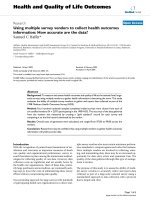
36 questionnaire and 56 did not answer. Two years after
ICU discharge, another 14 patients of the 126 responders
had died, one had moved abroad and 11 did not answer
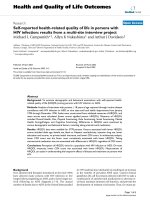
the SF-36 for the second time (Figure 1). The 11 patients
who did not answer after 2 years had a mean age of 42.2
years, and the 14 patients who died between 6 months
and 2 years had a mean age of 61.8 years. The 100 patients
(100%) who responded for the second time were 60
males and 40 females, of whom 26 were medical and 74
surgical ICU patients.
Age, severity, LOS, diagnostic category
There were no statistical significant differences in age,
SAPS II severity scores, LOS and ventilator time (IPPV) be-
tween the medical and the surgical patients, or between
patients with increased or decreased summarized dimen-
sion scores (Table 1).
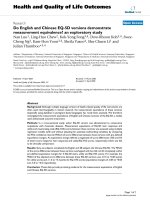
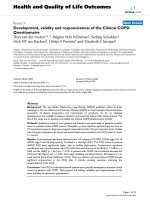
The distribution of individual changes in summarized SF-
36 scores was close to the Normal distribution, with 92%
of the changes being inside the interval from - 200 to +
250. The average increase in summarized score was 24
(Figure 2).
The changes in different dimensions showed good corre-
lation with changes in total score (no patients had at the
same time large increases in some dimensions and large
decreases in others). The diagnostic category distribution
for the 100 study patients (in bold) at the time of admis-
sion was quite similar to the distribution of all patients (in
parenthesis) discharged from the ICU in the same period:
25% (25.6%) neurological, 24% (21.8%) respiratory,
18% (15.4%) cardiovascular, 12% (12.2%) gastrointesti-
nal, 10% (10.9%) trauma, 6% (4.2%) postoperative, 2%
(3.2%) renal failure and 3% (6.7%) miscellaneous.
Figure 1
Follow-up status at 2 years for the 126 patients answering the SF-36 at 6 months after ICU discharge.
SF-36 answers
2 years after ICU
discharge
n = 100
Died between
6 months and
2 years
n = 14
No answer
after 2 years
n = 11
Lost to 2-year
follow-up
(moved abroad
)
n = 1
SF-36 answers
6 months after
ICU discharge
n = 126
Health and Quality of Life Outcomes 2003, 1 />Page 4 of 9
(page number not for citation purposes)
Changes in Short Form 36 scores
Table 2 shows the average SF-36 scores after 6 months and
2 years, with 95% confidence intervals for the differences,
for all patients and the surgical and medical cohort. There
was an increase in 6 out of 8 dimensions for the whole
group, but significant only for Role Physical (borderline)
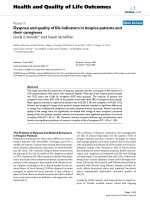
and Social Functioning (see also Figure 3). Medical and
surgical patients had the same pattern of changes. Moreo-
ver, the absolute dimension scores were also quite similar
for medical and surgical patients, except for higher scores
in the Physical Functioning and Role Physical dimensions
for medical patients.
The 26 patients that did not answer for the second time
(after 2 years) had lower scores after 6 months in all 8 di-
mensions, significant for 3 dimensions and borderline
significant for 2, when compared with the 100 included
patients.
The changes in SF-36 scores for the 3 largest diagnostic
categories (representing 67% of all patients) showed im-
provement for respiratory and neurological patients, but
not for cardiovascular patients (Table 3). There was a gen-
eral increase in Social Functioning (significant only for
respiratory patients) and Role Physical scores (significant
only for neurological patients). All other changes were
non-significant, but General Health and Physical Func-
tioning scores decreased in cardiovascular patients and in-
creased in respiratory and neurological patients. All 3
categories show increases in Vitality scores and reductions
in Mental Health scores.
Discussion
In this study we used the SF-36 questionnaire to measure
changes in HRQOL from 6 months to 2 years after ICU
discharge for 100 former ICU patients. We found general
improvement in most dimensions, but significant im-
provement only for Social Functioning and Role Physical.
The changes in HRQOL did not differ much between sur-
gical and medical patients. There were differences be-
tween the ICU admission categories: neurological and
respiratory patients experiences improved HRQOL, while
cardiovascular patients did not. We found no significant
differences concerning age, severity of illness, LOS and
IPPV times between medical and surgical patients, or be-
tween patients with increased summarized SF-36 dimen-
sion scores and patients with reduced scores from 6
months to 2 years. Patients who did not answer after 2
years had significantly lower scores after 6 months than
the rest. The diagnostic category distribution for study pa-
tients was similar to that of the total number of ICU
patients.
The interval from 6 months to 2 years after ICU discharge
was chosen because there is little data on changes in HR-
QOL after discharge from the ICU, and we wanted to in-
vestigate changes up to the time where further survival
parallels population survival. Studies of HRQOL have
been performed at 3 months [25], 6 months [15,10], 12
months [16,6,1] and longer after intensive care [3,26].
Several studies have shown that HRQOL scores at 6 and
12 months after ICU are similar to pre-ICU scores for pa-
tients with pre-existing ill health, while patients suffering
acute pathologies have lower scores than pre-ICU scores
[6,7,15–18]. Functional outcome has been found to
Table 1: Age, severity, LOS, IPPV days Mean values for age and SAPS II and median values for *LOS and **IPPV days (hours/24).
Comparison of medical and surgical ICU patients, and of ICU patients with increasing and patients with decreasing summarized SF-36
scores from 6 months to 2 years after ICU discharge. Differences between the groups are shown with corresponding 95% confidence
intervals (CI) or p-values (the Mann-Whitney test).
No Mean age, years (SD) Mean SAPS II (SD) Median LOS, days
(range)
Median IPPV, days
(range)
All included 100 51.9 (16.4) 36.7 (13.4) 3.0 (1.0 – 28.9) 1.8 (0.2 – 23.8)
Surgical patients 74 52.1 (15.9) 36.5 (12.5) 3.0 (1.0 – 28.9) 1.9 (0.3 – 23.8)
n = 53
Medical patients 26 51.4 (17.8) 37.1 (16.1) 3.1 (1.0 – 16.4) 1.5 (0.2 – 13.8)
n = 19
Difference 95% CI
and p-values
0.7
-6.6 to 8.0
0.6
-5.4 to 6.6
p = 0.937
a
p = 0.736
a
Reduced SF-364055.3 (17.0) 37.2 (11.5) 2.7 (1.0 – 26.7) 1.8 (0.2 – 18.3)
n = 29
Increased SF-36 60 49.7 (15.7) 36.3 (14.6) 3.2 (1.0 – 28.9) 1.7 (0.3 – 23.8)
n = 43
Difference 95% CI
and p-values
5.6
-1.0 to 12.2
0.9
-4.5 to 6.3
p = 0.353
a
p = 1.0
a
* LOS = length of ICU stay ** IPPV = intermittent positive pressure ventilation
a
Mann-Whitney Test
Health and Quality of Life Outcomes 2003, 1 />Page 5 of 9
(page number not for citation purposes)
improve between 3 and 9 months in mixed cohorts [25],
and between 3 and 12 months for surgical patients [27]. A
number of studies thus indicate that there are no major
changes for medical patients, while surgical patients often
experience marked initial reductions in HRQOL and im-
provement with time. Trauma patients do not reach their
pre-ICU scores during the first or even the second year
[28]. Our data indicate that at 6 months after ICU dis-
charge the HRQOL differ little between medical and sur-
gical patients. One would expect a larger potential for
improvement thereafter in surgical patients. It is therefore
of interest that we find similar changes for medical and
surgical patients in the interval from 6 months to 2 years,
with moderate overall improvement (Table 2). Our find-
ings contrast with a study reporting that mixed patients
stabilize in HRQOL at 6 months after ICU discharge [16].
Functional health status has been found to be reasonable
1 year after ICU for mixed patients [29], but dependent on
diagnostic categories. Markedly reduced HRQOL scores
have been found at 12 months (multiple organ dysfunc-
tion patients), 16 months (sepsis patients) and 18 months
(trauma patients) after ICU [13,14,30]. In contrast, a
study showed better functional outcome than baseline
after 1 year in surgical patients (trauma patients or neuro-
surgical patients not included) [27]. Since few studies
have investigated HRQOL more than once after ICU dis-
charge, we have little data to compare with. Our data in-
dicate that cardiovascular patients have less favorable
long-term changes in HRQOL than respiratory and
neurological patients. We should be careful in drawing
any conclusions here, since our groups are not very large,
Figure 2
Overall changes in summarized SF-36 scores Distribution of individual changes in summarized SF-36 scores (all 8 dimen-
sions) from 6 months to 2 years, shown in intervals of 50 from -500 (maximum decrease recorded) to +400 (maximum
increase recorded). Number of patients within each interval.
Figure 2
SD 147
Mean +24
n = 100
0
2
4
6
8
10
12
14
16
18
20
-500 -450 -400 -350 -300 -250 -200 -150 -100 -50 0 50 100 150 200 250 300 350 400
Change in summarized SF-36 score
Number of patients
Health and Quality of Life Outcomes 2003, 1 />Page 6 of 9
(page number not for citation purposes)
and within the "surgical" and "medical" cohorts there are
clear differences in SF-36 scores between subgroups [14].
The 26 patients who were lost to follow-up at 2 years had
significantly lower SF-36 scores than the rest at 6 months
(Table 2). The 14 patients who died between 6 months
and 2 years were older (average 61.8 years), and the 12
others who did not answer for the second time were
younger (average 43.3 years) than the 100 study patients
(average 51.9 years).
Our division of patients into groups with increased and
decreased summarized SF-36 scores is arguable. Patients
with very high or very low scores at 6 months can hardly
be expected to experience higher or lower scores, respec-
tively, at 2 years. We compared these groups, nevertheless,
because the individual changes show a typical normal dis-
tribution and the great majority did not have extreme
changes (Figure 2). The group with reduced scores from 6
months to 2 years had severity scores, LOS and IPPV time
comparable to the group with improved scores, but clearly
tended to be older (Table 1). This age difference was non-
significant – probably due to small sample size. These
findings may indicate that severity of illness and LOS in-
fluence changes in long-term HRQOL little, while age
probably plays a more important role.
In additon, elderly patients may report better perceived
health than their functional status indicate [16,25,31]. In-
terestingly, we found no clear differences between medi-
cal and surgical patients either concerning SAPS II, LOS,
age and IPPV time.
Figure 3
Overall changes in the SF-36 dimensions Average SF-36 scores for all patients (n = 100) at 6 months (dashed line) and at
2 years (solid line) after ICU discharge.
0
20
40
60
80
100
General Health
Physical Functioning
Role Physical
Role Emotional
Social Functioning
Bodily Pain
Vitality
Mental Health
after 6 months
after 2 years
Health and Quality of Life Outcomes 2003, 1 />Page 7 of 9
(page number not for citation purposes)
The literature is definitely not conclusive about to which
degree severity of illness, LOS, age, pre-morbid health sta-
tus, diagnostic category and other parameters influence
post-ICU HRQOL. This is no surprise since many studies
are carried out in different ICU populations, with different
tools and with variable points in time used for follow-up,
making comparison difficult. Our study aims at giving
some information about changes in HRQOL following the
first 6 months of recovery.
A weakness of this study is the sample size. Within one
group a sample size of 100 is only sufficient to detect a
clinically relevant 10 point change in SF-36 score over
time, and a change of 5 points in Mental Health [24]. This
means that the sample size is a little too small to state that
Table 2: Changes in SF-36 scores Changes in SF-36 scores from 6 months to 2 years after ICU discharge (paired t-tests). Difference in
scores at 6 months between patients lost to 2-year follow-up and patients answering after 2 years (t-tests).
(SD) n= GH PF RP RE SF BP VT MH
All, 6 months 100 54.8 (24.1) 59.7 (32.6) 31.8 (40.2) 59.3 (46.1) 64.3 (30.5) 59.8 (30.7) 48.5 (21.1) 73.5 (18.4)
All, 2 years 100 54.7 (25.3) 63.3 (32.0) 40.8 (40.6) 62.0 (43.2) 72.0 (28.1) 60.4 (30.7) 51.1 (20.5) 71.4 (18.3)
Difference 95% CI - 0.1
- 4.3 to 4.0
+ 3.6
- 0.4 to 7.8
+ 9.0
0.26 to 17.7
+ 2.7
- 6.0 to 11.3
+ 7.7
2.7 to 12.8
+ 0.6
- 5.2 to 6.5
+ 2.6
- 1.4 to 6.6
- 2.1
- 5.5 to 1.2
Medical, 6 months 26 51.9 (24.8) 66.2 (31.2) 40.4 (45.9) 61.5 (42.9) 62.7 (31.4) 59.8 (30.0) 48.5 (21.2) 72.8 (17.6)
Medical, 2 years 26 54.5 (23.9) 72.1 (28.5) 50.0 (41.8) 62.8 (43.6) 76.0 (28.2) 60.5 (27.9) 53.7 (15.8) 71.4 (15.0)
Difference
95% CI
+ 2.6
-5.7 to 10.9
+ 5.9
-0.9 to 12.8
+ 9.6
-9.1 to 28.4
+ 1.3
-10.4 to 13.0
+ 13.3
1.1 to 25.5
+ 0.7
-9.8 to 11.1
+ 5.2
-2.3 to 12.7
-1.4
-8.6 to 5.8
Surgical, 6 months 74 55.8 (24.0) 57.4 (32.9) 28.7 (37.9) 58.6 (47.4) 64.9 (30.4) 59.7 (31.2) 48.4 (21.2) 73.8 (18.8)
Surgical, 2 years 74 54.7 (26.1) 60.2 (32.8) 37.5 (40.0) 61.7 (43.4) 70.6 (28.1) 60.4 (31.8) 50.1 (21.9) 71.4 (19.5)
Difference 95% CI -1.1
-6.0 to 3.8
+ 2.8
-2.0 to 7.6
+ 8.8
-1.3 to 18.9
+ 3.1
-7.9 to 14.3
+ 5.7
0.3 to 11.2
+ 0.7
-6.5 to 7.8
+ 1.7
-3.2 to 6.6
-2.4
-6.4 to 1.5
26 patients lost at 2 years, 6
months
47.6 (19.9) 45.6 (31.6) 18.3 (27.0) 33.3 (41.9) 56.7 (26.3) 47.3 (32.5) 37.3 (19.4) 62.8 (22.5)
100 patients answering
twice, 6 months
54.8 (24.1) 59.7 (32.6) 31.8 (40.2) 59.3 (46.1) 64.3 (30.5) 59.8 (30.7) 48.4 (21.1) 73.5 (18.4)
Difference
95% CI (t-test)
+ 7.2
-3.0 to 17.3
+ 14.1
0.0 to 28.2
+ 13.5
0.2 to 26.8
+ 26.0
6.6 to 45.3
+ 7.6
-5.4 to 20.5
+ 12.5
-1.1 to 26.0
+ 11.1
2.1 to 20.2
+ 10.7
2.3 to 19.2
(GH general health, PF physical functioning, RP role physical, RE role emotional, SF social functioning, BP bodily pain, VT vitality, MH mental health.
0 = worst score, 100 = best score).
Table 3: Respiratory, neurological and cardiovascular patients Changes in SF-36 scores from 6 months to 2 years after ICU discharge
for different ICU admission categories (paired t-tests).
n= GH PF RP RE SF BP VT MH
Resp. 6 months 24 49.7 58.8 39.6 65.3 57.5 63.0 47.1 73.7
Resp. 2 years 24 52.9 64.2 46.9 55.5 68.3 63.0 52.9 70.5
Difference 2 years – 6 months
(95% CI)
+ 3. 2
(- 3.1 to 9.4)
+ 5.4
(- 2.6 to 13.5)
+ 7.3
(- 9.6 to 24.2)
- 9.8
(- 26.0 to 6.5)
+ 10.9
(1.1 to 20.6)
0.0
(- 12.8 to 12.8)
+ 5.8
(- 5.5 to 17.2)
- 3.2
(- 10.8 to 4.4)
Neur. 6 months 25 58.4 56.6 21.0 48.0 64.8 58.8 46.4 69.6
Neur. 2 years 25 60.3 59.4 40.0 56.0 72.7 62.3 49.8 68.8
Difference 2 years – 6 months
(95% CI)
+ 1.9
(-8.1 to 11.9)
+ 2.8
(-7.7 to 13.3)
+ 19.0
(3.2 to 34.8)
+ 8.0
(-9.4 to 25.5)
+ 7.9
(-1.6 to 17.5)
+ 3.5
(-9.3 to 16.4)
+ 3.4
(-3.4 to 10.2)
- 0.8
(-6.7 to 5.1)
Card. 6 months 18 54.6 47.5 25.0 59.2 62.0 53.5 47.8 76.0
Card. 2 years 18 48.9 45.3 26.4 59.3 68.2 51.7 52.2 75.1
Difference 2 years – 6 months
(95% CI)
- 5.7
(-18.6 to 7.3)
- 2.2
(-13.2 to 8.9)
+ 1.4
(-22.9 to 25.7)
+ 0.1
(-17.0 to 17.1)
+ 6.2
(-11.6 to
23.9)
- 1.8
(-18.7 to 15.2)
+ 4.4
(-3.2 to 12.1)
- 0.9
(-10.4 to 8.6)
(GH general health, PF physical functioning, RP role physical, RE role emotional, SF social functioning, BP bodily pain, VT vitality, MH mental health.
0 = worst score, 100 = best score).
Health and Quality of Life Outcomes 2003, 1 />Page 8 of 9
(page number not for citation purposes)
the statistically significant changes we found are clinically
relevant. The tendencies are clear, though. The SF-36
scores were also compared using the Wilcoxon test, with
the same results. Another weakness is that we know noth-
ing about the HRQOL of those not answering. Judged by
the demographic data, our study patients were fairly rep-
resentative for our mixed ICU patients, but for HRQOL
that may not be the case. As time passes by after ICU dis-
charge, other factors not related to the ICU stay and con-
comitant conditions may of course influence HRQOL. We
have not compared men and women separately in this
study, in order to avoid too much complexity and small
cohorts. A paper reported no gender differences in SF-36
scores 3 months after discharge from a mixed ICU [25]. It
is recommended that longitudinal studies should explore
and account for correlation structures (within and be-
tween individuals) over time [19]. This would mean use
of more complicated statistical methods than we have
used.
Conclusions
We believe studies of longitudinal changes can give useful
information about long-term outcome and rehabilitation
after intensive care. This study indicates a modest im-
provement in HRQOL from 6 months to 2 years after ICU
discharge both for medical and surgical patients. The sam-
ple size limits the interpretation concerning significance
and clinical relevance. An important challenge for further
research is to use this background knowledge to find out
which interventions could improve HRQOL and increase
the effectiveness of rehabilitation of former ICU patients.
Authors' contributions
RK carried out the data collection and analysis, and draft-
ed the manuscript. HF participated in the design and co-
ordination of the study, and has read, approved and
contributed to the final manuscript.
Acknowledgements
We would like to thank the Norwegian Research Council for financial sup-
port and Section for Medical Statistics, Dept. of Public Health and Primary
Health Care, University of Bergen.
References
1. Zaren B and Bergstrom R Survival compared to the general
population and changes in health status among intensive
care patients Acta Anaesthesiol Scand 1989, 33:6-12
2. Niskanen M2-16F, Kari A and Halonen P Five-year survival after
intensive care comparison of 12,180 patients with the gen-
eral population. Finnish ICU Study Group Crit Care Med 1996,
24:1962-1967
3. Flaatten H and Kvale R Survival and quality of life 12 years after
ICU. A comparison with the general Norwegian population
Intensive Care Med 2001, 27:1005-1011
4. Heyland DK, Guyatt G, Cook DJ, Meade M, Juniper E, Cronin L and
Gafni A Frequency and methodologic rigor of quality-of-life
assessments in the critical care literature Crit Care Med 1998,
26:591-598
5. Black NA, Jenkinson C, Hayes JA, Young D, Vella K, Rowan KM, Daly
K and Ridley S Review of outcome measures used in adult crit-
ical care Crit Care Med 2001, 29:2119-2124
6. Vazquez Mata G, Rivera Fernandez R, Gonzalez Carmona A, Delgado-
Rodriguez M, Torres Ruiz JM, Raya Pugnaire A and Aguayo de Hoyos
E Factors related to quality of life 12 months after discharge
from an intensive care unit Crit Care Med 1992, 20:1257-1262
7. Wehler M2-20F, Martus P, Geise A, Bost A, Mueller A, Hahn EG and
Strauss R Changes in quality of life after medical intensive
care Intensive Care Med 2001, 27:154-159
8. Ridley S2-28, Burchett K, Gunning K, Burns A, Kong A, Wright M,
Hunt P and Ross S Heterogeneity in intensive care units: fact
or fiction? Anaesthesia 1997, 52:531-537
9. Zaren B and Hedstrand U Quality of life among long-term sur-
vivors of intensive care Crit Care Med 1987, 15:743-747
10. Hurel D, Loirat P, Saulnier F, Nicolas F and Brivet F Quality of life
6 months after intensive care: results of a prospective multi-
center study using a generic health status scale and a satis-
faction scale Intensive Care Med 1997, 23:331-337
11. Brooks R, Kerridge R, Hillman K, Bauman A and Daffurn K Quality
of life outcomes after intensive care. Comparison with a
community group Intensive Care Med 1997, 23:581-586
12. Niskanen M, Ruokonen E, Takala J, Rissanen P and Kari A Quality of
life after prolonged intensive care Crit Care Med 1999, 27:1132-
1139
13. Heyland DK, Hopman W, Coo H, Tranmer J and McColl MA Long-
term health-related quality of life in survivors of sepsis. Short
Form 36: a valid and reliable measure of health-related qual-
ity of life Crit Care Med 2000, 28:3599-3605
14. Pettila V, Kaarlola A and Makelainen A Health-related quality of
life of multiple organ dysfunction patients one year after in-
tensive care Intensive Care Med 2000, 26:1473-1479
15. Ridley SA2-19F, Chrispin PS, Scotton H, Rogers J and Lloyd D
Changes in quality of life after intensive care: comparison
with normal data Anaesthesia 1997, 52:195-202
16. Konopad E, Noseworthy TW, Johnston R, Shustack A and Grace M
Quality of life measures before and one year after admission
to an intensive care unit Crit Care Med 1995, 23:1653-1659
17. Dragsted L and Qvist J Outcome from intensive care. III. A 5-
year study of 1308 patients: activity levels Eur J Anaesthesiol
1989, 6:385-396
18. Capuzzo M, Bianconi M, Contu P, Pavoni V and Gritti G Survival and
quality of life after intensive care Intensive Care Med 1996,
22:947-953
19. Ridley S Outcomes in critical care Butterworth Heinemann, Oxford
2002, Outcomes in critical care:139-168
20. Brazier JE2-11, Harper R, Jones NM, O'Cathain A, Thomas KJ, Ush-
erwood T and Westlake L Validating the SF-36 health survey
questionnaire: new outcome measure for primary care Bmj
1992, 305:160-164
21. Chrispin PS2-17F, Scotton H, Rogers J, Lloyd D and Ridley SA Short
Form 36 in the intensive care unit: assessment of acceptabil-
ity, reliability and validity of the questionnaire Anaesthesia
1997, 52:15-23
22. Ware J. E., Jr., Bayliss MS, Rogers WH, Kosinski M and Tarlov AR Dif-
ferences in 4-year health outcomes for elderly and poor,
chronically ill patients treated in HMO and fee-for-service
systems. Results from the Medical Outcomes Study Jama
1996, 276:1039-1047
23. Rumsfeld JS, Magid DJ, O'Brien M, McCarthy M., Jr., MaWhinney S,
Scd, Shroyer AL, Moritz TE, Henderson WG, Sethi GK, Grover FL
and Hammermeister KE Changes in health-related quality of life
following coronary artery bypass graft surgery Ann Thorac Surg
2001, 72:2026-2032
24. Ware J2-14F SF-36 Health Survey. Manual and interpretation
guide. Boston: The health institute, Boston, Massachussets
1993,
25. Eddleston JM, White P and Guthrie E Survival, morbidity, and
quality of life after discharge from intensive care Crit Care Med
2000, 28:2293-2299
26. Ridley SA and Wallace PG Quality of life after intensive care An-
aesthesia 1990, 45:808-813
27. Lipsett PA, Swoboda SM, Dickerson J, Ylitalo M, Gordon T, Breslow
M, Campbell K, Dorman T, Pronovost P and Rosenfeld B Survival
and functional outcome after prolonged intensive care unit
stay Ann Surg 2000, 231:262-268
Publish with BioMed Central and every
scientist can read your work free of charge
"BioMed Central will be the most significant development for
disseminating the results of biomedical research in our lifetime."
Sir Paul Nurse, Cancer Research UK
Your research papers will be:
available free of charge to the entire biomedical community
peer reviewed and published immediately upon acceptance
cited in PubMed and archived on PubMed Central
yours — you keep the copyright
Submit your manuscript here:
/>BioMedcentral
Health and Quality of Life Outcomes 2003, 1 />Page 9 of 9
(page number not for citation purposes)
28. Vazquez Mata G, Rivera Fernandez R, Perez Aragon A, Gonzalez Car-
mona A, Fernandez Mondejar E and Navarrete Navarro P Analysis
of quality of life in polytraumatized patients two years after
discharge from an intensive care unit J Trauma 1996, 41:326-
332
29. Short TG, Buckley TA, Rowbottom MY, Wong E and Oh TE Long-
term outcome and functional health status following inten-
sive care in Hong Kong Crit Care Med 1999, 27:51-57
30. Holbrook TL, Anderson JP, Sieber WJ, Browner D and Hoyt DB
Outcome after major trauma: 12-month and 18-month fol-
low-up results from the Trauma Recovery Project J Trauma
1999, 46:765-71; discussion 771-3
31. Rockwood K, Noseworthy TW, Gibney RT, Konopad E, Shustack A,
Stollery D, Johnston R and Grace M One-year outcome of elderly
and young patients admitted to intensive care units Crit Care
Med 1993, 21:687-691