Health and Quality of Life Outcomes BioMed Central Research Open Access The management of pot
Bạn đang xem bản rút gọn của tài liệu. Xem và tải ngay bản đầy đủ của tài liệu tại đây (256.93 KB, 9 trang )
BioMed Central
Page 1 of 9
(page number not for citation purposes)
Health and Quality of Life Outcomes
Open Access
Research
The management of subjective quality of life by short-stay
hospital patients: An exploratory study
David J Mellor*
†1
, Robert A Cummins
†1
, Evelyn Karlinski
†2
and
Shane P Storer
†2
Address:
1
School of Psychology, Deakin University, Burwood, Australia and
2
Southwest Healthcare, Warrnambool, Victoria, Australia
Email: David J Mellor* - ; Robert A Cummins - ; Evelyn Karlinski - ;
Shane P Storer -
* Corresponding author †Equal contributors
Abstract
Background: This study tested the homeostatic model of subjective quality of life in a group of
47 short stay patients as they progressed through the stages of hospitalization for surgery.
Method: Participants completed a questionnaire measuring subjective quality of life, positive and
negative affect, self-esteem, optimism and cognitive flexibility, the day prior to admission (T1), two
days post-operation (T2) and one week after discharge (T3). Neuroticism and Extroversion were
measured at Time 1.
Results: All variables remained stable across the three times, apart from positive affect, which
dropped significantly post-operation but returned to its previous level post discharge.
Conclusion: Although the homeostatic model of subjective quality of life was supported at Time
1, the analyses raise doubts about the stability of personality. This finding is consistent with recent
discussions of personality.
Background
It has now been established that when population means
are used as data, people are satisfied with their lives within
the range of 70–80 percent of the measurement scale max-
imum score (percent of scale maximum or % SM: [1]).
The consistency of such data is remarkable, and it has
been argued [2,3] that this restricted normative range
indicates that subjective quality of life (SQOL) is actively
managed by a homeostatic system. This idea has been
extended in a number of useful ways. First, when the
scores of individuals are used as data, the group mean
remains at 75% SM but the normative range becomes 50–
100% SM [4]. Thus, people who record a level of SQOL
less than 50% SM can be considered to be experiencing
homeostatic failure. Second, aggregate satisfaction with
the seven life domains that comprise the Comprehensive
Quality of Life Scale (to be used in this study) also con-
form with the above distributional characteristics [5].
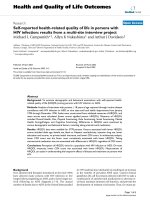
Finally, a model for SQOL homeostasis has been pub-
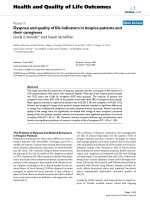
lished [6], and is shown in Figure 1.
This model depicts SQOL as the outcome from a combi-
nation of personality, which is proposed to provide affect
balance, cognition involving the 'second order determi-
nants' of self-esteem, optimism, and control, and interac-
tion with the environment. At least since the time of Hall
[7], it has been proposed that SQOL can be defined
through these three elements. More recently SQOL has
been confirmed as having a strong trait component (e.g.
see [8] for a review) that explains around half of the SQOL
Published: 08 September 2003
Health and Quality of Life Outcomes 2003, 1:39
Received: 23 June 2003
Accepted: 08 September 2003
This article is available from: />© 2003 Mellor et al; licensee BioMed Central Ltd. This is an Open Access article: verbatim copying and redistribution of this article are permitted in all
media for any purpose, provided this notice is preserved along with the article's original URL.
Health and Quality of Life Outcomes 2003, 1 />Page 2 of 9
(page number not for citation purposes)
variance [9], and with a heritability of around 80 percent
[10]. The cognitive processes that involve self-esteem, per-
ceived control, and optimism have also been proposed to
be intimately involved in SQOL generation [11]. Feed-
back control for homeostatic maintenance is proposed to
involve behavior [11]. That is, a system that produces
overly high SQOL will result in magnified risk-taking
behavior. This will result in an increased probability of
personal failure which, when it occurs, will cause SQOL to
be reduced. Conversely, if homeostasis fails, the person
becomes depressed, and their behavioral withdrawal
allows the homeostatic mechanisms of adaptation to
regain control of SQOL.
The relative contribution of affect and cognition to the
maintenance of SQOL, and the relationship between
them, is uncertain. In particular the question as to
whether cognition mediates affect and thus the two work
as a single system, or whether affect can be experienced
without cognition, and therefore, be considered as a sep-
arate system, remains unresolved. While Zajonc [12,13]
has argued for the independent systems approach and the
primacy of affect, Parrott and Sabini [14] concluded that
there is no compelling reason to suggest that affect is inde-
pendent from cognition. In our view, cognition is influ-
enced by the affective background level determined by
personality (Figure 1).
Interestingly, different forms of psychopathology involve
disorders of affect and cognition to varying degrees. In
terms of affect, this concerns varying extents of heightened
negative affect and reduced positive affect. The largest
such changes occur in association with depression, and
less change will be associated with disorders such as
obsessive compulsive disorders where people generally
experience more negative and less positive affect, but not
necessarily to the point of depression. In terms of cogni-
tion, the disorders involve a syndrome of constricted cog-
nitions in which the people concerned either are unable
to focus on thoughts normally associated with positive
affects ("happy thoughts") as occurs in depression, or are
focused on very limited aspects of their interactions with
the environment. This latter condition may occur for
example, in anorexia nervosa, where cognitions are preoc-
cupied with issues of food intake and body image. More-
over, since such cognitions are driven by a sense of
dissatisfaction with weight gain and body image, they
likely act to decrease SQOL.
Thus, the capacity to be cognitively flexible in interactions
with the environment may be important in SQOL judg-
ments, particularly when the person is under stress. It also
is important to note, however, that SQOL is not suscepti-
ble to the influence of overall level of quality of cognition.
The literature provides no support that IQ is linked in any
simple way with SQOL, and indeed, people with an
A model for subjective quality of life homeostasisFigure 1
A model for subjective quality of life homeostasis
+ -
NEGATIVEPOSITIVE
EXPERIENTIAL INPUT
FIRST ORDER
DETERMINANTS
AS PERSONALITY
SECOND ORDER
DETERMINANTS
AS INTERNAL BUFFERS
SUBJECTIVE
QUALITY OF LIFE
EXTROVERSION
NEUROTICISM
CONTROL
SELF-ESTEEM
OPTIMISM
THIRD ORDER
DETERMINANTS AS
THE ENVIRONMENT
Health and Quality of Life Outcomes 2003, 1 />Page 3 of 9
(page number not for citation purposes)
intellectual disability living in the community have an
average SQOL lying within the normal range [15].
Subjective quality of life and illness
According to the theory of SQOL homeostasis (Figure 1),
and in accordance with empirical data [16], there is no
simple relationship between medical health and the level
of subjective life quality. Provided that a medical condi-
tion does not overly tax the homeostatic system, adapta-
tion to changed functional status will occur and the level
of SQOL will reflect the set-point-range determined by
each individual's personality. However, some aspects of
injury and disease can defeat the homeostatic system. This
is particularly the case where a sudden loss of functional
status is experienced or where the medical condition
involves substantial pain. Under such circumstances, and
in accordance with Figure 1, the pathological condition
(as the 'Third order determinant') dominates the system
and drives SQOL down.
In this study, we set out to test the homeostatic model
using a sample of surgery patients. We suggested that this
sample would be quite heterogeneous with regard to
SQOL. While all will be experiencing a substantial chal-
lenge to their homeostatic systems, some will be able to
deal effectively with this challenge, while others will not.
As a consequence it is anticipated that these patients will
exhibit wide variation in their initial levels of SQOL. The
relative proportion who are, and who are not, experienc-
ing such compromise on admission is not known and will
be an exploratory feature of this study. However, it is
anticipated that effective treatment following admission
and habitation to hospital routines will return many com-
promised patients back to within the normal 50–100%
SM range.
The aims of this study were:
a. to investigate the SQOL of patients with a medical con-
dition requiring surgery, and to monitor it as they
progress through the surgery process
b. to test the predictive model proposed in Figure 1 at each
stage of the treatment process
c. to investigate whether cognitive flexibility makes a
unique contribution to the prediction of subjective
wellbeing.
Method
Participants
All short stay (less than one week) surgery patients (n =
148) at a regional hospital over a six-month period were
invited to participate in the study. The majority were gyne-
cological patients (n = 78) and orthopaedic patients (n =
52). The remainder were a mixed group of choleycyctec-
tomy, varicose veins and mastectomy patients. Sixty-eight
patients (64 females and 4 males) agreed to participate,
and completed the questionnaires at their pre-admission
assessment. Fifty-three of these patients agreed to com-
plete the questionnaires again within two days post-oper-
ative and forty-seven completed them again within a week
of discharge. Of these, 45 were female (mean age = 44.80,
SD = 12.89) and two were male (aged 34 and 68).
Materials
A questionnaire package was developed for the purpose of
the study. It consisted of a demographic sheet that
recorded the participant's age, gender and case number,
and the following standard scales, all of which have sound
psychometric properties:
a. The satisfaction subscale of the Comprehensive Quality
of Life Scale (ComQol) – Adult version [17]. This instru-
ment measures the level of perceived satisfaction with
each of seven domains as follows: material wellbeing,
health, productivity, intimacy, safety, community, and
emotional wellbeing. This scale is psychometrically sound
[18], and also produces a total score which falls within the
gold-standard range for life satisfaction of 70–80% SM
[5]. The possible range of scores is 0–100.
b. The Cognitive Flexibility Scale [19]. This 8 item scale
measures three components of cognitive flexibility
(awareness of options and alternatives, willingness to be
flexible and adaptable, and self-efficacy in being flexible).
The authors report that the scale demonstrates good inter-
nal reliability, and construct and concurrent validity.
Scores were calculated to range from 0–10.
c. The Dispositional Mood Scale (reduced version) [20].
This is a standard instrument that measures trait mood
using both poles (high and low) of positive and negative
affect. The reduced version comprises 16 items. The
authors of the original scale report internal consistency
reliabilities ranging from .87 to .93. In this study, scores
were calculated so that they ranged from 0–10.
d. The Extroversion and Neuroticism subscales of the
NEO Five-Factor Inventory [21]. Each subscale consists of
12 items and their reliability and validity are well-estab-
lished. Internal consistency for the domain scales range
from .76 to .93, and scores for adults are extremely stable
with retest coefficients ranging from .63 to .83 [21]. Scores
in this study were calculated so that they ranged from 0–
10.
e. Rosenberg Self-Esteem Scale [22]. This is a standard 10-
item instrument for measuring self-esteem. It has sound
psychometric properties, with test-retest correlations
Health and Quality of Life Outcomes 2003, 1 />Page 4 of 9
(page number not for citation purposes)
typically being in the range of .82 to .88, and Cronbach's
alpha for various samples being in the range of .77 to .88
[23]. The scoring range for this study was 0–10.
f. Primary and Secondary Cognitive Control Scale [24].
This is the third edition of this scale that has been in devel-
opment since 1998. The Primary Control scale has seven
items and the Secondary Control Scale has 17 items. These
have a Cronbach alpha of .87 and .89 respectively. Scores
for primary control range from 0–10 and for secondary
control from 0–5.
g. Revised Life Orientation Test [25]. This instrument
measures optimism. Only the three positively worded
items were used. These items have been shown to have a
Cronbach alpha of 0.68 [26]. Scores were calculated to
range from 0–10.
Three versions of the questionnaire were produced and
colour-coded to differentiate the three administration
times. The second and third versions of the questionnaire
did not include the NEO-Five-Factor Inventory items,
since there has been a broad consensus in the literature
that personality is reasonably constant over the adult
lifespan and is therefore a stable personal characteristic
[28,28]. On this basis, it was assumed that only one meas-
ure of personality was needed. This also reduced the bur-
den on participants in terms of time and effort.
Procedure
Ethics approval for the project was obtained from Deakin
University and the Healthcare Service that administers the
hospital from which participants were recruited.
Patients presenting for surgery routinely report to the hos-
pital for a pre-surgery assessment one to 10 days prior to
admission. At this point, the surgery unit manager invited
the patients to participate in the study, provided them
with a statement that gave the details of the study, and the
requirements of participants. If the patient agreed to par-
ticipate in the study, they then completed the first version
of the questionnaire.
Within two days after surgery, the patients were asked to
complete the second version of the questionnaire. At dis-
charge, they were asked to complete the third version of
the questionnaire after one week, and return it via reply
paid mail.
Statistical Analysis
SPSS version II was used to analyze the data, using
descriptive and correlational analysis, multivariate analy-
sis of variance, and regression analyses.
Results
Table 1 summarizes the mean scores on each of the varia-
bles at each assessment period. All analyses were based on
the data provided by the 47 participants who completed
the questionnaire on each of the three testing occasions.
These participants were not different from the participants
who commenced the study but did not complete it (n=
21), other than being marginally less extraverted (p = .04).
That is, at the first point of data collection, there were no
significant differences between those who went on to
complete the study and those who did not, in relation to
any of the variables measured, other than extraversion.
While we realize that this number of participants is below
the recommended number for using multivariate statis-
tics, the results are fairly clear-cut such that the addition of
a few more cases would be unlikely to change the
outcome.
Multivariate Analysis of Variance, which tests the signifi-
cance of differences between/within groups across time or
variables, was applied to the data. The analysis indicated
no significant effect for time (F [2,40] = .55). Post-hoc
analyses indicated that only positive affect varied signifi-
cantly over the three testing occasions. It decreased signif-
icantly immediately after the operation, but returned to its
previous levels post-discharge.
The most critical value to note in Table 1 is the satisfaction
score at Time 1 of 70.5 ± 18.8. Given the normative range
of 70–80% SM [5,2] this initial mean score indicates that
the patients who agreed to take part in this study had, as a
group, a level of subjective wellbeing that lies at the lower
margin of the normative range. Thus, while some mem-
bers of the group would have homeostatic failure, the
majority would not, and so any intervention given to this
majority would not be expected to increase their SQOL to
any great extent. Indeed, the data displayed in Table 1
indicate that this is the case, as while SQOL scores
increased by 2.9 percentage points over the course of this
study, this increase was not significant.
Relationships between the variables
Table 2 shows the correlations between all variables at
each of the times in the study. One observation that can
be made in relation to Table 2 is that the average degree of
correlation between the two measures of personality and
the other variables systematically decreases from Time 1
to Time 3. In the case of Extroversion the average correla-
tions (ignoring sign) with the other non-personality vari-
ables (1 and 4–10 in Table 2) are .43, .36, and .33 at Times
1, 2 and 3 respectively. This represents an average degree
of shared variance of 18.3%, 12.7%, and 11.2% respec-
tively. In the case of Neuroticism the decrease is even
more marked (.46, .34, .23 or 21.1%, 11.3%, and 5.4%).
There is a distinct possibility that this progressive disasso-
Health and Quality of Life Outcomes 2003, 1 />Page 5 of 9
(page number not for citation purposes)
ciation may have been due to the fact that both personal-
ity variables were measured only once at Time 1. This
limitation was imposed on the assumption that such per-
sonality measures should be stable over the few weeks of
the study. In retrospect, however, this assumption may
have been unwarranted and this progressive reduction in
the degree of association with other variables could be a
methodological artifact.
Testing the Model
In order to test the proposed model for subjective wellbe-
ing homeostasis, three hierarchical multiple regressions
were conducted, one for each time period. Multiple
regression analysis assesses the amount of variance in the
dependent variable attributable to the independent varia-
bles. The hierarchical procedure used here assesses the
additional variance in the dependent variable explained
by particular independent variables after the variance
accounted for by other independent variables entered at
Step 1 etc has been controlled. A power statistic can be
derived to assess whether the ratio between participants
and number of variables in the model is adequate (>0.8).
In the current analyses, the two personality variables were
entered as the first step, the three buffers at Step 2 (Con-
trol, Optimism, and Self-Esteem), and Cognitive Flexibil-
ity at Step 3. The results of these analyses are provided in
Table 3. The power statistic for the analysis at each time
was 1.0 (p < 0.05), indicating that there were sufficient
participants for the analyses in relation to the number of
variables.
The following observations can be made:
1. At Time 1 the variables together explained 71 percent of
the variance. This value is high enough to expect that most
of the measurable variance has been captured.
2. At Time 1 the dominating variables are Extroversion
and Neuroticism, just as predicted by the model.
3. At Times 2 and 3, predictive dominance switches from
personality to the buffers. By Time 3 the buffers are
contributing over five times the unique predictive vari-
ance of personality (9.9 percent vs 1.8 percent).
4. Of the three buffers, only self-esteem and optimism
were able to contribute unique variance beyond that of
the two personality variables. At Time 1 this unique con-
tribution was limited to self-esteem, at Time 2 both varia-
bles contributed unique variance, while Time 3 was
restricted to optimism.
5. Cognitive Flexibility made no unique contribution to
the predictive variance at any time.
Discussion
The aims of this study were threefold: to chart SQOL as
patients progress through short stay hospitalization for
surgery, to test the model of subjective wellbeing homeos-
tasis at each stage of the process, and to determine
whether cognitive flexibility makes a unique contribution
to the prediction of wellbeing. The results are surprising
and affirm some aspects of the homeostatic model of
wellbeing, while also providing insights that will be useful
to guide future research in this area.
Perhaps the most surprising result is that the patient group
remained within the normal range of subjective wellbeing
throughout the study. It is now well established that the
normative range of subjective wellbeing in relation to
group mean scores is 70 to 80% SM [5,29]. This under-
standing allows a crucial level of interpretation to be
applied to the current data. This is that, since this group of
people commenced the study operating within this nor-
mative range, the majority of the patients were success-
fully maintaining their SQOL prior to surgery. Thus, for
this group, the extent to which the subsequent treatment
had the potential to elevate their SQOL was very limited.
Cummins [6] has argued that people have a narrow 'set-
point-range' within which the homeostatic system oper-
ates to control SQOL. This range may be around five per-
centage points. Thus, assuming that the pre-surgical
circumstances were aversive enough to push this majority
Table 1: Means and standard deviations for all variables across the
three assessment phases of the study
Time 1 Time 2 Time 3 F p
Satisfaction M 70.5 72.2 73.4 0.10 0.91
SD 18.8 15.1 16.0
Extroversion M 5.99 - -
SD 1.35
Neuroticism M 4.61 - -
SD 1.52
Self-Esteem M 7.53 7.31 7.14 2.44 0.10
SD 1.17 1.59 1.68
Optimism M 6.11 6.88 6.80 1.79 0.18
SD 2.41 1.86 1.87
Primary control M 7.48 7.70 7.64 0.04 0.96
SD 1.79 1.58 1.65
Secondary control M 1.48 1.54 1.63 2.33 0.11
SD 0.45 0.51 0.63
Positive Affect M 6.04 4.84 6.07 11.79 0.00
SD 2.00 1.66 1.71
Negative affect M 3.73 4.02 3.67 1.69 0.20
SD 1.99 1.77 1.76
Cognitive flexibility M 7.76 7.51 7.61 0.98 0.38
SD 1.39 1.32 1.26
Health and Quality of Life Outcomes 2003, 1 />Page 6 of 9
(page number not for citation purposes)
group's SQOL down towards the lower margin of their
range, some slight increment might be achieved as a con-
sequence of the surgery, but not of sufficient magnitude to
be detected in a small sample above the 'noise' of individ-
ual differences in variation due to other factors. It is also
notable that the standard deviation decreased by 2.8% SM
during the study, which is consistent with the intervention
being effective in allowing some patients to restore their
homeostatic control of SQOL. However, over the whole
sample, the number of patients was insufficient to dem-
onstrate an overall SQOL change. This is an important
vindication of theory and constitutes the basis for advice
to future investigators who are seeking to demonstrate
positive change in subjective wellbeing as a consequence
of some form of intervention. If the target group members
have an initial level of wellbeing that lies within the nor-
mative range of 70–80% SM, then the chances that the
intervention will result in a demonstrable elevation of
SQOL are slim unless the sample is large.
The analyses also suggest that only the data at Time 1 can
be considered to be a proper test-bed in relation to the
model. The reason for this is that the two personality fac-
tors were measured only at Time 1, with the assumption
that they would remain stable throughout the course of
the study. It is apparent, however, that this assumption
may have been false, and that there is evidence, to be dis-
Table 2: Correlation matrix of all variables at Times 1, 2 and 3
123456789
1. Satisfaction Time
1
2
3
2. Extroversion Time
1.65
2.56
3.46
3. Neuroticism Time
1 74 42
2 56
3 39
4. Self-Esteem Time
1 .71 .38 67
2 .75 .36 59
3 .62 .37 48
5. Optimism Time
1 .56 .43 48 .57
2 .69 .50 43 .64
3 .70 .45 27 .59
6. Prim. Control Time
1 .54 .55 37 .49 .61
2 .44 .32 19 .52 .52
3 .58 .37 12 .50 .63
7. Sec. Control Time
1 26 28 .28 10 10 21
2 32 26 .30 37 28 16
3 19 17 .18 43 06 22
8. Pos. Affect Time
1 .38 .50 38 .31 .40 .48 10
2 .47 .28 .04 .35 .52 .40 .14
3 .38 .29 03 .50 .35 .46 37
9. Neg. Affect Time
1 48 30 .55 43 30 37 06 39
2 19 09 .34 11 28 .04 .03 21
3 23 23 .28 35 13 17 .27 36
10. Cog. Flex. Time
1 .24 .33 20 .38 .26 .21 .01 .38 .02
2 .49 .48 24 .40 .46 .42 23 .24 .10
3 .54 .33 11 .47 .72 .66 09 .29 08
Health and Quality of Life Outcomes 2003, 1 />Page 7 of 9
(page number not for citation purposes)
cussed later, that personality may have been unstable
across the three measurement times.
In terms of the data at Time 1, there is partial support for
the model. Clearly extroversion and neuroticism
dominated in their prediction of subjective wellbeing, and
the only buffer to make an independent contribution to
the predictive variance was self-esteem. It is notable, how-
ever, that the personality and buffer variables between
them were able to explain a massive 71% of the variance
in subjective wellbeing. What this indicates is the gross
dominance of personality under such 'resting' conditions,
where subjective wellbeing is not under threat and operat-
ing well within its normal range. It is possible that the
buffers would play a more determined role in subjective
wellbeing management under conditions of greater envi-
ronmental challenge. This possibility is not testable here,
not only due to the normative levels of subjective wellbe-
ing, but also because personality was only measured at
Time 1. Notably, cognitive flexibility scores were found to
make no unique contribution to scores SQOL. This find-
ing indicates that cognitive flexibility plays no role in the
determination SQOL.
There has been a broad consensus in the literature that
personality is a dispositional trait (eg. [30]) that is, there-
fore, held fairly constant over the adult lifespan as a stable
personal characteristic [27]; [28]. This, however was not
always the generally held belief, with some earlier author-
ities stating that in their view personality traits are quite
ephemeral concepts (eg. [31]). While few contemporary
authors would describe personality traits as 'ephemeral',
the evidence is certainly mounting that neither are they
rigidly fixed. In a review of the relationship between per-
sonality and subjective wellbeing, Diener, Suh, Lucas and
Smith [32] conclude that while there is clearly a genetic
influence of personality on subjective wellbeing, the esti-
mates of the strength of this influence vary widely. More-
over, other literature is providing mounting evidence that
the apparent stability may, at least in part, be a product of
human conservatism. That is, people generally adopt a liv-
ing environment to suit their personality, thus providing
for themselves a fairly consistent framework of person-
environment interactions.
This was also the conclusion drawn by Caspi and Roberts
[33] in their review of personality development across the
life-course. While they found the literature to generally
support the stability of personality as people age, they are
firm in their opinion that such general stability does not
support the conclusion that personality becomes fixed at
a certain age. If a person experiences severe environmental
dislocation or a major life event, it is quite likely that their
personality structure will change as a consequence. This
view has been corroborated by Willebrand, Kildal, Ander-
son and Ekselius [34] who found that 3–19 years after
traumatic burn injury, people had higher neuroticism
than scale norms. Similar changes have been reported for
people with severe arthritis [35]. Thus it seems that the
conclusion reached by Roberts and DelVecchio [36] from
Table 3: Hierarchical regression of personality and buffer variables on subjective wellbeing
TIME 1 TIME 2 TIME 3
Step R
2
(change) P = sr
2
R
2
(change) P = sr
2
R
2
(change) P = sr
2
1.69.000 .36 .000 .26 .002
Extroversion .000 14.0 .007 12.0 .02 10.9
Neuroticism .000 26.7 .017 9.3 .10 4.8
2 .06 .069 .30 .000 .33 .000
Extroversion .002 7.0 .06 3.2 .46 0.6
Neuroticism .01 5.9 .62 0.2 .30 1.2
Sec. Control .85 0.0 .93 0.0 .93 0.0
Prim. Control .59 0.2 .86 0.0 .21 1.7
Optimism .73 0.1 .04 4.3 .02 6.7
Self-esteem .02 3.8 .004 8.3 .24 1.5
3 .01 .31 .01 .35 .00 .96
Extroversion .002 7.7 .13 2.2 .46 0.6
Neuroticism .007 5.3 .58 0.3 .30 1.2
Sec. Control .91 0.0 .99 0.0 .93 0.0
Prim. Control .65 0.1 .74 0.1 .26 1.4
Optimism .70 0.1 .05 3.7 .03 5.3
Self-esteem .01 3.7 .006 7.7 .25 1.5
Cog. Flex .31 0.7 .36 0.8 .96 0.0
Adjusted R
2
.708 .606 .596
Health and Quality of Life Outcomes 2003, 1 />Page 8 of 9
(page number not for citation purposes)
their meta-analysis of personality trait consistency, repre-
sents the contemporary view. That is, while personality
traits are mainly consistent in adulthood, they retain a
dynamic potential in the face of severe environmental
challenge.
So, the question now is whether the experience of hospi-
talization and surgery is sufficient to produce a change in
personality along the lines that have been suggested. It
seems that the answer may be in the affirmative. Person-
ality change during the course of this study is evident
through the diminishing strength of intercorrelations
between the personality and other variables from Time 1
to Times 2 and 3. This suggestion of personality change is
very interesting and raises the whole issue of the degree of
environmental challenge that is capable of causing such
alterations in the relationships between variables. Recall
that subjective wellbeing remained within its normal
range, so the nature of the medical condition and the
experience of hospitalization were not sufficiently aver-
sive to defeat subjective well being homeostasis. Such
changes may, however, provide insight into the dynamics
of homeostasis in terms of its internal management. Pre-
vious studies (e.g. [37]) have indicated the presence of
'domain compensation'. Here, as homeostasis is chal-
lenged but not defeated, satisfaction with those domains
under most stress decreases, while satisfaction with other
domains increases in a compensatory manner, thereby
maintaining overall satisfaction within its normative
range. It is quite possible that other forms of internal
adjustment during times of stress might also involve per-
sonality. A future study will be required to test this by
incorporating the sequential measurement of personality
into a study such as we have performed.
The interesting understanding to emerge from this study is
that the group of people who volunteered to be part of the
study had a normal range SQOL. In other words, the less
than life-threatening and non-traumatic nature of their
medical conditions, and the surgical interventions
required, did not represent environmental challenges of
sufficient intensity to defeat homeostasis. Thus, no inter-
vention was likely to raise their levels of well-being since
their homeostatic systems were already effective. A more
interesting group would be those people who enter hospi-
tal in conditions of homeostatic defeat, but how to ethi-
cally recruit such a sample is problematic. Clearly, a much
larger sample than the one used in this study is required
to adequately investigate the issues raised here.
Conclusions
Previous research investigating the relationships between
illness and SQOL has produced equivocal results. Our
study suggests that some conditions requiring surgery do
not necessarily affect SQOL, and that for people who enter
hospital with a normal range SQOL, their levels will
remain fairly consistent through the surgery and recovery
periods. Our findings support the homeostatic model of
subjective wellbeing. However, personality may be a less
stable characteristic, and the dynamics of the homeostatic
model of wellbeing require further investigation.
Authors' contributions
David Mellor and Robert Cummins conceived the study,
participated in the design of the study, conducted the sta-
tistical analyses, and drafted the manuscript. Evelyn Kar-
linski participated in the design of the study and oversaw
the collection of data. Shane Storer participated in the
coordination of the study. All authors read and approved
the fund manuscript.
References
1. Cummins RA: On the trail of the gold standard for life
satisfaction. Soc Indicators Res 1995, 35:179-200.
2. Cummins RA: The second approximation to an international
standard of life satisfaction. Soc Indicators Res 1998, 43:307-334.
3. Cummins RA, Gullone E and Lau ALD: A model of subjective well
being homeostasis: The role of personality. In The universality of
subjective wellbeing indicators Edited by: Gullone E, Cummins RA. Soc Indi-
cators Res Ser; 2002:7-46.
4. Cummins RA: Normative life satisfaction: Measurement issues
and a homeostatic model. Soc Indicators Res .
5. Cummins RA: The domains of life satisfaction: An attempt to
order chaos. Soc Indicators Res 1996, 38:303-332.
6. Cummins RA: Personal income and subjective well-being: A
review. J Happiness Studies 2000, 1:133-158.
7. Hall J: Measuring the quality of life using sample surveys. In
Technology assessment of quality of life Edited by: Stoker GJ, Schumacher
D Elsevier. Scientific Publishing Company, Proceedings of the 4th General
Conference of SAINT. Salzburg, Austria.; 1973:94-102.
8. McNeil JK, Stones MJ and Kozma A: Subjective well-being in later
life: Issues concerning measurement and prediction. Soc Indi-
cators Res 1986, 18:35-70.
9. Tellegen A, Bouchard Jr TJ, Wilcox KJ, Segal NL, Lykken DT and Rich
S: Personality similarity in twins reared apart and together. J
Pers Soc Psychol 1998, 54:1031-1039.
10. Lykken D and Tellegen A: Happiness is a stochastic
phenomenon. Psychol Sci 1996, 7:186-189.
11. Cummins RA and Nistico H: Maintaining life satisfaction: The
role of positive cognitive bias. J Happiness Studies 2002, 3:37-69.
12. Zajonc RB: Feeling and thinking: Preferences need no
inference. Am Psychol 1980, 35:151-175.
13. Zajonc RB: On the primacy of affect. Am Psychol 1984, 39:117-123.
14. Parrott WG and Sabini J: On the "emotional" qualities of certain
types of cognition: A reply to arguments for the independ-
ence of cognition and affect. Cognitive Ther Res 1989, 13:49-65.
15. Verri AP, Cummins RA, Petito F, Vallero E, Monteath S, Gerosa E and
Nappi G: An Italian-Australian comparison of life quality
among intellectually disabled people living in the
community. J Intellect Disabil Res 1999, 43:513-522.
16. Cummins RA: Objective and subjective quality of life: An inter-
active model. Soc Indicators Res 2000, 52:55-72.
17. Cummins RA: Comprehensive Quality of Life Scale. Adult Man-
ual Fifth Edition Melbourne: Deakin University School of Psychology; 1997.
18. Cummins RA, McCabe MP, Romeo Y and Gullone E: The Compre-
hensive Quality of Life Scale: Instrument development and
psychometric evaluation on tertiary staff and students. Educ
Psychol Meas 1994, 54:372-382.
19. Martin MM and Rubin RB: A new measure of cognitive flexibility.
Psychol Rep 1995, 76:623-626.
20. Huelsman TJ, Nemanick Jr RC and Munz DC: Scales to measure
four dimensions of dispositional mood: Positive energy,
tiredness, negative activation, and relaxation. Educ Psychol
Meas 1998, 58:804-819.
Publish with BioMed Central and every
scientist can read your work free of charge
"BioMed Central will be the most significant development for
disseminating the results of biomedical research in our lifetime."
Sir Paul Nurse, Cancer Research UK
Your research papers will be:
available free of charge to the entire biomedical community
peer reviewed and published immediately upon acceptance
cited in PubMed and archived on PubMed Central
yours — you keep the copyright
Submit your manuscript here:
/>BioMedcentral
Health and Quality of Life Outcomes 2003, 1 />Page 9 of 9
(page number not for citation purposes)
21. Costa Jnr PT and McCrae RR: Neo Five-Factor Inventory Odessa, Fl: Psy-
chological Assessment Resources Inc; 1991.
22. Rosenberg M: Conceiving the self New York: Basic Books; 1979.
23. Blascovich J and Tomaka J: Measures of Self-Esteem. In Measures
of Personality and Social Psychological Attitudes 3rd edition. Edited by:
Robinson JP, Shaver PR, Wrightsman LS, Ann Arbor. Institute for Social
Research; 1993:115-160.
24. Heeps L, Cummins RA and Croft C: The Primary and Secondary Control
Scale Melbourne: Deakin University School of Psychology; 2000.
25. Scheier MF and Carver CS: Optimism, coping, and health:
Assessment and implications of generalized outcome
expectancies. Health Psychol 1985, 4:219-247.
26. Lai JCL: Differential predictive power of the positively versus
the negatively worded items of the life orientation test. Psy-
chol Rep 1994, 75:1507-1515.
27. Headey B and Wearing A: Personality, life events, and subjec-
tive well-being: Toward a dynamic equilibrium model. J Pers
Soc Psychol 1989, 57:731-739.
28. McCrae RR and Costa Jnr PT: Trait explanations in personality
psychology. Eur J Personality 1995, 9:231-252.
29. Cummins RA, Eckersley R, Lo SK, Okerstrom E, Hunter B and Dav-
ern M: Australian Unity Wellbeing Index: Report 6.0 – The Wellbeing of
Australians – The Impact of the Iraq Situation Melbourne: Australian Centre
on Quality of Life, School of Psychology, Deakin University; 2003.
30. Brief AP, Butcher AH, George JM and Link KE: Bottom-up and top-
down theories of subjective well-being: The case of health. J
Pers Soc Psychol 1993, 64:646-653.
31. Mischel W: Personality and assessment New York: Wiley; 1968.
32. Diener E, Suh EM, Lucas RE and Smith HL: Subjective well-being:
Three decades of progress. Psychol Bull 1999, 125:276-302.
33. Caspi A and Roberts BW: Personality development across the
life course: The argument for change and continuity. Psychol
Inq 2001, 12:49-67.
34. Willebrand M, Kildal M, Andersson G and Ekselius L: Long-term
assessment of personality after burn trauma in adults. J Nerv
Ment Dis 2002, 190:53.
35. Germano D, Misajon R and Cummins RA: Quality of life and sense
of coherence in people with arthritis. J Clin Psychol Med S 2001,
8:253-261.
36. Roberts BW and DelVecchio WF: The rank-order consistency of
personality traits from childhood to old age: A quantitative
review of longitudinal studies. Psychol Bull 2000, 126:3-25.
37. Best C, Cummins RA and Lo SK: The quality of rural and metro-
politan life. Aust J Psychol 2000, 52:69-74.