Health and Quality of Life Outcomes BioMed Central Research Open Access The development and pptx
Bạn đang xem bản rút gọn của tài liệu. Xem và tải ngay bản đầy đủ của tài liệu tại đây (351.33 KB, 15 trang )
BioMed Central
Page 1 of 15
(page number not for citation purposes)
Health and Quality of Life Outcomes
Open Access
Research
The development and preliminary validation of a Preference-Based
Stroke Index (PBSI)
Lise Poissant*
1
, Nancy E Mayo
2
, Sharon Wood-Dauphinee
3
and
Ann E Clarke
4
Address:
1
McGill University, Health Informatics Research Group, 1140 Pine Ave West, Montreal, Quebec, H3A 1A3, Canada,
2
McGill University,
Division of Clinical Epidemiology, Royal Victoria Hospital, R4.05, 687 Pine Ave West, Montreal, Quebec, H3A 1A1, Canada,
3
McGill University,
School of Physical and Occupational Therapy, School of Physical and Occupational Therapys, 3630 Promenade Sir-William-Osler, Montréal,
Québec, H3G 1Y5, Canada and
4
McGill University, Division of Clinical Immunology/Allergy and Clinical Epidemiology, Montreal General
Hospital, 1650 Cedar Ave, Montreal, H3G 1A4, Canada
Email: Lise Poissant* - ; Nancy E Mayo - ; Sharon Wood-
Dauphinee - ; Ann E Clarke -
* Corresponding author
StrokePatients' PreferencesHealth Index
Abstract
Background: Health-related quality of life (HRQL) is a key issue in disabling conditions like stroke.
Unfortunately, HRQL is often difficult to quantify in a comprehensive measure that can be used in
cost analyses. Preference-based HRQL measures meet this challenge. To date, there are no existing
preference-based HRQL measure for stroke that could be used as an outcome in clinical and
economic studies of stroke. The aim of this study was to develop the first stroke-specific health
index, the Preference-based Stroke Index (PBSI).
Methods: The PBSI includes 10 items; walking, climbing stairs, physical activities/sports,
recreational activities, work, driving, speech, memory, coping and self-esteem. Each item has a 3-
point response scale. Items known to be impacted by a stroke were selected. Scaling properties
and preference-weights obtained from individuals with stroke and their caregivers were used to
develop a cumulative score.
Results: Compared to the EQ-5D, the PBSI showed no ceiling effect in a high-functioning stroke
population. Moderately high correlations were found between the physical function (r = 0.78),
vitality (r = 0.67), social functioning (r = 0.64) scales of the SF-36 and the PBSI. The lowest
correlation was with the role emotional scale of the SF-36 (r = 0.32). Our results indicated that the
PBSI can differentiate patients by severity of stroke (p < 0.05) and level of functional independence
(p < 0.0001).
Conclusions: Content validity and preliminary evidence of construct validity has been
demonstrated. Further work is needed to develop a multiattribute utility function to gather
information on psychometric properties of the PBSI.
Published: 10 September 2003
Health and Quality of Life Outcomes 2003, 1:43
Received: 27 February 2003
Accepted: 10 September 2003
This article is available from: />© 2003 Poissant et al; licensee BioMed Central Ltd. This is an Open Access article: verbatim copying and redistribution of this article are permitted in all
media for any purpose, provided this notice is preserved along with the article's original URL.
Health and Quality of Life Outcomes 2003, 1 />Page 2 of 15
(page number not for citation purposes)
Background
There is increasing recognition that clinical benefits from
the patient's point of view can best be quantified in terms
of health-related quality of life (HRQL). This concept
emerged in the mid 80's when the need was identified for
a construct that would capture the impairments, func-
tional states, perceptions and social opportunities that can
be influenced by disease [1]. HRQL has been clearly iden-
tified as being influenced by an individual's capacity to
perform and participate in various activities [2–4] and
thus becomes highly meaningful in a disease such as
stroke where the impact is often life-long and multidi-
mensional. One approach to assess HRQL in various pop-
ulations is to use health profiles. Health profiles, whether
generic, like the SF-36 [5] or specific, like the Stroke
Impact Scale (SIS)[6] have been used in many studies of
stroke[7–11]. They are useful in identifying the extent by
which health status is affected and, more precisely, in
identifying the dimensions where the difficulties arise.
However, the scoring systems of health profiles are often
developed on the basis of sub-scales with no single sum-
mary score of overall health status. The absence of a sum-
mary score complicates the use of health profiles, like the
SF-36, in studies where cost is an issue. Indeed, would an
intervention be qualified as being cost-effective if it had a
positive impact on physical health but a negative one on
mental health? Unless one would know the relative
importance attached to both dimensions, it would be
impossible to conclude on an overall net improvement or
deficit of HRQL. The complication of using health profiles
becomes quite evident, the intervention is cost-effective
on one hand but not on the other, should the intervention
be offered or not?
Also available are health indexes that portray the HRQL of
an individual on selected domains that are weighted to
reflect the person's preferences. Recognizing the impor-
tance of integrating the person's value system [12] in the
assessment of one's HRQL, health indexes go one step fur-
ther than health profiles. This portrait of health is
assigned a value ranging from 0 (death) to 1 (perfect
health). This value is assumed to represent the preference
an individual has for this health state and it can be
obtained using different elicitation techniques, the most
common being the standard gamble (SG), time trade-off
(TTO) and visual analog scales (VAS). Preference scores
obtained under risk and uncertainty are called "utilities"
while those elicited without these conditions are called
"values".
Generic health indices, like the Health Utilities Index
(HUI) [13,14], the EuroQoL (EQ-5D index) [15,16] or the
Quality of Well-Being (QWB) [17] scales, have been
developed to provide a classification of health states
weighted on the basis of individuals' preferences. Each
health state generated by any of the scales is associated
with a single comprehensive score. Studies in stroke have
reported a more frequent use of the EQ-5D [9–11,18–20]
compared to the HUI2 or HUI3 [21,22], perhaps due to
the shortness and ease of completeness of the EQ-5D
index compared to the latest versions of the HUI, either
the HUI2 or HUI3. To date, no studies in stroke have
reported the use of the QWB.
While both measures, the HUI (HUI2 or HUI3 versions)
and the EQ-5D index demonstrate good psychometric
properties [9,20–22], they lack content validity for use
with the stroke population. Indeed, the HUI is more
'impairment' oriented and neglects the activity compo-
nent of health as defined by the World Health Organiza-
tion[23], while the EQ-5D index does not include certain
problems that are prevalent in stroke survivors, such as
speech [24] and cognition [25–27]. Further, there is some
evidence of a ceiling effect of the EQ-5D when used with
the stroke population. [11].
While a few disease-specific health indices have been
developed during the past few years [28,29], there has not
been one for stroke. The need for a stroke health index has
been recognized for several reasons. First, with its rela-
tively stable incidence rate and declining mortality [30],
stroke is expected to remain one of the most prevalent
chronic diseases in the aged, generating high costs for our
health care system. Second, new stroke treatments (e.g.
drug therapy) are emerging and their impact will need to
be measured. Third, with the aging of the population,
stroke is only one among many health conditions our
health system will need to deal with in future years. With
ongoing financial constraints in the health sector,
resource allocation will become highly competitive. By
definition, generic health indices provide a common met-
ric upon which treatments across or among diseases can
be compared, favoring an equitable allocation of
resources, but in practice, these comparisons remain chal-
lenging and somewhat, controversial.
Our objective was to develop a stroke-specific health
index that would take into account the person's prefer-
ences for stroke relevant health states. This paper outlines
the process used to develop and evaluate the first prefer-
ence-based stroke index, the PBSI, for use as a comprehen-
sive measure of HRQL post-stroke and as an outcome in
cost-effectiveness studies.
Subjects and methods
The PBSI was developed by a series of steps. Different sam-
ples of subjects were used for each of these steps. Table 1
describes the population sources and socio-demographic
characteristics of subjects for each step of the study.
Health and Quality of Life Outcomes 2003, 1 />Page 3 of 15
(page number not for citation purposes)
Development of the PBSI
Item generation
The first step was to identify items that were prevalent, yet
specific, to the stroke population. The data for this step
came from a longitudinal cohort study of the long-term
outcome of stroke. [31]. At the time of this study, 493 per-
sons with stroke had been interviewed approximately 6
months post-stroke and followed intermittently over
time. In parallel, a population-based sample of 442 com-
munity dwelling individuals without stroke, frequency
matched by age and city district, was also recruited and
interviewed. Both groups (stroke and controls) were inter-
viewed over the telephone on measures of disability and
HRQL: SF-36 [4], EQ-5D, Barthel Index [32], IADL Sub-
scale and Social Resource Scale of the OARS [33], Reinte-
gration to Normal Living Index [34], and Modified Mini
Mental Status Questionnaire [35].
Collectively, these scales contained 92 items and the rat-
ings on these items were used to identify prevalent and
stroke-specific items. Items were retained if they met the
following criteria: 1) prevalence (i.e. defined as an identi-
fied difficulty) in at least 20% of stroke subjects, 2) a sig-
nificant difference in prevalence between stroke and
controls, and 3) a φ coefficient of 0.300 or more, indicat-
ing a significant association between the prevalence of the
problem and having a stroke [36]. Items describing the
same activity were removed to avoid redundancy. In addi-
tion, 13 items covering areas of mastery, cognition, dex-
terity, driving and communication were added in order to
cover the full spectrum of activities, participative experi-
ences and emotions known to be affected by stroke. This
process provided our first pool of 43 items.
Item selection
These items were assembled into a questionnaire. Mem-
bers of the longitudinal cohort study who were more than
two years post stroke and living in the community were
asked to rate their performance on each of these items
using a standard five-point scale from 1; having no diffi-
culty to 5; being unable to do it. Subsequently, they were
asked to rate the importance of these items to their overall
quality of life also on a five-point scale from 1; not impor-
tant to 5; extremely important. They were also asked to
report any additional activities, roles or emotional states
they felt had been impacted upon by their stroke. An
impact score, formed as the product of performance and
importance, was calculated [37] and the 43 items were
ranked according to this impact score. In total, 149 sub-
jects received the performance questionnaire and from
that group, 124 were also sent the one on importance; 91
and 70 persons responded to these questionnaires, respec-
tively. From this survey, items with an impact scores > 6.0
and with a proportion of at least 40% of stroke subjects
reporting some difficulty, were selected. To further reduce
this set of items, correlational analyses were performed.
Correlations above 0.75, identifying possible redundancy,
were carefully considered and the item presenting the
lowest item-to-total correlations was removed. Items gen-
erated by subjects were used to assess whether or not
important or difficult activities, roles or emotions were
missing from our first pool of 43 items.
Development of the three-point scale
In order to facilitate ease of completion, a three-point
scale was the goal. Descriptive statements reflecting three
different levels of observable functions of community liv-
ing stroke survivors were generated for each of the remain-
ing items. For example, the worst level of the walking item
was described as being able to walk only a few steps or
Table 1: Population sources and sample characteristics by age, gender, functional independence, physical and mental health.
Steps Population Source Age (mean/sd) Gender (men/women) (%) Barthel score of
100 (%)
SF-36 PCS
(mean/sd)
SF-36 MCS
(mean/sd)
Item generation Baseline data from cohort
study[30]
Stroke subjects (n = 493) 70/12 61/39 57% 42/10 51/9
Control subjects (n = 442) 65/12 33/67 93% 45/11 52/9
Item selection Mailed survey
Stroke subjects (n = 91) 69/11 71/29 76% 49/8 52/8
Pilot test Mailed survey
Stroke subjects (n = 68) 72/12 53/47 65% 45/12 49/11
Elicitation of
preference weights
Face-to-face interviews
Stroke subjects (n = 32) 68/11 75/25 Not evaluated Not evaluated Not evaluated
Caregivers (n = 28) 59/20 22/78
Validation Baseline and 6 month data
from randomized control trial
[Mayo et al, unpublished work]
Stroke subjects (n = 91) 69/15 64/36 75% 43/12 50/11
Health and Quality of Life Outcomes 2003, 1 />Page 4 of 15
(page number not for citation purposes)
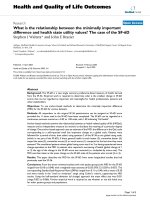
using a wheelchair. Because of the specificity of each
descriptive statement for a given item, ordinality of the 3-
point scale was tested. A convenience sample of 29 under-
graduate students rated each descriptive statement on a 10
cm long visual analog scale (VAS) [38]. Anchors varied in
relation to the item. For example, the anchors for the
walking statements were 0=unable to walk and 10= able
to walk normally. Since there were 10 items with 3
descriptive statements each, students were asked to rate 30
randomly organized statements. Following comments
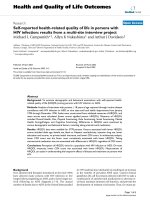
and ratings, some statements were reworded. Figure 1
shows the mean VAS ratings.
Pilot testing the PBSI
We pilot tested the PBSI to determine if it demonstrated
large inter-subject variation and compared this to that of
a generic health index, the EQ-5D. Frequency distribu-
tions of subjects' ratings across response levels were exam-
ined. An item that was distributed across levels was judged
to be contributing valuable information to the measure
and this performance was considered as a preliminary
indication of its ability to capture different severity levels.
Community dwelling long-term stroke survivors who had
ended their participation in the two-year prospective
study on stroke, and who had not participated in the first
phase of this project were sent the PBSI, the EQ-5D 5-item
questionnaire and its thermometer scale (EQ-VAS). In
total, 170 subjects were surveyed but only 68 responded;
subsequent follow-up revealed that 9 had moved, 8 were
deceased and 85 refused or could not be reached. The
overall participation rate was 41%, all were living in the
greater Montreal area and 53% were men (Table 1).
Elicitation of preference weights
Preferences were obtained to verify the ability of stroke
survivors to go through a task of preference elicitation,
Mean VAS rating scores of response options on English questionnaires (n = 29)Figure 1
Mean VAS rating scores of response options on English questionnaires (n = 29)
012345678910
Walking
Stairs
Phys. Act
Rec. Act
Work
Driving
Memory
Speech
Coping
Self-Esteem
Mean VAS ratings
Best response option Middle response option
Worst response option
Health and Quality of Life Outcomes 2003, 1 />Page 5 of 15
(page number not for citation purposes)
and to estimate whether stroke survivors differed from
persons without stroke when providing the weights.
Thirty subjects with stroke and 30 caregivers were esti-
mated to be sufficient to detect a between-group differ-
ence of 0.10 in mean preference values with
approximately 90% power and an alpha level of 0.05
assuming a standard deviation of 0.13 or less. An analysis
based on ranks was also carried out. It was hypothesized
that if subjects positioned the 9 corner states (CS) – a cor-
ner state is a multidimensional health state in which all
items are described by their best level while one item is set
at its worst level – on the thermometer in a similar order,
the preference weight given to each corner state would be
reinforced and to a certain degree, confirmed. For exam-
ple, subject 1 could choose to position the corner states
within a range of 30 to 70 while subject 2 could use a
range between 45 and 80. But if both subjects placed the
same corner state as their lowest value, then the preference
for this corner state would be confirmed, even though it
would have a large standard deviation due to differences
in ratings (30 vs 45). Preferences were elicited on a con-
venience sample of 32 persons who had recently sus-
tained a stroke (6 weeks to 6 months previously) and 28
caregivers who were participants in a randomized clinical
trial of case management for stroke. The mean age of
stroke subjects was 67.6 (sd = 11.3) and 75% were men.
Caregivers were on average younger (59.4 (sd = 19.7)) and
22% were men (Table 1). Selection criteria for this prefer-
ence elicitation task restricted the sample to those who
could speak French or English, without apparent cognitive
deficits or aphasia.
Face-to-face interviews were conducted at the home of the
subject by one interviewer. On average, 10 to 15 minutes
were required to do the task. To reduce contamination,
the caregiver was asked to leave the room while the stroke
subject was performing the task and vice-versa. Subjects
were given a 50 cm long vertical thermometer with
anchors ranging from 0, worst possible health state to
100, best possible health state. To test the subject's com-
prehension of the task, two unidimensional health states
(HS) were given as practice. Each subject received 'I wear
glasses' and 'I have severe pain all day' and was asked to
place these health states on the thermometer in relation to
the anchors. If the subject was unable to perform this task
or gave an incoherent answer (it is assumed that wearing
glasses is a more desirable health state and should, there-
fore, be positioned above having severe pain), further
instructions were given. If comprehension difficulties per-
sisted, the task was ended. If the subject succeeded, prefer-
ences were assessed for the set of health states. Subjects
were asked to rate four HS and nine corner states (CS). The
four HS described the following; being dead, being uncon-
scious, all best levels of items in the PBSI, all worst levels of
items. While there are 10 items on the PBSI, only 9 CS
were described. Walking and stairs were combined to
avoid an unrealistic statement like. The ratings of corner
states are essential components of multi-attribute utility
models and considered easier to understand and rate than
the positive attribute itself.
For example, the corner state of the speech item is the
following;
I can hardly be understood by anyone when I speak
But I can
;
Walk in the community as I desire
Go up and down several flights of stairs
Do all sports and physically demanding activities I used to
Participate in all recreational activities I wish
Perform my work/activities as I used to
Drive a car anywhere, as I used to
Remember most things
Cope with life events as they happen
Be satisfied with myself most of the times
The development of a preference-weighted cumulative
index
The development of a preference-weighted cumulative
scoring system became essential to compare scoring distri-
butions and to test correlational evidence of validity. The
interval properties of the response scales of the items in
the PBSI were such that a simple index based on assigning
values to levels and summing could be used for compara-
tive purposes. The preference weights were incorporated
into the index to create a temporary preference-weighted
cumulative PBSI. To be aggregated into a single score,
items within a measure must demonstrate they share a
common structure with the construct of interest [39]. We
tested the presence of a hypothesized common structure
across the items through a factor analysis. An ideal situa-
tion would be to have all items under one single factor, or
if this cannot be attained, item-to-total correlations above
0.4 are desirable [39] and to have items with similar
means and standard deviations [40].
Data on the PBSI, available for 127 subjects who were par-
ticipants in a randomized clinical trial of case manage-
ment for stroke [Mayo et al, unpublished work], were
used to conduct the factor analysis. Data were collected at
Health and Quality of Life Outcomes 2003, 1 />Page 6 of 15
(page number not for citation purposes)
baseline (within seven days post-discharge from hospi-
tal), at 6 weeks and at 6 months post-discharge. A variety
of outcomes, including HRQL, physical and social func-
tioning as well as mental or emotional status, were
assessed via face to face interviews. This analysis used the
6 month post-discharge data obtained on the PBSI.
Subjects were, on average, 71 ± 13.7 years of age and most
were men (59%). This sample size was large enough to
respect the 10:1 ratio (subjects per variable) considered a
minimal requirement to obtain a "good" factorial analysis
[40].
Preliminary validation of the measure
By six months post-stroke, motor and functional recovery
plateaus in most individuals, resulting in a stable health
status [41]. Complete data on HRQL and functional
measures were available on ninety-one subjects. Subjects
were primarily men (64.4%) and on average, aged 69.4 ±
15.5 years. Most had no limitations in their ADL (mean
Table 2: Mean impact scores of 43 items* from mailed survey of long-term stroke survivors
Item/Activity Impact score(sd) Performance (sd) Importance (sd)
Having control over life 14.03 (6.57) 3.15 (1.41) 4.41 (1.10)
Having an excellent health 12.91 (6.63) 2.80 (1.27) 4.43 (0.91)
Coping with life problems 11.98 (5.77) 2.69 (1.27) 4.55 (0.89)
Having a lot of energy 11.04 (6.69) 2.60 (1.33) 4.11 (1.15)
Performing work as easily as before 10.08 (6.84) 1.98 (1.36) 4.18 (1.07)
Being satisfied with self 9.95 (5.74) 2.20 (1.18) 4.38 (1.04)
Doing vigorous activities 9.35 (6.88) 3.47 (1.53) 2.94 (1.49)
Doing same amount of work as before 9.35 (6.67) 2.72 (1.55) 3.57 (1.26)
Accomplishing as much as desired 9.25 (6.92) 2.58 (1.50) 3.73 (1.29)
Doing any kind of work 9.24 (7.11) 2.56 (1.48) 3.69 (1.24)
Climbing many flight of stairs 8.57 (6.04) 2.88 (1.42) 3.27 (1.48)
Managing stairs 8.34 (5.39) 2.24 (1.20) 3.88 (1.29)
Recalling names of persons, 8.14 (4.82) 1.91 (0.97) 4.14 (1.17)
Walking several blocks 8.13 (6.69) 2.34 (1.49) 3.70 (1.40)
Walking more than a km 7.92 (6.48) 2.74 (1.65) 3.30 (1.58)
Going to places out of walking distances 7.91 (6.44) 2.38 (1.57) 3.59 (1.40)
Doing work as carefully as usual 7.85 (6.50) 1.98 (1.36) 4.18 (1.07)
Remembering usual things 6.98 (4.36) 1.55 (0.87) 4.36 (1.09)
Participating in recreational activities 6.97 (5.74) 2.00 (1.30) 3.58 (1.34)
Driving a car 6.93 (6.33) 2.44 (1.82) 3.78 (1.70)
Taking trips out of town 6.82 (5.69) 2.23 (1.54) 3.45 (1.55)
Lifting/carrying grocery 6.70 (5.58) 2.19 (1.42) 3.26 (1.47)
Walking on a level surface 6.58 (4.86) 1.72 (1.04) 3.94 (1.43)
Grasping and handling 6.58 (4.74) 1.54 (0.97) 4.29 (1.18)
Taking a bath/shower 6.56 (5.18) 1.57 (1.17) 4.31 (1.23)
Shopping for grocery/clothes 6.54 (5.53) 1.87 (1.41) 3.63 (1.32)
Registering new information 6.45 (3.96) 1.62 (0.91) 4.07 (1.16)
Moving around community 6.44 (5.09) 2.02 (1.34) 3.56 (1.43)
Reading ordinary newsprint 6.38 (5.56) 1.65 (1.21) 3.98 (1.32)
Being understood by those who know you 6.28 (4.25) 1.34 (0.83) 4.46 (1.08)
Getting dressed/undressed 6.26 (4.48) 1.46 (0.99) 4.45 (1.14)
Concentrating for 20 min. 6.17 (4.73) 1.67 (1.10) 3.85 (1.27)
Being understood by strangers 6.17 (3.92) 1.42 (0.82) 4.46 (1.08)
Being occupied in an important activity 6.16 (4.87) 1.82 (1.26) 3.75 (1.23)
Solving day to day problems 6.07 (4.18) 1.46 (0.92) 4.23 (0.99)
Understanding a conversation with 1 person 5.92 (3.79) 1.32 (0.70) 4.31 (1.25)
Doing own personal hygiene 5.91 (4.07) 1.39 (0.91) 4.44 (1.22)
Following a conversation with 3 persons 5.83 (3.76) 1.46 (0.81) 3.91 (1.28)
Feeding 5.83 (4.10) 1.42 (0.94) 4.27 (1.29)
Preparing own meals 5.83 (5.83) 1.78 (1.39) 3.37 (1.49)
Participating in social activities 5.56 (4.85) 1.80 (1.33) 3.58 (1.32)
Doing own housework 5.55 (5.69) 1.94 (1.43) 2.94 (1.44)
Doing moderate activities 5.00 (5.27) 2.01 (1.48) 2.69 (1.45)
* best possible score not reached on each item
Health and Quality of Life Outcomes 2003, 1 />Page 7 of 15
(page number not for citation purposes)
Barthel Index score = 95.5 ± 12.1). Both the Physical (PCS
= 43.5 ± 11.6) and Mental (MCS = 50.2 ± 10.9) Compo-
nent Summary Scores of the SF-36 (PCS and MCS) were
slightly below age-standardized Canadian norms (PCS
norm = 47.2, MCS norm = 53.7).
Construct validity
Construct validity can be seen as the extent to which the
measure is consistent with its theoretical framework. In
this study, convergent and known-groups approaches
were used to examine construct validity. For comparison
purposes, a utility value was calculated for the EQ-5D
index using United Kingdom (UK) weights [42] for health
states lasting 10 years.
Convergent validity
Convergent validity was demonstrated through testing a
priori hypotheses comparing the PBSI with an instrument
measuring a similar construct, the SF-36. Correlations
above 0.60 were identified as reflecting a strong associa-
tion [33]. Higher coefficients were not necessarily desired
as these would indicate strong similarity between the
measures. Conversely, lower coefficients would indicate
that measures were assessing different constructs. It was
expected that the PBSI would correlate moderately (.4 <r
< .6) with the physical functioning, role physical, social
functioning, general health perceptions and vitality scales
of the SF-36. Lower correlations (r < .4) were expected for
the pain, mental health index and role emotional scales as
these domains are not directly measured by the PBSI.
Known-groups validity
Results obtained from two distinct groups of individuals
known to differ in the construct being assessed were used
to assess the validity of the PBSI. Neurological status in
the acute phase of stroke, as measured by the Canadian
Neurological Scale [44], was used to define two groups.
While no relationship had been established between
severity of neurological status at stroke onset and HRQL at
6 months post-stroke, we know that individuals with a
severe stroke are more likely to have long-term activity
limitations [44] and consequently, to experience a lower
HRQL. Subjects were also grouped according to their
functional autonomy as measured by the Barthel Index.
The Index is known to be a predictor of functional recov-
ery and discharge destination [45], both outcomes being
likely to affect HRQL We first hypothesized that at 6
months post-stroke, subjects with severe neurological def-
icits at onset of stroke (score < 9 on the CNS) will have
lower scores on the PBSI than subjects presenting with
very mild or no deficits at onset (CNS score of 11 and
11.5), and second, that stroke subjects presenting a
marked dependence in functional activities (Barthel Index
score of = 60) will have a significantly lower PBSI score
than those who are fully independent in functional activ-
ities. Student's T-tests were performed to compare mean
scores of subjects.
Results
Development of the instrument
Only 30 of the 92 items included in our initial pool of
items were found to be significantly impacted by a stroke
in terms of prevalence. When surveyed on the importance
and performance of each of these 30 items and the 13
items added to cover the full spectrum of activities and
emotions known to be affected by stroke, long-term
stroke survivors rated as high impact (importance * diffi-
culty) most items, omitting only eight of them (refer to
table 2). Two referred to activities of daily living; feeding
and performing personal hygiene and in both cases,
importance scores were very high (4.27 ± 1.29 and 4.44 ±
1.22 respectively), but these items were discarded because
of their low performance scores (1.42 ± 0.94 and 1.39 ±
0.91 respectively) indicating that they were not reported
as difficult activities. Similar results were found for two
speech-related items, (understanding a conversation with
one person and following a conversation with three per-
sons), where scores of importance were very close to 4.00
but few people rated these as difficult. This lead to the
rejection of these two items. Two IADL activities were also
dropped because of low performance and importance
scores; preparing meals and doing own housework.
Finally, participation in social activities as well as per-
formance of moderate activities were discarded because of
a low impact score.
Most items derived from the literature [24,46,47] gener-
ated high impact scores and a large majority of them were
kept. The remaining 35 items were then analysed in terms
of their frequency distributions on the performance ques-
tionnaire. Only 12 items were removed because they were
not often reported to be difficult to perform by long-term
stroke survivors. A correlation matrix was built using the
23 performance-rated items. Mobility-related items were
scrutinized to avoid redundancy. For this reason only one
stair climbing item and one walking item were kept. A
work item merging both the "quantity" and the "quality"
of work was developed.
A speech item was forced into the measure for content
validity. Aphasia may severely limit an individual in the
accomplishment of his activities and restrict participation.
This limitation in speech was not a prevalent difficulty
among the group of subjects surveyed, yet, was identified
as very important in this study and in others [48,49]. The
items performing vigorous activity and performing moderate
activities (from the SF-36) were both rated as not impor-
tant by respondents yet a large proportion of subjects gen-
erated items related to vigorous sports or hobbies that are
physically demanding. An item related to performing
Health and Quality of Life Outcomes 2003, 1 />Page 8 of 15
(page number not for citation purposes)
sports and physically demanding activities was, therefore,
used to encompass a mixed concept of vigorous and moder-
ate activities. A total of ten items, with inter-items correla-
tions ranging between 0.216 and 0.719, all significant at p
< 0.01 (Table 3), were kept in the final version of the PBSI.
Pilot study
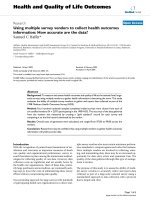
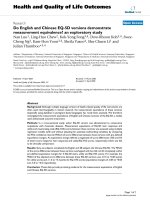
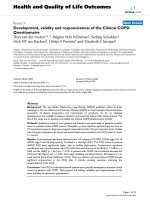
The PBSI demonstrated a good capacity to capture differ-
ent health states. Figures 2 and 3 illustrate the distribution
of responses across levels on each item of the PBSI and the
EQ-5D respectively. Three items showed poor distribu-
tion of responses across levels – speech, memory and self-
esteem: rarely did subjects report severe difficulties in
these areas. This finding was not surprising considering
that these subjects were long-time community-dwelling
stroke survivors. However, contrary to the mobility item
of the EQ-5D response option '3' (being bedridden), the
three mobility items of the PBSI were likely to be scored
on each possible level, assuming a more diverse
population of stroke survivors in which various severity
levels would be captured.
Among respondents, 17 rated their HRQL with a perfect
EQ-5D score (11111). Of these, 7 subjects also scored 1
(or best level) on all of the 10 items of the PBSI. The mean
EQ-VAS value for this group of subjects (perfect score on
both EQ-5D and PBSI) was 85.6 (sd = 9.1). However, 10
subjects who scored perfectly on the EQ-5D reported
having some limitation in at least one of the 10 items of
the PBSI. These non-perfect PBSI ratings were associated
with a mean EQ-VAS value of 72.4 (sd = 12.4). This differ-
ence is important and highlights the capacity of the PBSI
to discriminate subjects with activity limitations from
those with no activity limitations as well as the impact of
these limitations on the individual's overall rating of his/
her HRQL.
Preference weights
In total, 67 persons were asked to complete the task; 7
could not manage the example and, therefore, were not
asked to continue. Most subjects who failed the example
task appeared unable to imagine someone else in the sit-
uation they were presented and asked to rate. They tended
to refer to their situation only. Table 4 shows means and
medians of each health state for both groups of subjects.
For each subject, the health states were ranked according
to their value on the VAS. Both stroke subjects and caregiv-
ers reported speech to be the domain that would most
severely affect their HRQL if it became limited following a
stroke (disutility = 0.34). On most domains, caregivers
and subjects reported similar values (see Table 4). Five
subjects (4 stroke subjects and one caregiver) rated the
health state being dead as 100. They were prompted to rate
death as if they were to die that day. Each of them
expressed they were not afraid of dying and if it were to
happen in the very near future, they would consider this
event as positive. This high preference for death was not
shared by the majority of subjects who rated death as 0.
The rating of the corner state coping was more highly
variable than any other corner states. Coping is a relatively
abstract construct and may, therefore, be more difficult to
imagine. Both caregivers and subjects rated the 'all worst
levels' which can be seen as a description of a severe stroke
health state, below 0.20 (mean 0.15 ± .09). Driving was
the only domain where differences in mean scores
between stroke and caregivers reached statistical
significance (p < 0.049). These differences cannot be
explained by the proportion of drivers in each group
(60% of stroke subjects were drivers compared to 83% of
caregivers) but could be explained by the large proportion
of women in the caregiver group (78%). Even though
most of them were drivers, many performed this activity
occasionally, leaving most of the driving to their spouses.
Table 3: Inter-item correlation coefficients on PBSI
Walking Stairs Physical
activities
Recreational
activities
Work Driving Memory Speech Coping Self-esteem
Walking 1.00 .665 .602 .571 .603 .305 .335 .414 .324 .271
Stairs 1.00 .466 .348 .420 .280 .443 .541 .379 .224†
Physical activities 1.00 .749 .710 .419 .300 .271 .397 .395
Recreational activities 1.00 .662 .275 .333 .215† .414 .384
Work 1.00 .423 .263 .345 .434 .360
Driving 1.00 .063† .139† .095† .292
Memory 1.00 .365 .573 .485
Speech 1.00 .372 .358
Coping 1.00 .528
Self-esteem 1.00
Unless otherwise indicated all p values are < 0.05, † p > 0.05
Health and Quality of Life Outcomes 2003, 1 />Page 9 of 15
(page number not for citation purposes)
The expected ranking of corner states was determined
from mean preference weights obtained from the overall
sample. Since preference weights did not statistically differ
between stroke subjects and caregivers, data from both
groups were merged to provide one large sample size of 60
subjects. Friedman's Chi-square was significant indicating
that there is a general association between corner states
mean scores and their ranks (p = 0.0001). This empha-
sizes that both groups of subjects rated the health states in
a consistent manner.
Development of a preference-weighted cumulative index
score
Loadings of items are reported in Table 5 as well as item
means and standard deviations. All items except the one
on physical activity/sport have mean values very close to
one another and standard deviations within a similar
range. With an unweighted variance of 35.6%, a one-fac-
tor model probably does not provide the best fit with the
data, yet, 9 out of 10 items have loading weights above the
required value of 0.4 [39]. The homogeneity of the 10
items was reinforced by an internal consistency estimate
of 0.84 (Cronbach's alpha). Only driving with a very low
weight of 0.15, has a weak contribution to the overall var-
iance of the factor. The fact that this single item appears to
contribute minimally to the measure did not preclude its
inclusion on the PBSI. Loading weights obtained from the
factor analysis were not used as weight for the response
options of the pBSI, rather, as each item on the PBSI is
scaled by a 3-point response set that was shown to have
reasonably equal intervals (Fig. 1). An unweighted scoring
system would calculate a move from one response option
to another on two different items as contributing similarly
to the overall HRQL score. The interval property of
response options was used to assign weights to each
response options, so that a move from '1' to '2' on two
Distribution of responses (%) on items in the PBSI among a group of community-dwelling stroke survivors (n = 68)Figure 2
Distribution of responses (%) on items in the PBSI among a group of community-dwelling stroke survivors (n = 68)
0
20
40
60
80
100
Walking Stairs Phys.
Act
Rec.Act Work Driving* Memory Speech Coping Self-
Esteem
level 1 (no problem) level 2 (moderate problem)
level 3 (severe problem)
Proportion of
subjects (%)
Health and Quality of Life Outcomes 2003, 1 />Page 10 of 15
(page number not for citation purposes)
items would not yield a similar reduction in the overall
HRQL. We hypothesized that the preference weights
obtained for each item on the PBSI would follow the same
interval pattern and be equally spaced. Therefore, a person
with a '3' on the speech item (disutility of 0.33) would
lose 6.7% of the overall HRQL compared to a lost of 4.4%
with a '3' on recreational activities, assuming all other
items being scored as perfect. A move from a '3' to a '2' on
each of these items would then result in a gain of 3.35%
and 2.2% for the speech and recreational activity items,
respectively. The scoring formula was recalibrated so that
a person with no limitations would obtain the highest
possible score, that is, 1.0, while the person presenting the
worst possible health state would obtain a PBSI score of 0.
Validation of the measure
Convergent validity
Pearson correlation coefficients are presented in Table 6.
Correlations between the PBSI and most of the SF-36 sub-
scales were moderately high and significant (p 0.005). The
PBSI correlated moderately with the bodily pain (BP) (r =
0.48) and mental health (MH) (r = 0.44) subscales of the
SF-36. The lowest correlation was with the role emotional
(RE) subscale of the SF-36 (r = 0.33). This subscale has
been shown to correlate poorly with other HRQL meas-
ures [11,49] and was recently identified as having a strong
ceiling effect which would limit its value in stroke studies
[50]. As anticipated, the EQ-5D index performed better
than the PBSI on only two domains, BP (r = 0.69) and RE
(r = 0.35), which are directly assessed by the EQ-5D and
not the PBSI. A moderately high correlation was found
between the PBSI and the EQ-5D index score (r = 0.76).
When both measures were correlated to the EQ-VAS score,
Distribution of responses (%) on items of the EQ-5D among a group of community dwelling stroke survivors (n = 68)Figure 3
Distribution of responses (%) on items of the EQ-5D among a group of community dwelling stroke survivors (n = 68)
0
10
20
30
40
50
60
70
80
90
100
Mobility Self-Care Usual.Act Pain Anx.Dep
level 1 (no problem) level 2 (moderate problem)
level 3 (unable to or severe problem)
Proportion of
subjects
(%)
Health and Quality of Life Outcomes 2003, 1 />Page 11 of 15
(page number not for citation purposes)
Table 4: Mean disutility values (0 to 1) of 9 corner states (CS) and 4 specific health states (HS) obtained from stroke subjects and
caregivers.
Corner States
(CS)/Health states
(HS)
Stroke subjects N = 32 Caregivers N = 28
Mean(sd) Median Mean(sd) Median p-value
CS – Speech 0.32 (0.12) 0.30 0.35 (0.17) 0.30 0.296
CS – Memory 0.38 (0.18) 0.30 0.40 (0.21) 0.40 0.531
CS – Self-Esteem 0.41 (0.16) 0.39 0.46 (0.21) 0.46 0.173
CS – Walk 0.43 (0.22) 0.40 0.50 (0.21) 0.48 0.129
CS – Work 0.55 (0.22) 0.60 0.44 (0.23) 0.40 0.158
CS – Recreational
Activities
0.60 (0.15) 0.60 0.55 (0.23) 0.50 0.576
CS – Coping 0.56 (0.21) 0.58 0.61 (0.21) 0.63 0.361
CS – Driving 0.58 (0.26) 0.63 0.68 (0.22) 0.70 0.049
CS – Physical
Activities.
0.64 (0.18) 0.70 0.69 (0.22) 0.77 0.298
HS – Death 0.14 (0.33) 0 0.04 (0.19) 0 0.143
HS – Unconscious 0.05 (0.06) 0 0.09(0.20) 0.05 0.269
HS – All Best 0.92 (0.08) 0.90 0.94(0.06) 0.95 0.191
HS – All Worst 0.15 (0.10) 0.11 0.14 (0.08) 0.10 0.392
Table 5: Descriptive statistics of items entered in a one-factor model (n = 127)
One – Factor Model
Items Loadings Mean score (SD)
Walking 0.81 1.4 (0.56)
Recreational activities 0.76 1.7 (0.75)
Stairs 0.75 1.4 (0.57)
Physical activities/Sports 0.73 2.2 (0.78)
Working 0.74 1.9 (0.84)
Coping 0.49 1.3 (0.53)
Speech 0.45 1.2 (0.42)
Memory 0.44 1.5 (0.63)
Self-esteem 0.49 1.3 (0.62)
Driving 0.15 1.4 (0.74)
Table 6: Pearson's product moment correlations between the PBSI and the SF-36 subscales in comparison with the EQ-5D
PF RP BP GH VT SF RE MH EQ-VAS
PBSI .78 .47 .48 .56 .67 .64 .32 .40 .68
EQ-5D .60 .38 .61 .54 .53 .38 .35 .36 .62
PF – Physical Functioning RP – Role Physical BP – Bodily Pain GH – General Health VT – Vitality SF – Social Functioning RE – Role Emotional
MH – Mental Health
Health and Quality of Life Outcomes 2003, 1 />Page 12 of 15
(page number not for citation purposes)
the PBSI performed slightly better (r = 0.68) than the EQ-
5D index (r = 0.62).
Known-groups validity
When subjects were divided according to the severity of
their stroke, those presenting with a severe stroke at onset
(CNS score <9) reported a much lower PBSI score (0.67)
compared to those who had a very mild stroke (CNS score
>11) who obtained a mean PBSI score of 0.81 (p < 0.05)
(Table 7).
Differences in PBSI scores for subjects who presented
major difficulties performing their ADL (PBSI score of
0.47) compared to those reporting moderate difficulties
(PBSI score of 0.57) and to those with no difficulty (PBSI
score of 0.82) were statistically significant (p < 0.0001)
(Table 7). This difference would also be considered as
clinically meaningful [51]. However, because a very small
number of subjects had a Barthel Index score less than 60,
statistical significance could not be reached when this
group was compared to the intermediate functioning
group.
Discussion
The PBSI is a 10-item stroke specific health index devel-
oped for economic purposes, more specifically as an out-
come for use in cost-effectiveness studies [see Additional
file 1]. The PBSI encompasses the most important and
commonly impacted domains of HRQL in relation to
stroke. It generates 59,049 multidimensional health
states, each defined by a preference-weighted cumulative
score which captures the losses and gains in the various
health components affected by stroke. The PBSI is short
and easy to administer. It is available in Canadian French
and English.
As the first stroke-specific health index, content validity
was a priority. Major efforts were made to ensure the selec-
tion of the most appropriate sample of items to describe
HRQL post stroke. Content validity is recognized as a cru-
cial component of instrument development. The methods
used to develop the content of the PBSI combined differ-
ent procedures that have been used previously in the
development of HRQL instruments, including the estima-
tion of impact scores [37] and the generation of items felt
to be impacted upon by stroke survivors [52]. This meth-
odology optimized the content validity of the PBSI. These
domains have been recognized by other developers to be
meaningful post-stroke [6,53].
The wide spectrum of PBSI scores obtained in the popula-
tion studied indicates that a large number of different
health states can be captured by the PBSI and confirms
that the measure does not have a ceiling effect, nor does it
have a floor effect. This evidence was reinforced by com-
paring the PBSI scores with those of the EQ-5D-index.
Our results demonstrated a ceiling effect in the EQ-5D-
index, which had not been previously identified in stroke
studies [10,11] but had been reported in other popula-
tions [54,57]. The absence of a ceiling effect in a high
functioning group of individuals is another indication of
the validity of selected domains and response options.
Contrary to the EQ-5D-index, where very few, if not any,
stroke survivors will choose the response option 3 on the
mobility item, the PBSI offers respondents the possibility
on each item, of choosing among three option levels that
are realistic or likely to occur following a stroke. The fact
that even community living stroke survivors chose the
most severe response option (option 3) on each of the 10
items is quite promising for future performance of the
PBSI in a more heterogeneous group of stroke subjects.
Convergent validity was demonstrated through correla-
tion of the PBSI with a generic health status measure, the
SF-36. Only the Role Physical scale of the SF-36 did not
exactly reach the desired correlation (r = 0.48). The largest
correlation was with the physical functioning scale of the
SF-36. This was not a surprise as the items walking, stairs
management, and the physically demanding activities/sports
on the PBSI were generated from the SF-36 questionnaire.
Table 7: Mean scores (sd) of PBSI by Barthel Index scores and stroke severity categories
PBSI score Mean (sd)
Barthel Index score
0–60 (n = 4) 0.47 (0.39)
65–95 (n = 18) 0.57 (0.13)
100 (n = 69) 0.82 (0.16)
a
CNS score
< 9 (n = 27) 0.67 (0.22)
> 11 (n = 24) 0.81 (0.21)
b
a
difference between severe and moderate and severe and mild is significant at p < 0.0001;
b
difference between severe difficulty and no difficulty is significant at p < 0.05
Health and Quality of Life Outcomes 2003, 1 />Page 13 of 15
(page number not for citation purposes)
While they were slightly modified to meet the 3-point
response scale of the PBSI, the domains were similar. As
expected, the PBSI was poorly associated with the role
emotional and mental health scales of the SF-36. Our
findings are similar to those obtained in studies compar-
ing the SF-36 to the EQ-5D [11] in a stroke population
and the SF-36 to the QWB scale [49], when used among a
general population and patients with renal problems. It
was surprising to see that bodily pain was indirectly cap-
tured by the PBSI (r = 0.48). The item on pain had been
dropped in the developmental process because of poor
association with stroke. But, because pain is frequently
assessed in HRQL instruments, and contradictory conclu-
sions are reported in the literature as to whether or not,
pain impacts HRQL post-stroke [21,22,56] we wanted to
confirm its exclusion from the PBSI. Our findings support
the exclusion of pain. Finally, the PBSI was able to dis-
criminate between groups of individuals on the basis of
their functional independence level and according to the
severity of their stroke at onset.
This preliminary validation provided evidence of con-
struct validity in a group of stroke subjects, at six months
post-stroke. Further information needs to be gathered in
regard of its ability to be responsive to change over time
and in regard to its validity among more severely disabled
stroke survivors. Nonetheless these results are promising
and will lead to future development and assessment of the
PBSI. There were a number of potential limitations
involved in the development of this instrument. First, a
convenience sample of community living stroke survivors
was surveyed to generate an initial item pool. It is possible
that some problematic areas were missed as individuals
who were surveyed were relatively high functioning. How-
ever, as they were compared to a group of community
living individuals who were, on average, younger and did
not have a stroke, it is more likely that more items than
less were kept in the first developmental step of the instru-
ment, which was actually an advantage. While we do not
think that the selection of items will affect the generaliza-
bility of the PBSI across the range of stroke severity, fur-
ther research is required to test the ability of the PBSI to
capture HRQL among the wide range of possible health
states post-stroke. It is interesting that items related to
mood or depression did not meet our selection criteria.
While the absence of such items could be seen as a limita-
tion, it is important to remember that items covering
"emotions" often have poor inter-rater reliability coeffi-
cients. In stroke studies, when a subject's HRQL is
assessed by a proxy because of aphasia or cognitive
deficits, maintaining high reliability coefficients is crucial.
Nonetheless, we recognize the need in stroke studies, to
capture mood and emotions of stroke survivors through
the use of complementary generic or stroke-specific meas-
ures capturing these domains.
Further research is needed to evaluate the ability of the
PBSI to determine HRQL of stroke survivors in relation to
their recovery. This will require access to longitudinal
data, which will become available in the next year. The
PBSI also needs to be validated against another generic
health index, such as the HUI3, and against a stroke spe-
cific profile such as the Stroke Impact Scale. These com-
parisons will provide valuable information about the
validity of the PBSI and add to its value as an outcome
measure in stroke studies. Another important step to be
undertaken in the near future is the assessment of test-
retest reliability. To date, stability of results of the PBSI has
not been tested directly. Rather, reliability estimates were
inferred to be adequate based on data from the parent-
instrument (the SF-36, Barthel Index, MMSE, etc) and on
the expected stability of the attributes being measured by
the PBSI (assuming no change in HRQL). Formal assess-
ment will be undertaken to verify these assumptions.
Some have argued that HRQL by definition is not a stable
construct, therefore test-retest reliability estimates are not
appropriate [62]. However, variation in HRQL estimates
is highly dependent on the domains and attributes chosen
to define the construct. For example, disease-specific
measures defining HRQL mainly in terms of symptoms
may vary over short period of time periods, leading to
poor stability. This does not apply to the PBSI, in which
HRQL is described by a comprehensive set of impair-
ments and activities known to slowly evolve after the first
month post-stroke and become much more likely to be
stable unless a major change in health occurs.
Finally, the fact that a multi-attribute preference-based
scoring system has not yet been developed can be seen as
an immediate limitation in the use of the PBSI. Conse-
quently, the next step in the development of the PBSI will
be the creation of a mathematical model to quantify each
unique health state as a single value. The model will be
developed using the multiattribute utility method [61].
While the current scoring system of the PBSI is adequate
and respects the necessary conditions for items on an
instrument to be summed, it does not take into account
possible interactions between items. With its present scor-
ing system, the PBSI gives a value of 0 to the worst stroke
scenario (major stroke) and 1 to the best stroke scenario.
With a multiattribute model, these scenarios would be
given the values obtained from our survey of stroke survi-
vors and caregivers, that is, 0.19 and 0.93 on a 0 to 1 scale
where 0 represents death and 1, perfect health.
While a consensus is slowly emerging about the need to
obtain societal weights for health states to provide
rational and objective means of comparing health pro-
grams across diseases, this applies to generic health
indexes, not to specific measures. Individuals with stroke
and their caregivers represent the ideal sample to elicit
Health and Quality of Life Outcomes 2003, 1 />Page 14 of 15
(page number not for citation purposes)
preference values for stroke specific health states. Access to
community dwelling stroke subjects and caregivers is real-
istic, and not only did our data demonstrate that these
two groups expressed similar values, they also showed
that comprehension of the rating scale technique was fea-
sible among all subjects. As mentioned previously, the
index summary score of the PBSI should only be used
with the stroke population. Therefore, obtaining only
societal weights would not be relevant or purposeful.
Conclusion
Preference-based measures are expected to become more
prominent in the future. The concept, desirability of a
health state, is highly meaningful as it may help decision-
makers to better target interventions and programs taking
into account gains and losses in the most important
domains for that population. This further highlights the
need for disease-specific instruments, such as the PBSI.
The content validity of the PBSI and its ability to capture
health states across the continuum of stroke severity is
likely to enhance its responsiveness and make it more
appealing than generic instruments like the HUI or EQ-
5D, in stroke studies where cost-effectiveness is an issue.
Author's contribution
LP designed and conducted this study as part of her PhD.
NM, SWD and AC provided feedback and guidance on
this doctoral work. All authors read and approved the
final manuscript.
Additional material
References
1. Patrick DL and Deyo RA: Generic and disease-specific measures
in assessing health status and quality of life. Med Care 1989,
27:S217-S232.
2. Rubenstein LV: Quality of life for patients: diagnosis or screen-
ing, or to evaluate treatment. Quality of Life and Pharmacoeconom-
ics in Clinical trials. Lippincott-Raven 1996:363-373.
3. Whiteneck GG: Measuring what matters: key rehabilitation
outcomes. Arch Phys Med Rehabil 1994, 75:1073-1076.
4. Nunes JF: Economic evaluation of rehabilitation: The quality
of life approach using EuroQol. Int Adv Econ Res 1998, 4:192-201.
5. Ware JE Jr and Sherbourne CD: The MOS 36-item Short-Form
Health Survey (SF-36). I. Conceptual framework and item
selection. Med Care 1992, 30:473-483.
6. Duncan PW, Wallace D and Lai SM et al.: The Stroke Impact Scale
Version 2.0. Evaluation of reliability, validity, and sensitivity
to change. Stroke 1999, 30:2131-2140.
7. Saladin LK: Measuring quality of life post-stroke. Neur Rep 2000,
24:133-139.
8. Duncan PW, Horner RD and Reker DA et al.: Adherence to posta-
cute rehabilitation guidelines is associated with functional
recovery in stroke. Stroke 2002, 33:167-177.
9. Dorman PJ, Slattery J and Farrell B et al.: A randomised compari-
son of the EuroQol and Short Form-36 after stroke. Br Med J
1997, 23:461.
10. Dorman PJ, Waddell F and Slattery J et al.: Is the EuroQol a valid
measure of health-related quality of life after stroke? Stroke
1997, 28:1876-1882.
11. Dorman PJ, Dennis M and Sandercock P: How do scores on the
EuroQol relate to scores on the SF-36 after stroke? Stroke
1999, 30:2146-2151.
12. Cella DF: Quality of Life: Concepts and definition. J PainSymptom
Manage 1994, 9:186-192.
13. Torrance GW, Furlong W and Feeny D et al.: Multi-attribute pref-
erence functions – Health Utilities Index. PharmaEcon 1995,
7:503-520.
14. Boyle MH, Furlong W and Feeny D et al.: Reliability of the Health
Utilities Index – Mark III used in the 1991 cycle 6 Canadian
general social survey health questionnaire. Qual Life Res 1995,
4:249-257.
15. EuroQol Group: EuroQol – a new facility for the measurement
of health-related quality of life. Health Pol 1990, 16:199-208.
16. Kind P: The EuroQol Instrument: An index of health-related
quality of life. Quality of Life and Pharmacoeconomics in Clinical trials.
Lippincott-Raven 1996:191-201.
17. Kaplan RM, Bush JW and Berry CC: Health status: Types of valid-
ity and the index of well-being. Health Serv Res 1976, 11:478-507.
18. Brazier J, Jones N and Kind P: Testing the validity of the Euroqol
and comparing it with the SF-36 health survey
questionnaire. Qual Life Res 1993, 2:169-180.
19. Dorman P, Slattery J and Farrell B et al.: Qualitative comparison
of the reliability of health status assessments with the Euro-
Qol and SF-36 questionnaires after stroke. Stroke 1998,
29:63-68.
20. Dorman PJ, Waddell F and Slattery J et al.: Are proxy assessments
of health status after stroke with the EuroQol questionnaire
feasible, accurate, and unbiased? Stroke 1997, 28:1883-1887.
21. Grootendorst P, Feeny D and Furlong W: Health Utilities Index
Mark 3: evidence of construct validity for stroke and arthritis
in a population health survey. Med Care 2000, 38:290-299.
22. Mathias SD, Bates MM and Pasta DJ et al.: Use of the Health Utili-
ties Index with stroke patients and their caregivers. Stroke
1997, 28:1888-1893.
23. ICIDH-2: International Classification of Functioning and
Disability. Beta-2 draft 1999.
24. Pedersen PM, Jorgensen HS and Nakayama H et al.: Aphasia in
acute stroke: Incidence, determinants and recovery. Ann Neur
1995, 38:659-666.
25. Kotila M, Waltimo O and Niemi ML et al.: The profile of recovery
from stroke and factors influencing outcome. Stroke 1984,
15:1039-1044.
26. Pohjasvaara T, Erkinjuntti T and Vataja R et al.: Dementia three
months after stroke. Baseline frequency and effect of differ-
ent definitions of dementia in the helsinki stroke aging mem-
ory study (SAM) cohort. Stroke 1997, 28:785-792.
27. Anderson CS, Linto J and Stewart-Wynne EG: A population-based
assessment of the impact and burden of caregiving for long-
term stroke survivors. Stroke 1995, 26:843-849.
28. Revicki DA, Leidy NK and Brennan-Diemer F et al.: Integrating
patient preferences into health outcomes assessment. Chest
1998, 114:998-1007.
29. Revicki DA, Leidy NK and Brennan-Diemer F et al.: Development
and preliminary validation of the multiattribute Rhinitis
Symptom Utility Index. Qual Life Res 1998, 7:693-702.
30. Mayo NE: Hospitalization and case-fatality rates for stroke in
Canada from 1982 through 1991. The Canadian collabora-
tive study group of stroke hospitalizations. Stroke 1996,
27:1215-1220.
31. Mayo NE, Wood-Dauphinee S and Ahmed S et al.: Disablement fol-
lowing stroke. Disabil Rehabil 1999, 21:258-268.
32. Mahoney FI and Barthel DW: Functional evaluation: The Barthel
lndex. Maryland Med J 1965, 14:61-65.
33. McDowell I and Newell C: Measuring health: A guide to rating
scales and Questionnaires. 1996.
Additional File 1
10-item preference-weighted questionnaire to assess HRQL post-stroke
Click here for file
[ />7525-1-43-S1.doc]
Publish with BioMed Central and every
scientist can read your work free of charge
"BioMed Central will be the most significant development for
disseminating the results of biomedical research in our lifetime."
Sir Paul Nurse, Cancer Research UK
Your research papers will be:
available free of charge to the entire biomedical community
peer reviewed and published immediately upon acceptance
cited in PubMed and archived on PubMed Central
yours — you keep the copyright
Submit your manuscript here:
/>BioMedcentral
Health and Quality of Life Outcomes 2003, 1 />Page 15 of 15
(page number not for citation purposes)
34. Wood-Dauphinee S and Williams JI: Reintegration to Normal
Living as a proxy to quality of life. J Chronic Dis 1987, 40:491-502.
35. Folstein MF, Folstein SE and McHugh PR: "Mini-mental state". A
practical method for grading the cognitive state of patients
for the clinician. J Psychiatr Res 1975, 12:189-198.
36. Fleiss JL: Statistical methods for rates and proportions. New
York: Wiley 1981.
37. Juniper EF, Guyatt GH and Streiner DL et al.: Clinical impact ver-
sus factor analysis for quality of life questionnaire
construction. J Clin Epid 1997, 50:233-238.
38. Langley GB and Shephard H: The visual analogue scale: Its use in
pain measurement. Rheumatol Int 1985, 5:145-148.
39. Nunnally J: Psychometric Theory. New York: McGraw-Hill 1978.
40. Likert R: A technique for the measurement of attitudes. Arch
Psy 1932, 140:5-55.
41. Mayo NE, Wood-Dauphinee S and Côté R et al.: There's no place
like home: An evaluation of early supported discharge for
stroke. Stroke 2000, 31:1016-1023.
42. Dolan P: Modelling valuations for health states: The effect of
duration. Health Pol 1996, 38:189-203.
43. Jorgensen HS, Nakayama H and Raaschou HO et al.: Outcome and
time course of recovery in stroke. Part II: Time course of
recovery:The Copenhagen stroke study. Arch Phys Med Rehabil
1995, 76:406-412.
44. Côté R, Battista RN and Wolfson C et al.: The Canadian Neuro-
logical Scale: validation and reliability assessment. Neuro
1989, 39:638-643.
45. Roy CW, Togneri J and Hay E et al.: An inter-rater reliability
study of the Barthel Index. Int J Rehabil Res 1988, 11:67-70.
46. Desmond DW, Moroney JT and Sano M et al.: Recovery of cogni-
tive function after stroke. Stroke 1996, 27:1798-1803.
47. Pohjasvaara T, Erkinjuntti T and Vataja R et al.: Comparison of
stroke features and disability in daily life in patients with
ischemic stroke aged 55 to 70 and 71 to 85 years. Stroke 1997,
28:729-735.
48. Montgomery H, Persson LO and Ryden A: Importance and attain-
ment of life values among disabled and non-disabled people.
Scand J Rehabil Med 1996, 28:233-240.
49. Fryback DG, Lawrence WF and Martin PA et al.: Predicting quality
of well-being scores form the SF-36: Results from the Beaver
Dam Health Outcomes Study. Med Dec Making 1997, 17:1-9.
50. Hobart JC, Williams LS and Moran K et al.: Quality of life measure-
ment after stroke: uses and abuses of the SF-36. Stroke 2002,
33:1348-1356.
51. Samsa G, Edelman D, Rothman ML, Williams GR, Lipscomb J and
Matchar D: Determining clinically important differences in
health status measures: A general approach with illustration
to the Health Utilities Index Mark2. Pharmacoeconomics 1999,
15:141-155.
52. Ruta DA, Garratt AM and Leng M et al.: A new approach to the
measurement of quality of life. The Patient-Generated
Index. Med Care 1994, 32:1109-1126.
53. Williams LS, Weinberger M and Harris LE et al.: Development of a
stroke-specific quality of life scale. Stroke 1999, 30:1362-1369.
54. Wolfe F and Hawley DJ: Measurement of the quality of life in
rheumatic disorders using the EuroQol. Bri J Rheumatol 1997,
36:786-793.
55. Fransen M and Edmonds J: Reliability and validity of the EuroQol
in patients with osteoarthritis of the knee. Rheumatol (Oxford)
1999, 38:807-813.
56. Duncan PW, Samsa GP and Weinberger M et al.: Health status of
individuals with mild stroke. Stroke 1997, 28:740-745.
57. Shin AY, Porter PJ and Wallace MC et al.: Quality of life of stroke
in younger individuals. Utility assessment in patients with
arteriovenous malformations. Stroke 1997, 28:2395-2399.
58. Samsa GP, Matchar DB and Goldstein L et al.: Utilities for major
stroke: Results from a survey of preferences among persons
at increased risk for stroke. Am Heart J 1980, 136:1703-713.
59. Gage BF, Cardinalli AB and Owens DK: The effect of stroke and
stroke prophylaxis with aspirin or warfarin on quality of life.
Arch Int Med 1996, 156:1829-1836.
60. Post PN, Stiggelbout AM and Wakker PP: The utility of health
states after stroke – A systematic review of the literature.
Stroke 2001, 32:1425-1429.
61. Boyle MH and Torrance GW: Developing multiattribute
indexes. Med Care 1984, 22:1045-1057.
62. Kaplan RM, Ganiats T and Sieber W et al.: The Quality of Well-
Being scale: critical similarities and differences with SF-36.
Int J Qual Health Care 1998, 10:509-520.