Health and Quality of Life Outcomes BioMed Central Research Open Access Brief assessment of docx
Bạn đang xem bản rút gọn của tài liệu. Xem và tải ngay bản đầy đủ của tài liệu tại đây (321.91 KB, 12 trang )
BioMed Central
Page 1 of 12
(page number not for citation purposes)
Health and Quality of Life Outcomes
Open Access
Research
Brief assessment of priority symptoms in hormone refractory
prostate cancer: The FACT Advanced Prostate Symptom Index
(FAPSI)
Susan Yount*
1
, David Cella
1
, Donald Banik
1,2
, Talat Ashraf
3
and
Daniel Shevrin
4
Address:
1
Center on Outcomes, Research and Education (CORE), Evanston Northwestern Healthcare and Northwestern University, 1001
University Place, Suite 100, Evanston, IL 60201 USA,
2
University of New England College of Osteopathic Medicine, 11 Hills Beach Road,
Biddeford, Maine 04005 USA,
3
Abbott Laboratories, Dept. R42J, Building AP9A-2, 100 Abbott Park Road, Abbott Park, IL 60064-6124 USA and
4
Evanston Northwestern Healthcare and Northwestern University, 2650 Ridge Avenue, Evanston, IL 60201 USA
Email: Susan Yount* - ; David Cella - ; Donald Banik - ;
Talat Ashraf - ; Daniel Shevrin -
* Corresponding author
Abstract
Background: The objective of this study was to construct and validate a brief, clinically-relevant
symptom index for advanced prostate cancer.
Methods: Questions were extracted from a commonly-used multi-dimensional cancer quality of
life instrument with prostate-specific items, the Functional Assessment of Cancer Therapy-Prostate
(FACT-P). Surveys of disease-related symptoms were presented to an international sample of 44
expert physicians. Each expert narrowed the list to no more than five of the most important
symptoms or concerns to monitor when assessing the value of treatment for advanced prostate
cancer. Symptoms/concerns endorsed at a frequency greater than chance probability (17%) were
retained for the symptom index and called the FACT Advanced Prostate Symptom Index-8 (FAPSI-
8): pain (three items), fatigue, weight loss, urinary difficulties (two items), and concern about the
condition becoming worse. The FAPSI-8 was validated using data from a clinical trial of 288 men
being treated for hormone refractory prostate cancer.
Results: The FAPSI-8 showed good internal consistency (r = 0.67–0.80); association with existing
FACT scales (e.g., FACT-P, Physical Well-being, Functional Well-being; r = 0.44–0.85, p < .0001),
responsiveness to clinical change (Guyatt's Responsiveness statistic = 1.29), and ability to
differentiate patients by performance status (p < .0001). A six-item alternate version of the FAPSI
was also evaluated with comparable results.
Conclusions: This project produced a reliable and valid list of the eight most important clinician-
rated targets of drug therapy for advanced prostate cancer. These questions perform comparably
to the longer derivative questionnaire. Examination of patient agreement with this priority list and
the extent to which changes in these 8 targets are related to meaningful clinical benefit to the
patient are important next steps for future research.
Published: 21 November 2003
Health and Quality of Life Outcomes 2003, 1:69
Received: 25 July 2003
Accepted: 21 November 2003
This article is available from: />© 2003 Yount et al; licensee BioMed Central Ltd. This is an Open Access article: verbatim copying and redistribution of this article are permitted in all
media for any purpose, provided this notice is preserved along with the article's original URL.
Health and Quality of Life Outcomes 2003, 1 />Page 2 of 12
(page number not for citation purposes)
Background
The importance of symptom control in cancer popula-
tions, in particular, has been widely recognized due to the
extraordinarily high prevalence of physical and psycho-
logical symptoms as well as the impact of these symptoms
on patients' QOL [1]. For patients with advanced disease
who have reduced life expectancy and no immediate hope
for a cure, relief of physical symptoms and maintenance
of function become primary objectives of medical inter-
vention [2-4]. This is true for advanced prostate cancer, in
particular, where patients are faced with palliative rather
than curative treatment options [3].
Although the literature contains a number of reliable and
valid instruments to measure quality of life (QOL) [5-8],
oncology health care experts and regulatory agencies have
resisted using these multi-item, multi-dimensional instru-
ments in clinical practices and decision-making [9-12].
This resistance stems from time and resource constraints
[13,14], difficulty interpreting the meaning of multidi-
mensional information, and difficulty determining the
clinical meaning of score changes, including implications
for treatment decisions [12,15-20].
The U.S. Food and Drug Administration (FDA) has stated
that, along with survival, benefit to QOL is one of two pri-
mary endpoints that could be considered for approval of
new anti-cancer drugs [21]. Yet, this regulatory agency is
also challenged with implications for claims of drug effec-
tiveness from multidimensional assessment of QOL [22].
The FDA Oncology Drug Advisory Committee subcom-
mittee on Quality of Life has suggested that assessment of
symptoms might represent a reasonable place to start in
working toward a goal of more focused assessment of
QOL domains [23].
Most recently validated measures of cancer-specific QOL
incorporate an assessment of certain prevalent symptoms,
such as pain and fatigue, within the multidimensional
assessment [5,6]. Broad-based cancer specific QOL ques-
tionnaires, such as the Functional Assessment of Cancer
Therapy-General (FACT-G) [6] and European Organiza-
tion for Research and Treatment of Cancer (EORTC)
QLQ-C30 [5], assess a few common cancer symptoms
such as pain, fatigue and nausea, and add more detailed,
site-specific symptom assessment to the "core" general
questionnaire. While the questionnaires have been devel-
oped and tested to assess cancer-specific symptoms, dis-
ease symptoms of interest are embedded in large, longer
QOL questionnaires and cannot readily be aggregated
into clinically relevant, responsive symptom indices. A
common request, therefore, is for a more symptom-
focused approach to QOL assessment tools whereby the
disease symptoms measured by these multi-dimensional
QOL questionnaires are aggregated in such a way that is
clinically relevant, easy to use in clinical practice, and psy-
chometrically acceptable.
Our response to this need was launched by the National
Comprehensive Cancer Network (NCCN) in relation to
nine common cancers, including prostate cancer [24].
This effort revealed that there are seven symptoms or con-
cerns in prostate cancer that hold the very highest priority
to clinical experts who treat men with advanced prostate
cancer. These concerns include fatigue, pain (3 items),
weight loss, and difficulty with urination. This article
describes the development and initial validation of a brief
prostate cancer-specific symptom index derived from a
well-established multidimensional QOL questionnaire,
the FACT-P [4].
Methods
The FACT Prostate Symptom Index (FAPSI), a brief, symp-
tom-targeted instrument, was developed and validated in
three phases. During phase 1, we extracted a list of symp-
toms related to cancer in general as well as prostate cancer
specifically from the FACT-P to develop a prostate cancer
symptoms/concerns survey (Survey). In phase 2, we pre-
sented the Survey to an international sample of physician
experts for selection of the highest priority symptoms to
evaluate when treating men with advanced prostate can-
cer. During Phase 3, we analyzed data from clinical trial in
which the FACT-P was administered to patients to deter-
mine the psychometric performance of the FAPSI-8.
Participants
The sample of physicians who were asked to complete the
Survey had at least three years experience treating 100
patients with advanced prostate cancer. The total sample
included 23 medical oncologists (17 North American, 6
European), 13 radiation oncologists (9 North American, 4
European), and 20 urologists (11 North American & 9
European). A total of 44 prostate cancer specialists (79%
response rate, 77% to 80% range) physician experts (18
medical oncologists, 16 urologists, 10 radiation oncolo-
gists; 29 North American, 15 European) completed the
Survey. The response rate was consistent among special-
ties and between geographic areas, ranging from 77% to
80%.
The validation patient sample consisted of 288 men with
hormone refractory prostate cancer enrolled in a rand-
omized, placebo-controlled clinical trial of atrasentan, an
oral, selective endothelin-A receptor antagonist. See Table
1 for patient demographic and clinical characteristics.
Institutional review board approval was obtained at each
institution where data was collected in the clinical trial.
Health and Quality of Life Outcomes 2003, 1 />Page 3 of 12
(page number not for citation purposes)
Measures
The source of symptoms and concerns for both the survey
tool and the symptom index was the FACT-P [4], com-
prised of the 27 FACT-G items plus 12 items specific to
prostate disease, such as urinary, sexual and bowel dys-
function, and pain [25]. The FACT-G (version 4) is a 27-
item compilation of general questions divided into 4 pri-
mary QOL domains: Physical Well-Being (PWB), Social/
Family Well-Being (S/FWB), Emotional Well-Being
(EWB), and Functional Well-Being (FWB) [6]. Scores are
obtained for each of the specific domains as well as a total
QOL score. An additional score, the Trial Outcome Index
(TOI) [26,27], is created by summing the PWB, FWB, and
Prostate Cancer Subscale (PCS). Responses to FACT ques-
tions use a five-point Likert-type scale ranging from 0
("not at all") to 4 ("very much so"). The FACT-G has good
test-retest reliability (r range = 0.82 – 0.92), is sensitive to
change over time, and has been shown to possess good
convergent and discriminant validity [6]. Both the FACT-
G and FACT-P were derived using a thorough item gener-
ation and review procedure with patients and clinicians,
ensuring that important content is well-covered.
The European Organization for Research and Treatment
of Cancer (EORTC) QLQ-C30 QOL questionnaire is a
widely-used, validated instrument that includes 30 ques-
tions measuring physical, role, emotional, and social
functioning, disease symptoms, financial impact, and glo-
bal QOL [5]. A global score as well as symptom scores
(e.g., pain, fatigue) can be calculated. The QLQ-C30 was
used in this study to evaluate convergent validity.
The Eastern Cooperative Oncology Group (ECOG) Per-
formance Status Rating (PSR) is a single-item rating of the
degree to which patients are able to participate in typical
activities without the need for rest [28]. This index is
widely used in cancer clinical trials to assess functional
capability of patients as they undergo treatment. The PSR
score ranges from 0 (normal activity without symptoms)
to 4 (unable to get out of bed). In this study, the PSR was
obtained from patients themselves and served as a means
of classifying patients for known-groups validation.
Procedure
An independent review of the 39 items on the FACT-P was
conducted by two medical oncologists with subspecialties
in health services research and policy and one of the co-
authors (DC), a clinical psychologist specializing in QOL
assessment. First, symptoms or concerns from the FACT-G
deemed to be a consequence of the disease itself were
selected. Second, symptoms or concerns specific to pros-
tate cancer (from the PCS) were subjected to the same
review process. Items were ranked on a four-point Likert
scale from "always disease-related" to "never disease-
related." Items rated as "always" or "usually" disease-
related symptoms or concerns by two or more of the three
raters were retained for the Survey. The raters discussed
any items that did not receive a consensus rating in a con-
ference call. Twenty-nine items resulting from this two-
step process were compiled in a symptom/concern survey.
The only revision made to the wording of any item was
the addition of "bone pain" as clarification in parentheses
after the question: "I have certain areas of my body where
I experience significant pain."
To control for effects due to order of administration of
items, four versions of each survey were created and ran-
domly distributed. The survey asked each respondent to
select no more than 10 symptoms or concerns that were
"the most important to monitor when assessing the value
of treatment for advanced prostate cancer." Of the ten
symptoms/concerns nominated as "the most important,"
each respondent was then asked to select up to five as "the
very most important." Respondents were also asked to
Table 1: Description of Patient Sample
Mean (SD) No. Percent
Age (years) 71.0 (7.8)
Ethnicity
White 278 97%
African American/Asian/
Hispanic
10 3%
Time since diagnosis (years) 5.3 (3.7)
PSA (ng/mL) 283.1 (822.9)
Hemoglobin (g/dL) 13.1 (1.4)
ECOG PSR at baseline
0 162 56%
1 113 39%
2 13 5%
Health and Quality of Life Outcomes 2003, 1 />Page 4 of 12
(page number not for citation purposes)
write in important symptoms or concerns that were omit-
ted from the Survey. Surveys were sent to physician
experts via email, traditional mail, fax and/or distribution
at cooperative group conferences (i.e., ECOG). Each phy-
sician who returned a survey and completed the partici-
pant information section was compensated for his/her
time.
Survey Analysis Plan
The Survey was analyzed by tabulating the frequency with
which experts selected a particular symptom/concern as
one of the five most important for the total sample and for
each specialty (medical oncology, radiation oncology,
urology) and geographic region (North American, Euro-
pean). The items most commonly endorsed by the total
sample were retained in the final symptom index. The cri-
terion for item retention was a rate of endorsement as one
of the top five symptoms/concerns exceeding the proba-
bility of chance (17%), calculated by dividing the allowa-
ble number of "very most important symptoms" (5) by
the total number of items in the survey (29). In addition,
a 95% confidence interval (CI) above chance probability
was calculated to serve as a more conservative criterion for
selection. Using the total sample, 2 × 2 Chi square analy-
ses were conducted to determine if the order of presenta-
tion of the symptoms had any systematic influence on
experts' selection of the ten "most important" symptoms.
Validation Analysis Plan
Patient data used for the initial validation analyses
included only those time points from baseline through
week 24 of the 52-week trial because of patient attrition.
Because the objective of this study was to develop and val-
idate a brief symptom index as opposed to determining
treatment response, and the sample size remained ade-
quate, we did not feel the study objectives were compro-
mised by this cut-off point.
Patient responses to the items retained for the FAPSI were
subjected to analysis for determination of internal consist-
ency (Cronbach's alpha), and convergent and discrimi-
nant validity. Guyatt's Responsiveness Statistic, a
modification of the effect size, was calculated as an index
of the responsiveness of FAPSI to change in clinical status
[29]. This statistic is computed as the ratio of difference
between average change in FAPSI scores among patients
whose ECOG PSR worsened and average change in FAPSI
scores in patients whose PSR remained unchanged to the
standard deviation of FAPSI scores among patients with
no change in PSR. Similar to Cohen's effect size conven-
tions [30], a Guyatt's statistic ≤ 0.20–0.49 is considered
small, 0.50–0.79 is moderate, and ≥ 0.80 is large.
We also applied an item response theory (IRT) based
approach to evaluate the unidimensionality and construct
validity of the FAPSI candidate items in greater detail [31].
For items retained in the symptom index according to the
more liberal of the criteria (i.e., exceeding chance proba-
bility of endorsement), Andrich's [32,33] rating scale
extension of the Rasch measurement model was used to
determine whether FAPSI candidate items measure the
same underlying construct. The WINSTEPS computer pro-
gram [34] was used for Rasch analyses. Unweighted item
fit mean square (MNSQ) values (expected value = 1.0)
were also calculated to identify potential misfitting items
or those that indicate a lack of construct homogeneity
with other items in a scale to assure scale unidimension-
ality. MNSQ = 1.3 was set as the critical value for a misfit-
ting item. The MNSQ value indicates the amount of error
associated with the item estimate with respect to its fit
with other items in the dimension being measured. For
example, a MNSQ of 1.40 indicates 40% excess noise in
the data, suggesting the item is measuring a different
dimension than the one it is intended to measure.
Results
Survey
Of the symptoms/concerns presented to physician experts
(Table 2), eight items were endorsed with a greater than
chance probability (>17%) for the total sample and
selected for FAPSI-8 (Please see Additional File 1 [Appen-
dix]). Using the total sample, Chi square analyses revealed
presentation order had no systematic effects. The only
symptom on the FAPSI-8 displaying a significant order
effect was "I have pain" (X
2
[1] = 7.3, p < .05). Physician
experts whose Survey presented this item in the top half
endorsed it more frequently than those whose Survey pre-
sented the item in the bottom half. More than one physi-
cian expert entered two additional write-in symptoms/
concerns: hot flashes (2 experts) and PSA-related anxiety
(2 experts).
Endorsed symptoms/concerns that ranked highly across
all physician expert specialties (medical oncology, radia-
tion oncology, urology) included three pain items (pain,
bone pain, pain limiting performance of activities) and
fatigue (Table 3). Variation between specialties in prioriti-
zation of weight loss and urinary difficulty was greater
than other items. Difficulty urinating was an item
endorsed as among the five "very most important" symp-
toms/concerns by urologists (50%) and radiation oncolo-
gists (40%), but the percentage fell (11%) among medical
oncologists. Geographic differences in ranking of urinary
difficulty were also apparent: European experts (mostly
urologists) ranked it second overall, compared to the
North American ranking of 7.
FAPSI-8 Validation
Scores and internal consistencies for the FACT-G, FACT-P
and FAPSI are reported in Table 4. The scale scores are
Health and Quality of Life Outcomes 2003, 1 />Page 5 of 12
(page number not for citation purposes)
Table 2: Frequency of endorsement of checklist symptom/concerns
Symptoms/concerns % Endorsed ("top 5")
Pain 68
Fatigue (lack of energy) 64
Pain limits performance 43
Difficulty urinating 32
Worry condition will get worse 27
Bone pain 25
Weight loss 18
Urinating problems limit activity
1
18
Feeling ill 16
Able to enjoy life 16
Bothersome aches/pains 16
Trouble moving bowels 16
Sadness 14
Spend time in bed 11
Satisfaction with sex life 11
Losing hope 11
Able to work 11
Physical limitations on family role 9
Worry about dying 9
Enjoyment of leisure activities 9
Nausea 7
Sleep 7
Able to have/maintain erection 7
Anxiety 5
Contentment with QOL 5
Satisfaction with comfort level 5
Appetite 2
Able to feel like a man 2
Urinary frequency 2
1
17% chance probability of endorsement
Table 3: Rankings of FAPSI-8 Items by Expert Specialty and Geographic Region
FAPSI-8 Items Total Sample Rank
(n = 44)
Specialty Geographic Region
Medical Oncologists
(n = 18)
Urologists
(n = 16)
Radiation Oncologists
(n = 10)
North American
(n = 29)
European
(n = 15)
Pain 121121
Fatigue 212213
Pain limits
performance
334236
Difficulty urinating4132472
Worry condition will
get worse
5441144
Bone pain 656654
Weight loss 7 5 6 20 11 6
Urination problems
limit activity
75108511
Health and Quality of Life Outcomes 2003, 1 />Page 6 of 12
(page number not for citation purposes)
presented both in raw form and transformed to a 0–100
scale for ease of comparison across scales.
Items with mean square (MNSQ) values outside 0.7–1.3
have been identified as possible misfitting items, indicat-
ing that further examination may be warranted (Linacre &
Wright). MNSQ < 0.7 suggests "overfit" to the concept
being measured, and MNSQ > 1.3 suggests misfit to the
dimension being measured by the collection of FAPSI
questions. These analyses suggest that the items "I have
difficulty urinating" and "My problems with urinating
limit my activities" do not measure a construct consistent
with the other 6 items. Excluding these items produced
essentially no change to the internal consistency of the
FAPSI-6. However, because this item received frequent
endorsement by the physician experts, we elected to retain
them in the FAPSI-8 (Table 5).
The FACT-G and FACT-P had good internal consistency
(baseline alpha = 0.84 and 0.87, respectively). PWB, FWB,
and EWB subscales (alphas= 0.69 to 0.85) as well as the
PCS (alpha = 0.70) and TOI (alpha = 0.86) also demon-
strated good internal consistency. The internal consist-
ency of the SFWB scale was lower than the other domain
scales (alpha = 0.59).
Because the item level analyses suggested that both a 6-
and 8-item version of the FAPSI warranted consideration,
analyses of the FAPSI were conducted on both versions.
The 6-item symptom index excluded the items, "I have
difficulty urinating" and "My problems with urinating
limit my activities." Internal consistency of the FAPSI-6
(alpha = 0.68) and FAPSI-8 (alpha = 0.67) was adequate
at baseline, and by week 24 increased to 0.81 and 0.80,
respectively (Table 4).
Table 4: Descriptive Baseline Statistics of Scales (N = 272–278)
Scale/Subscale Raw Baseline Scores
M (SD)
Transformed Scores
(0–100) M (SD)
Cronbach's Alpha
Baseline Week 6 Week 12 Week 24
FACT-G total score 84.73 (12.56) 78.46 (11.63) 0.84 0.89 0.88 0.89
Physical Well-being (PWB) 24.35 (3.44) 86.97 (12.30) 0.69 0.82 0.74 0.80
Functional Well-being (FWB) 20.49 (5.53) 73.17 (19.76) 0.85 0.88 0.89 0.88
Social/Family Well-being (SFWB) 21.59 (4.93) 77.11 (17.60) 0.59 0.60 0.68 0.56
Emotional Well-being (EWB) 18.32 (4.18) 76.31 (17.41) 0.72 0.72 0.63 0.74
FACT-P total score 118.59 (17.05) 76.02 (10.93) 0.87 0.91 0.90 0.92
Prostate Cancer Subscale (PCS) 33.91 (6.58) 70.64 (13.72) 0.70 0.79 0.75 0.81
Trial Outcome Index (TOI) 78.73 (12.94) 75.70 (12.44) 0.86 0.91 0.90 0.92
FAPSI-6 (excluding urination items
1
) 18.38 (3.92) 76.6 (16.35) 0.68 0.80 0.69 0.81
FAPSI-8 24.94 (4.75) 77.94 (14.84) 0.67 0.79 0.74 0.80
1
difficulty urinating, problems with urinating limit activities
Table 5: Summary of Item statistics for FAPSI-8
1
FAPSI Item N Avg. Item Calibration
(logits/s.e.)
Infit statistic (mean square) Outfit Statistic (mean
square)
Worry condition gets
worse
271 0.93/0.05 1.13 1.15
Lack of energy 271 0.52/0.06 0.92 0.95
Bone pain 271 0.10/0.06 0.75 0.70
Difficulty urinating 270 -0.06/0.07 1.44 1.34
Urinating limits activities 271 -0.20/0.07 1.42 1.11
Pain 270 -0.24/0.07 0.77 0.67
Pain limits performance 267 -0.25/0.07 0.84 0.63
Weight loss 271 -0.84/0.10 1.36 1.28
1
based on Andrich's (1978a, b) extension of the Rasch rating scale model
Health and Quality of Life Outcomes 2003, 1 />Page 7 of 12
(page number not for citation purposes)
FAPSI-8 was significantly and positively correlated with
the FACT-G total score (r = 0.51, p < .001), PWB (r = 0.66,
p < .001), FWB (r = 0.44, p < .001), EWB (r = 0.40, p <
.0001), FACT-P total score (r = 0.71, p < .001), PCS (r =
0.85, p < .001), and TOI (r = 0.80, p < .001), as well as the
EORTC global score (r = 0.48, p < .001), pain symptom
scale (r=-0.72, p < .001), and fatigue symptom scale (r=-
0.59, p < .001) (Table 6). The magnitude of correlations
of the 6-item symptom index with the above scales was
comparable to FAPSI-8, with the exception of the three
FACT scales that include the two urination items excluded
from the 6-item index (FACT-P, r = 0.67; PCS, r = 0.73;
TOI, r = 0.74, all p < .001). Neither symptom index was
significantly correlated with the FACT SFWB subscale.
FAPSI-6 and FAPSI-8 had comparable responsiveness on
Guyatt's statistic (Table 7). While all of the scales have
responsiveness statistics consistent with large effect sizes,
the responsiveness statistics for FAPSI-6 and FAPSI-8 were
among the largest (1.42 and 1.29, respectively) and were
comparable to that of the commonly-recommended
FACT TOI (1.33).
The sample was divided into three groups by baseline
PSR: PSR = 0 versus PSR = 1 versus PSR = 2 (no patients
were rated a PSR ≥ 3). Better symptom status (lower FAPSI
score) was expected to be associated with better perform-
ance status (lower PSR). Baseline PSR was associated with
QOL and symptom status as measured by FACT-G total
score (F(2,269) = 19.97, p < .0001), FACT-P total score
(F(2,268) = 25.09, p < .0001), PWB (F(2,274) = 30.90, p
Table 6: Unadjusted and adjusted
1
correlations between baseline FAPSI-6 & FAPSI-8 and study measures (N = 272–278)
Measure FAPSI-6 FAPSI-8
FACT-G Total Score unadjusted 0.52*** 0.51***
adjusted 0.41*** 0.42***
Physical Well-Being unadjusted 0.70*** 0.66***
adjusted 0.45*** 0.46***
Functional Well-Being 0.43*** 0.44***
Social/Family Well-Being -0.01 0.03
Emotional Well-Being unadjusted 0.43*** 0.40***
adjusted 0.37*** 0.33***
FACT-P Total Score unadjusted 0.67*** 0.71***
adjusted 0.51*** 0.57***
Prostate Cancer Subscale unadjusted 0.73*** 0.85***
adjusted 0.54*** 0.72***
Trial Outcome Index unadjusted 0.74*** 0.80***
adjusted 0.58*** 0.68***
EORTC Global Score 0.48*** 0.48***
EORTC Symptom Scale: Pain -0.78*** -0.72***
EORTC Symptom Scale: Fatigue -0.60*** -0.59***
***p < .001
1
Adjusted correlations are adjusted for redundant items in both FACT scale and FAPSI
Table 7: Guyatt's Responsiveness Statistics for FAPSI-6 and FAPSI-8
Instrument Average change
1
score of
observations with worse
2
PSR
Average change
1
score of
observations with same
2
PSR
Mean Square Error
3
Guyatt's Responsiveness Statistic
4
EORTC QLQ-C30 Global Score -17.47 -3.49 136.96 0.85
FACT-G Total Score -8.56 -0.63 37.16 0.92
FACT-P Total Score -13.98 -1.43 69.58 1.06
Trial Outcome Index (TOI) -13.80 -2.01 39.62 1.33
FACT Advanced Prostate
Symptom Index-6 (FAPSI-6)
-4.40 -0.29 4.15 1.42
FACT Advanced Prostate
Symptom Index-8 (FAPSI-8)
-4.62 -0.11 6.12 1.29
1
Average change score = average score change from baseline and weeks 6, 12 and 24
2
Worse PSR and same PSR = PSR at weeks 6, 12 and 24
compared to baseline
3
Mean squared error of observed score obtained from ANOVA model examining repeated observations of measure in
clinically stable subjects
4
Average change score of observations with worse PSR – average change score of observations with same PSR)/sqrt
(2*MSE)
Health and Quality of Life Outcomes 2003, 1 />Page 8 of 12
(page number not for citation purposes)
< .0001), FWB (F(2,273) = 30.87, p < .0001), EWB
(F(2,272) = 3.55, p < .05), PCS (F(2,274) = 20.01, p <
.0001), TOI (F(2,273) = 40.16, p < .0001), and both the
FHSI-6 (F(2,274) = 19.06, p < .0001), and FHSI-8
(F(2,274) = 21.46, p < .0001). SFWB scores were not sig-
nificantly different between the three PSR groups. Post
hoc review of the subgroup differences using Tukey's HSD
indicated that the FACT-G, FACT-P, PWB, FWB, and TOI
differentiated all three PSR levels (all p < .05). In contrast,
PCS, FAPSI-6 and FAPSI-8 were able to differentiate only
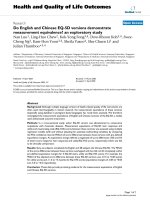
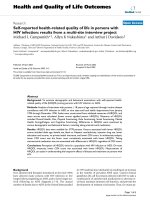
between PSR = 0 and PSR = 1 or PSR = 2 (Figure 1).
At week 24, PSR remained associated with QOL and
symptom status: FACT-G total score (F(2,117) = 12.91, p
< .0001), FACT-P total score (F(2,117) = 12.25, p <
.0001), PWB (F(2,119) = 14.23, p < .0001), FWB
(F(2,118) = 21.51, p < .0001), EWB (F(2,118) = 3.62, p <
.05), PCS (F(2,119) = 7.10, p < .01), TOI (F(2,118) =
16.84, p < .0001), and both the FHSI-6 (F(2,119) = 11.75,
p < .0001), and FHSI-8 (F(2,119) = 9.99, p < .0001).
SFWB scores did not differ between the three PSR groups.
As with the baseline differences, post hoc review with
Tukey's HSD indicated that the FACT-G, FACT-P, PWB,
FWB, and TOI differentiated all three PSR levels (all p <
.05). At Week 24, the PCS was able to differentiate only
between PSR = 0 and PSR = 2. The ability of the six- and
eight-item FAPSI scales to discriminate between PSR
groups was intermediate, differentiating between PSR = 0
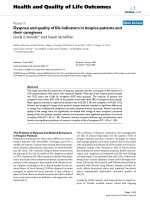
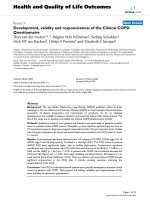
and PSR = 1 or PSR = 2 (Figure 2).
Discussion
The objective of this project was to develop a brief symp-
tom index for advanced prostate cancer from items
derived from an existing, well-established multidimen-
Mean FACT scale responses (± one standard error of the mean) by baseline patient ECOG Performance Status Rating (PSR)Figure 1
Mean FACT scale responses (± one standard error of the mean) by baseline patient ECOG Performance Status Rating (PSR).
PSR groups were trichotomized into PSR = 0 (n = 159–160), PSR = 1 (n = 102–105), and PSR = 2 (n = 12). [1] indicates dis-
crimination between (PSR = 0) v (PSR = 1) v (PSR = 2); [2] indicates discrimination between (PSR = 0) v (PSR = 1 or 2). *p <
.05, ***p < .001
0
20
40
60
80
100
FACT-G FACT-P PWB FWB EWB SFWB PCS TOI FAPSI-6 FAPSI-8
Scale
Scale score (transformed 0-100)
PSR=0 PSR=1 PSR=2/3
***[1] ***[1]
***[1]
***[1]
*[1]
***[2]
***[1] ***[2]
***[2]
Health and Quality of Life Outcomes 2003, 1 />Page 9 of 12
(page number not for citation purposes)
sional QOL questionnaire, the FACT-P. Based on the
input of an international sample of 44 expert physicians,
an eight-item symptom index was constructed. Initial
patient validation of the eight items demonstrated that
these items have adequate reliability and validity to assess
the most important symptoms in this population. The
FAPSI-6 and FAPSI-8 were shown to have good internal
consistency, and convergent validity was demonstrated by
its significant correlations with the FACT-G and its PWB,
EWB, FWB subscales as well as with the FACT-P and the
Prostate Cancer Subscale. The FAPSI-6 and FAPSI-8 also
successfully discriminated patients based on differences in
performance status at baseline and week 24, with patients
with better performance status reporting better symptom
status than those with poorer performance status.
Although they had comparable responsiveness on Guy-
att's Statistic, neither the FAPSI-6 nor the FAPSI-8 sepa-
rated performance status groups quite as well as the FACT-
G, FACT-P, PWB, FWB and TOI. However, further research
is needed to determine if the FAPSI-6 or FAPSI-8 is best
used in concert with other measures, such as the FACT-G,
FACT-P, EORTC QLQ C30 or SF-36.
The candidate items presented to the experts for selection
were drawn from the FACT QOL measurement system,
although experts were also provided with the opportunity
to 'write in' items not appearing on the surveys. Results of
this project suggest that the FACT-P contains most of the
disease-related symptoms and concerns that physicians
believe are important to monitor in this patient popula-
tion. Results of item-level analyses also suggested that a 6-
item version of the FAPSI, excluding two items related to
Mean FACT scale responses (± one standard error of the mean) by Week 24 patient ECOG Performance Status Rating (PSR)Figure 2
Mean FACT scale responses (± one standard error of the mean) by Week 24 patient ECOG Performance Status Rating (PSR).
PSR groups were trichotomized into PSR = 0 (n = 70), PSR = 1 (n = 37–39), and PSR = 2 (n = 13). [1] indicates discrimination
between (PSR = 0) v (PSR = 1) v (PSR = 2); [2] indicates discrimination between (PSR = 0) v (PSR = 1 or 2); [3] indicates dis-
crimination between (PSR = 0) v (PSR = 2). *p < .05, **p < .01, ***p < .001
0
20
40
60
80
100
FACT-G FACT-P PWB FWB EWB SFWB PCS TOI FAPSI-6 FAPSI-8
Scale
Scale score (transformed 0-100)
PSR=0 PSR=1 PSR=2
***[1]
***
[1]
***[1]
***[1]
**[3]
***[1]
***[2]
***
[2]
*
Health and Quality of Life Outcomes 2003, 1 />Page 10 of 12
(page number not for citation purposes)
urination difficulties, demonstrated good psychometric
performance in this population. However, the slight psy-
chometric gain with respect to unidimensionality must be
weighed against the sacrifice in clinical utility resulting
from these two items deemed relevant by expert clini-
cians. Although patients did not participate in the choice
of target symptoms, they did participate, in a 3:1 ratio, in
the selection of the original items during development of
the FACT-Prostate. It remains to be seen, however, if
patients would select similar or the same 8 symptoms
when presented with this task.
The symptoms endorsed as the most important included
three pain items ("I have pain," "My pain keeps me from
doing things I want to do," and "I have certain areas of my
body where I experience significant pain [bone pain]").
Five questions of the 29 on the survey pertained to pain
whereas, for example, only one was devoted to fatigue. We
believe that the frequency with which these multiple pain
items were endorsed among the top five "most impor-
tant" highlights the importance of pain experiences in
advanced prostate cancer patients, but this must be con-
firmed in subsequent studies.
Observed consistencies and differences in item endorse-
ment between expert groups (specialty and region) were
informative in two ways. First, the eight final items com-
prising the FAPSI-8 were selected based on the combined
endorsements of a range of specialists treating advanced
prostate cancer patients. Respondents from all three spe-
cialties and both geographic regions endorsed most of the
eight responses. Difficulty urinating was a question
endorsed as among the top five priority symptoms by
50% of urologists and 40% of radiation oncologists in
this sample but only 11% of medical oncologists. This
same question was endorsed as a priority symptom by
60% of European experts and only 17% of North Ameri-
can experts, but this is probably due to the greater repre-
sentation of urologists among the European sample than
the North American sample (53% vs. 28%, respectively).
The priority symptoms identified by expert physicians in
this study are consistent with previously reported symp-
toms and concerns of cancer patients in general, and pros-
tate cancer patients specifically. Pain and fatigue have
been highlighted in a number of studies of symptom
assessment in numerous medical oncology populations
[1,35,36]. In addition, depending on the stage of disease,
patients with prostate cancer report difficulties with ano-
rexia, urination, and sexual function [4,37]. The NCCN
survey, using a similar methodology but a U.S. sample
only, produced six of the same eight symptoms (fatigue,
bone pain, pain, pain limits performance, weight loss, dif-
ficulty urinating) in its seven-item NCCN/FACT Prostate
Symptom Index, which also includes an item concerned
with being able to enjoy life [24].
For patients with advanced prostate cancer, especially hor-
mone refractory prostate cancer, current therapy has lim-
ited ability to extend life and is associated with some
morbidity [38-41]. The choice of additional therapies can
be justified only when symptomatic relief or maintenance
or improvement in QOL is reasonable to expect [42].
Some treatments have demonstrated beneficial effects on
disease-related symptoms and QOL [43]. The availability
of patient-reported symptom and QOL information may
be useful in helping patients and physicians make more
informed choices about treatments as well as cope with
the consequences of the choices they make [44].
Disease-specific symptom assessment has potential to
play a key role in evaluating patient-related endpoints in
clinical trials. Cancer of a specific site is often accompa-
nied by distinct constellation of symptoms. Some clinical
trials contain endpoints that include multidimensional
QOL along with disease- or treatment-specific endpoints
[45]. While the assessment of global QOL is important,
the use of global QOL scores may obscure important and
significant changes in disease-related symptoms when
those symptoms are embedded in a larger instrument
[36]. This underscores the importance of targeting some
assessment toward pre-specified, priority disease-related
symptoms. Further, the FDA Oncologic Drug Advisory
Committee (ODAC) subcommittee on QOL has
advanced the position that overall claims of QOL benefit
should not be made from one or two domain measure-
ments and that claims made in this area need to be spe-
cific to the domain that was measured [23]. An
abbreviated, symptom focused assessment could lend
support to the use of more targeted claims, such as
"symptomatic relief" or "delay of onset of tumor-related
symptoms."
The use of brief assessment tools to assess symptomatol-
ogy may serve the interests of the clinical investigators and
regulatory authorities as well as the patients being treated
for these various diseases. From a clinician's perspective,
assessment of symptomatology may represent an efficient
and clinically-relevant means of obtaining information
related to the symptom component of QOL. It may also
help identify patients who would benefit from palliative
interventions [17]. Systematic symptom assessment may
help to clarify a treatment's toxicity, potential palliative
benefit, or need to make a change in the patient's clinical
management [45]. It is noteworthy that a degree of
responsiveness in the 8-item index reported here is lost
relative to the full-length FACT-P. In addition, some
important areas of patient concern are necessarily omitted
from this brief index. Thus, while this eight-item scale has
Health and Quality of Life Outcomes 2003, 1 />Page 11 of 12
(page number not for citation purposes)
been shown to be a suitable index of important symptoms
associated with prostate cancer, it is not a replacement
tool for the FACT-P. Each individual user must decide
whether competing considerations of content relevance,
clinical interpretability, and length would suggest use of
one or the other in a given application. This research
expands the range of assessment and reporting options
with the FACT measurement system.
Conclusions
In summary, experts in the management of prostate can-
cer can reach consensus about the symptoms and con-
cerns that are most important to monitor when treating
patients with advanced disease. Furthermore, the symp-
toms identified by experts as the very most important to
assess in treating patients with advanced cancer can be
derived from a well-established multidimensional QOL
questionnaire. Both the FAPSI-6 and FAPSI-8 represent
the constellation of symptoms/concerns endorsed by our
sample of experts and possess adequate psychometric
properties and sensitivity to justify their use in future stud-
ies. The decision regarding six or eight items, or other rea-
sonable combinations of a priori targeted questions, can
be left to the discretion of the investigator and may be dic-
tated by preferred length of scale, weighting of symptom
category, or particular cluster of symptoms/concerns of
interest. Future work will examine the extent to which
changes in symptomatology as measured by these brief
indices translate into meaningful improvement to the
patient.
Authors' contributions
DC participated in the conception and design of the study
and in drafting the manuscript. SY participated in the
drafting of the manuscript, supervised the coordination of
the study, and performed some of the statistical analyses.
DB coordinated the study. TA participated in the coordi-
nation of the validation analyses. DS participated in the
drafting of the manuscript. All authors read and approved
the final manuscript.
Additional material
Acknowledgements
The research reported here was supported by a grant from Abbott
Laboratories.
References
1. Portenoy RK, Thaler HT, Kornblith AB, McCarthy Lepore J, Fried-
lander-Klar H, Coyle N, Smart-Curley T, Kemeny N, Norton L,
Hoskins W, Scher H: Symptom prevalence, characteristics and
distress in a cancer population. Qual Life Res 1994, 3:183-189.
2. Coons SJ, Kaplan RM: Assessing health-related quality of life:
application to drug therapy. Clin Ther 1992, 14:850-858.
3. Esper P, Hampton JN, Smith DC, Pienta KJ: Quality-of-life evalua-
tion in patients receiving treatment for advanced prostate
cancer. Oncol Nurs Forum 1999, 26:107-112.
4. Esper P, Mo F, Chodak G, Sinner M, Cella D, Pienta KJ: Measuring
quality of life in men with prostate cancer using the Func-
tional Assessment of Cancer Therapy-Prostate Instrument.
Urology 1997, 50:920-928.
5. Aaronson NK, Ahmedzai S, Bergman B, Bullinger M, Cull A, Duez NJ,
Filiberti A, Flechtner H, Fleishman SB, deHaes JC: The European
Organization for Research and Treatment of Cancer QLQ-
C30: A Quality-of-Life Instrument for use in international
clinical trials in oncology. J Natl Cancer Inst 1993, 85:365-376.
6. Cella DF, Tulsky DS, Gray G, Sarfian B, Lloyd S, Linn E, Bonomi A, Sil-
berman M, Yellen SB, Winicour P, Brannon J, Eckberg K, Purl S, Blen-
dowski C, Goodman M, Barnicle M, Stewart I, McHale M, Bonomi P,
Kaplan E, Taylor S, Thomas C, Harris J: The Functional Assess-
ment of Cancer Therapy (FACT) Scale: Development and
validation of the general measure. J Clin Oncol 1993, 11:570-579.
7. Cella D, Bonomi AE: Measuring quality of life: 1995 update.
Oncology 1995, 9:47-60.
8. Schag CA, Heinrich RL: Development of a comprehensive qual-
ity of life measurement tool: CARES. Oncology (Huntingt) 1990,
4:135-138.
9. Bezjak A, Taylor KM, Ng P, Macdonald K, DePetrillo AD: Quality-
of-life information and clinical practice: The oncologist's
perspective. Cancer Prevention and Control 1998, 2:230-235.
10. Deyo RA, Patrick DL: Barriers to the use of health status meas-
ures in clinical investigation, patient care, and policy
research. Med Care 1989, 27:S254-268.
11. Nelson EC, Berwick DM: The measurement of health status in
clinical practice. Med Care 1989, 27:S77-S90.
12. Taylor KM, Macdonald KG, Bezak A, Ng P, DePetrillo AD: Physi-
cians' perspective on quality of life: An exploratory study of
oncologists. Qual Life Res 1996, 5:5-14.
13. Fish LS, Lewis BE: Quality of life issues in the management of
ovarian cancer. Semin Oncol 1999, 26:32-39. (Suppl 1)
14. Morris J, Perez D, McNoe B: The use of quality of life data in clin-
ical practice. Qual Life Res 1998, 7:85-91.
15. Browman GP: Science, language, intuition, and the many
meanings of quality of life. J Clin Oncol 1999, 17:1651-1653.
16. Gill TM, Feinstein AR: A critical appraisal of the quality of qual-
ity-of-life measurements. JAMA 1994, 272:619-626.
17. Guyatt G, Feeny DH, Patrick DL: Measuring health-related qual-
ity of life. Ann Int Med 1993, 118:622-629.
18. Hopwood P: Progress, problems, and priorities in quality of
life research. Eur J Cancer 1992, 28A:1748-1752.
19. Skeel R: Quality of life dimensions that are most important to
cancer patients. Oncology 1993, 7:55-70.
20. Wilson IB, Cleary PD: Linking clinical variables with health-
related quality of life: A conceptual model of patient
outcomes. JAMA 1995, 273:59-65.
21. Johnson JR, Temple R: Food and Drug Administration require-
ments for approval of new anticancer drugs. Cancer Treat Rep
1985, 69:1155-1157.
22. Rothermich EA, Pathak DS: References for health-related qual-
ity of life claims in prescription drug advertisements. Am J
Health Syst Pharm 1997, 54:2596-2599.
23. Center For Drug Evaluation And Research, Food And Drug
Administration, Quality Of Life Subcommittee of the Onco-
logic Drugs Advisory Committee, meeting. . February 10, 2000
24. Cella D, Paul D, Yount S, Winn R, Chang CH, Banik D, Weeks J:
What are the most important symptom targets when treat-
ing advanced cancer? A survey of providers in the National
Comprehensive Cancer Network (NCCN). Cancer Invest in
press.
25. Clark JA, Wray NP, Ashton CM: Living with treatment decisions:
Regrets and quality of life among men treated for metastatic
prostate cancer. J Clin Oncol 2001, 19:72-80.
Additional File 1
Appendix
Click here for file
[ />7525-1-69-S1.doc]
Publish with BioMed Central and every
scientist can read your work free of charge
"BioMed Central will be the most significant development for
disseminating the results of biomedical research in our lifetime."
Sir Paul Nurse, Cancer Research UK
Your research papers will be:
available free of charge to the entire biomedical community
peer reviewed and published immediately upon acceptance
cited in PubMed and archived on PubMed Central
yours — you keep the copyright
Submit your manuscript here:
/>BioMedcentral
Health and Quality of Life Outcomes 2003, 1 />Page 12 of 12
(page number not for citation purposes)
26. Cella D, Bonomi AE, Lloyd SR, Tulsky DS, Kaplan E, Bonomi P: Reli-
ability and validity of the Functional Assessment of Cancer
Therapy – Lung (FACT-L) quality of life instrument. Lung
Cancer 1995, 2:199-220.
27. Brady MJ, Cella DF, Mo F, Bonomi AE, Tulsky DS, Lloyd SR, Deasy S,
Cobleigh M, Shiomoto G: Reliability and validity of the Func-
tional Assessment of Cancer Therapy-Breast (FACT-B)
quality of life instrument. J Clin Oncol 1997, 15:974-986.
28. Zubrod CG, Schneiderman M, Frei E III, Brindley C, Gold GL, Shnider
B, Oviedo R, Gorman J, Jones R, Jonsson U, Colsky J, Chalmers T, Fer-
guson B, Dederick M, Holland J, Selawry O, Regelson W, Lasagna L,
Owens AH: Appraisal of methods for the study of chemother-
apy of cancer in man: Comparative therapeutic trial of nitro-
gen mustard and triethylene thiophosphoramide. J Chronic Dis
1960, 11:7-33.
29. Husted JA, Cook RJ, Farewell VT, Gladman DD: Methods for
assessing responsiveness: A critical review and
recommendations. J Clin Epidemiol 2000, 53:459-468.
30. Cohen J: Statistical power analysis for the behavioral sciences.
New York: Academic; 1977.
31. Wright BD, Masters GN: Rating Scale Analysis. Chicago: MESA
Press; 1982.
32. Andrich D: A rating formulation for ordered response
categories. Psychometrika 1978, 43:561-573.
33. Andrich D: Application of a psychometric rating model to
ordered categories which are scored with successive
integers. App Psychol Measurement 1978, 2:581-594.
34. Linacre JM, Wright BD: WINSTEPS Rasch model computer
program. Chicago: MESA Press; 2000.
35. Gleason PP, Schultz R: Assessing pharmacotherapy outcomes:
A model for clinicians. Pharmacotherapy 1996, 16:1142-1153.
36. Chang VT, Hwang SS, Feuerman M, Kasimis BS: Symptom and
quality of life surveys of medical oncology patients at a Vet-
erans Affairs Medical Center: A role for symptom
assessment. Cancer 2000, 88:1175-1183.
37. Geels P, Eisenhauer E, Bezjak A, Zee B, Day A: Palliative effect of
chemotherapy: Objective tumor response is associated with
symptom improvement in patients with metastatic breast
cancer. J Clin Oncol 2000, 18:2395-2405.
38. Kornblith AB, Herr HW, Ofman US, Scher HI, Holland JC: Quality
of life of patients with prostate cancer and their spouses: The
value of a data base in clinical care. Cancer 1994, 73:2791-2802.
39. Wilt T: Relative effectiveness and cost-effectiveness of meth-
ods of androgen suppression in the treatment of advanced
prostate cancer. Rockville, MD: Agency for Health Care Policy and
Research 1999.
40. Smith M, Kantoff P, Talcott J: Metastatic prostate cancer. Clin
Evidence 1999, 1:321-327.
41. Herr HW, Kornblith AB, Ofman U: A comparison of the quality
of life of patients with metastatic prostate cancer who
received or did not receive hormonal therapy. Cancer 1993,
71:1143-1150.
42. Fossa SD, Aaronson NK, Newling D, van Cangh PJ, Denis L, Kurth
KH, de Pauw M: Quality of life and treatment of hormone
resistant metastatic prostatic cancer – The EORTC Genito-
Urinary Group. Eur J Cancer 1990, 26:1133-1136.
43. Mahler C, Denis L: Management of relapsing disease in pros-
tate cancer. Cancer 1992, 70:329-334.
44. Moore MH, Osoba D, Murphy K, Tannock IF, Armitage A, Findlay B,
Coppin C, Neville A, Venner P, Wilson J: Use of palliative end
points to evaluate the effects of mitoxantrone and low-dose
prednisone in patients with hormonally resistant prostate
cancer. J Clin Oncol 1994, 12:689-694.
45. Ingham JM, Portenoy RK: Symptom assessment. Hematol Oncol
Clin North Am 1996, 10:21-39.