Health and Quality of Life Outcomes BioMed Central Research Open Access Validation of a general potx
Bạn đang xem bản rút gọn của tài liệu. Xem và tải ngay bản đầy đủ của tài liệu tại đây (357.65 KB, 13 trang )
BioMed Central
Page 1 of 13
(page number not for citation purposes)
Health and Quality of Life Outcomes
Open Access
Research
Validation of a general measure of treatment satisfaction, the
Treatment Satisfaction Questionnaire for Medication (TSQM),
using a national panel study of chronic disease
Mark J Atkinson*
1
, Anusha Sinha
2
, Steven L Hass
3
, Shoshana S Colman
2
,
Ritesh N Kumar
4
, Meryl Brod
5
and Clayton R Rowland
3
Address:
1
Worldwide Outcomes Research, La Jolla Laboratories, Pfizer Inc., 10777 Science Center Drive (B-95), San Diego, CA 92121-1111, USA,
2
Quintiles Strategic Research Services, Quintiles Inc., San Francisco, CA, USA,
3
Worldwide Outcomes Research, Pfizer Inc., USA,
4
University of
Michigan, College of Pharmacy, Ann Arbor, MI, USA and
5
The BROD GROUP, Mill Valley, CA, USA
Email: Mark J Atkinson* - ; Anusha Sinha - ; Steven L Hass - ;
Shoshana S Colman - ; Ritesh N Kumar - ; Meryl Brod - ;
Clayton R Rowland -
* Corresponding author
Abstract
Background: The objective of this study was to develop and psychometrically evaluate a general measure
of patients' satisfaction with medication, the Treatment Satisfaction Questionnaire for Medication
(TSQM).
Methods: The content and format of 55 initial questions were based on a formal conceptual framework,
an extensive literature review, and the input from three patient focus groups. Patient interviews were used
to select the most relevant questions for further evaluation (n = 31). The psychometric performance of
items and resulting TSQM scales were examined using eight diverse patient groups (arthritis, asthma,
major depression, type I diabetes, high cholesterol, hypertension, migraine, and psoriasis) recruited from
a national longitudinal panel study of chronic illness (n = 567). Participants were then randomized to
complete the test items using one of two alternate scaling methods (Visual Analogue vs. Likert-type).
Results: A factor analysis (principal component extraction with varimax rotation) of specific items
revealed three factors (Eigenvalues > 1.7) explaining 75.6% of the total variance; namely Side effects (4
items, 28.4%, Cronbach's Alpha = .87), Effectiveness (3 items, 24.1%, Cronbach's Alpha = .85), and
Convenience (3 items, 23.1%, Cronbach's Alpha = .87). A second factor analysis of more generally worded
items yielded a Global Satisfaction scale (3 items, Eigenvalue = 2.3, 79.1%, Cronbach's Alpha = .85). The
final four scales possessed good psychometric properties, with the Likert-type scaling method performing
better than the VAS approach. Significant differences were found on the TSQM by the route of medication
administration (oral, injectable, topical, inhalable), level of illness severity, and length of time on medication.
Regression analyses using the TSQM scales accounted for 40–60% of variation in patients' ratings of their
likelihood to persist with their current medication.
Conclusion: The TSQM is a psychometrically sound and valid measure of the major dimensions of
patients' satisfaction with medication. Preliminary evidence suggests that the TSQM may also be a good
predictor of patients' medication adherence across different types of medication and patient populations.
Published: 26 February 2004
Health and Quality of Life Outcomes 2004, 2:12
Received: 15 February 2004
Accepted: 26 February 2004
This article is available from: />© 2004 Atkinson et al; licensee BioMed Central Ltd. This is an Open Access article: verbatim copying and redistribution of this article are permitted in all
media for any purpose, provided this notice is preserved along with the article's original URL.
Health and Quality of Life Outcomes 2004, 2 />Page 2 of 13
(page number not for citation purposes)
Background
This article reports on the development and testing of the
Treatment Satisfaction Questionnaire for Medication
(TSQM) and builds on the conceptual framework of
Treatment Satisfaction (TS) which is featured in a com-
panion article entitled: "The Development of a Concep-
tual Framework for Treatment Satisfaction." (a
manuscript currently under review). Within this paper, we
will begin by reviewing current literature that highlights
the clinical importance of TS, as well as some of the meas-
urement challenges facing researchers in this field. This is
followed by description of a two-stage TSQM item gener-
ation process that included both patient focus groups and
patient interviews. The results section presents the analy-
ses used for TSQM scale identification and psychometric
testing. These results were based on a large sample of
patients enrolled in the NFO World Group's Chronic Ail-
ment Panel (NFO-CAP). Finally, in the discussion section
we focus on the psychometric characteristics of the TSQM,
the comparative performance of two different methods
for item scaling, and the potential uses of TS assessment
in clinical settings.
Those advocating collaborative (patient-caregiver) mod-
els of health care delivery suggest that patient reported
outcomes (PROs), and particularly measures of patient
preference, ought to play a central role in the planning
and delivery of medical care [1-3]. A subclass of PRO
measures, patient satisfaction, has been used extensively
to include patients' perceptions of care when evaluating
the effectiveness of medical treatments and systems of
healthcare delivery [4-7]. Patient satisfaction has been
shown to affect patients' health-related decisions and
treatment-related behaviors, which in turn, substantially
impact the success of treatment outcomes [8,9]. For exam-
ple, patients' satisfaction with the services they receive has
been shown to predict treatment success, medical compli-
ance, follow-through with treatment plans, and appropri-
ate use of services [10-12]. In a similar way, patients'
satisfaction with their medication predicts continuance of
pharmaceutical treatment, correct medication use and
compliance with medication regimens [13-16].
A variety of models have been used to describe how
patients' satisfaction with medical treatment impacts their
health-related decision-making [17-21]. Common to
most models, it is proposed that patients' decisions to
continue, alter, or discontinue medical treatments are
influenced by a variety of characteristics, including; the
desire to participate in treatment related decision-making
[9,22] evaluation of actual and preferred health state [23-
25] prior experiences with particular treatment choices
[26] and real or anticipated beliefs regarding the effective-
ness or harms of treatment [23,25,27]. The adverse deci-
sional consequences of low TS on medication compliance
is of particular concern to those treating patients with
chronic disease conditions [12]. It has been estimated that
up to one half of patients with chronic illness end up mak-
ing medication-related decisions without seeking medical
advice, becoming 'non-adherent' to such an extent that
they compromise the effectiveness of treatment and strain
broader systems of care [28]. In contrast, more acutely ill
patients who perceive an immediate threat to their physi-
cal well-being may be more willing to tolerate short-term
aggressive treatment regimens in hopes of restoring their
former health.
In addition to its impact on treatment outcomes within
the clinical setting, TS results have been incorporated into
decisions regarding pharmaceutical formularies and cost-
effectiveness evaluations of managed care organizations
[29]. Some healthcare economists have suggested that in
the near future planners within healthcare delivery sys-
tems and pharmaceutical industries will view assessment
of treatment satisfaction as essential to their continued
viability [30,31]. The interest of multiple stakeholder
groups in TS has lead to important conceptual advances in
this field and a proliferation of satisfaction measures
[32,33]. Such measures can be roughly divided into those
addressing patients' satisfaction with discrete aspects of
medical treatments and those focusing on more systemic
aspects of programmatic care [12,34-38]. Similarly,
patients' satisfaction with their medication (TS-M) can be
thought of as a very specific sub-dimension (or observa-
tional context) of TS which is a broader, super-ordinate
class that encompasses patients' satisfaction with both
medicinal and non-medicinal aspects of treatment. In
turn, TS is a subset of patient satisfaction (PS) that broadly
covers all aspects of medical treatments, interpersonal
aspects of clinical care, and processes of treatment.
Measurement challenges
Unfortunately, across most illness conditions TS and PS
research has been consistently hampered by serious meas-
urement problems, including; distributional skew, ceiling
effects, and missing response data [39-47]. Since ceiling
effects and data skew reduce the power of statistical meth-
ods to detect meaningful group differences, numerous
attempts have been made to resolve these problems
including; the use of very extreme anchors, the use of non-
neutral midpoints, and the expansion of the number of
scale response options [48-50]. Nevertheless, systematic
comparisons of these approaches have been sporadic and
there remains a longstanding debate over the relative mer-
its of such methods. Results from one of the few empiri-
cally-based comparisons by Ware and Hays [51], suggest
that Likert-type scales might perform slightly better than
Visual Analogue Scale (VAS) methods. Advocates of VAS
methods contest this assertion and refer to the ease of use,
brevity and condensed layout of VAS rating scales [52].
Health and Quality of Life Outcomes 2004, 2 />Page 3 of 13
(page number not for citation purposes)
None of these scaling solutions, however, have been
shown to wholly resolve the distributional problems asso-
ciated with the cross-sectional measurement of TS and PS.
Yet, there remains a persistent and largely unquestioned
assumption that normal distributions of satisfaction
scores can be obtained if only the construct were meas-
ured correctly. As a result, there are quite a few examples
in the literature where patients' satisfaction ratings are sus-
pect of social desirability or acquiescence responses bias
[49,53]. There is a risk, however, of over generalizing an
assumed respondent bias to all types of TS measures. For
example, TS-M ratings may be less susceptible to social
desirability bias compared to PS ratings of clinical care, as
the latter is more likely to be influenced by patients' rela-
tionships with primary caregivers [54]. Moreover, if
respondents tend to acquiesce and provide satisfied
responses, it is more likely to occur when answering ques-
tions about less important or irrelevant aspects of care.
Scales composed of large numbers of detailed and treat-
ment-specific content typically contain a large number of
items that are irrelevant to the experiences of a specific
patient and thus are more susceptible to receiving a satis-
fied rating from respondents. In contrast, more generally
worded questions are composed of items that allow
respondents to interpret their meaning based on impor-
tant aspects of their own experiences. Respondents are less
likely to provide an acquiescent response to questions that
are considered personally relevant.
An alternate mechanism may help explain the skewed dis-
tribution of TS-M ratings. Over time, clinical-selection
may affect the composition of patient samples (sample
drift) and result in a skewed cross-sectional distribution of
satisfaction scores. It is hypothesized that such selection
occurs over time as patients for whom a medication is
working continue to take the medication, while those for
whom it is not working, or for whom unpleasant side
effects occur, seek alternative treatments. In general, one
might expect sample drift to be greatest during the initia-
tion of a new course of medication and, conversely, least
when either a satisfactory medication has been found or
when treatment alternatives have been exhausted. In the
latter case, access to fewer treatment alternatives may be
more likely among those with severe and persistent dis-
ease. Currently, it is unknown to what extent these various
influences shape the observed distribution of satisfaction
results in cross-sectional patient samples.
Rationale for current study
Although numerous disease-specific measures of patients'
TS and TS-M have been reported in the literature [55-60]
less attention has been paid to developing a more general
measure of TS-M; one that would permit comparisons
across medication types and patient conditions. Also, as
addressed earlier, there is an unresolved controversy over
the optimal method for scaling satisfaction items. There-
fore, two central objectives have been identified for the
current study:
• To develop a conceptually and psychometrically sound
general measure of TS-M, capable of assessing patients'
satisfaction with various medications designed to treat,
control, or prevent a wide variety of medical conditions;
and
• To examine the performance of such an instrument with
respect to scaling alternatives so as to maximize the preci-
sion and validity of the final measure.
Methods & study design
Background item generation
The design of test items for the new instrument was based
on a generalized conceptual framework of treatment satis-
faction. The initial formation of the conceptual frame-
work was grounded in a thorough review of the scientific
literature that dealt with the core TS-M domains across a
diversity of therapeutic areas. Subsequently, the draft con-
ceptual framework was more fully elaborated using qual-
itative data from patient focus group interviews. Focus
group participants (n = 30) were recruited to take part in
one of three, two-hour sessions conducted in Los Angeles,
Chicago, and Boston. Participants consisted of patients
with at least one the following illness conditions: asthma,
arthritis, cancer, cardiovascular disease, depression/anxi-
ety, diabetes, infectious disease, migraine, and psoriasis.
The focus group discussions were guided by a trained
interviewer who, in accordance with established qualita-
tive research procedures [61], focused on aspects of the
treatment satisfaction framework, outlined in a discussion
guide [62,63].
Over the course of the three focus group sessions, the dis-
cussion guide and conceptual framework on which it was
based, were evolved through integration of the patients'
perspectives from each preceding group. In this way the
guide was iteratively refined to reflect the participants'
perspectives. Once the framework was fully elaborated,
the domains of TS-M included; (1) side effects, (2) symp-
tom relief, (3) convenience, (4) effectiveness, (5) impact
on daily life, and (6) tolerability/acceptability. Fifty-five
draft TS-M items were designed to measure aspects of the
conceptual framework and its domains. Further details of
the qualitative methods and results can be found in a sis-
ter manuscript describing the development of the TS-M
conceptual framework.
Initial item reduction and scaling (patient interviews)
In-depth patient interviews were conducted in order to
reduce the 55-item pool by approximately half, leaving
only those items that were most relevant across respond-
Health and Quality of Life Outcomes 2004, 2 />Page 4 of 13
(page number not for citation purposes)
ents. The interview sample consisted of 17 patients taking
medication for the same conditions represented by focus
group participants. During the 45–60 minute interviews,
patients rated the importance or relevance of each item to
their satisfaction with their medication using a 5-point
scale (where 1 was most important and 5 was not impor-
tant at all). These ratings were used to select items that
were most relevant across all illness groups. When items
were ranked equally, the conceptual framework was used
to help assure adequate representation of theoretical
dimensions in the framework. The final test item pool
contained 31 items.
Two scaling methods, visual analogue scaling (VAS) and
Likert-type scaling, were considered for use in the final
instrument. In order to compare the relative performance
of the two methods, two sets of TSQM items were created
that differed only in terms of the rating scale used. For
both sets, TSQM items were scaled using either a 5-point
or 7-point scale. Five-point scales were used for unidimen-
sional continua (e.g. extremely to not at all), while 7-
point scales were used for bipolar continua (e.g.,
extremely positive to extremely negative). This provided
roughly equivalent rating intervals across items. Non-neu-
tral midpoints were used for 7-point scales, resulting in a
greater range of positive response options than negative
options for these items. This approach has been suggested
elsewhere as a way of helping to address scale resolution
problems associated with the upper end of skewed distri-
butions [48].
Psychometric testing and refinement (national panel
survey)
The remaining sections of this article describe the reliabil-
ity and validity characteristics of the test items and scaling
methods using a large sample of patients participating in
the NFO – World Group's CAP. The NFO CAP consists of
over 250,000 people suffering from one or more of over
60 chronic ailments and conditions. The panel is a repre-
sentative sampling of one out of every 191 households in
America, prescreened for more than 50 pieces of demo-
graphic information so as to represent the demographic
characteristics of the population of the citizenry of the
USA (for more information see:
).
Patients were recruited for this portion of the study that
had the same illness conditions as represented within the
focus groups and interviews (anxiety/depression, arthritis,
asthma, cancer, cardiovascular disease, diabetes, infec-
tious disease, migraine, and psoriasis). They were also
required to be at least 18 years of age, able to read English,
and able to complete a questionnaire on-line. The broad
sampling provided a range of treatment intents (i.e., cura-
tive, preventive and symptom management) as well as
routes of medication administration (i.e., injection, oral,
topical, inhalation).
Invitations were sent electronically to 10,000 NFO panel
members across the United States. Participants that
accessed the study site via the Internet were assessed for
eligibility, equally stratified by illness condition and gen-
der, and then randomly assigned into 1 of the 2 scale con-
ditions (VAS or Likert-type scaling methods). Since many
participants had multiple illness conditions, and were on
several medications at the same time, respondents were
helped to clearly identify which particular medication and
illness condition were the subject of study. A total of
6,713 individuals responded (a response rate of 67.2%),
from this pool individuals were sequentially offered the
opportunity to participate based on the availability of par-
ticipant slots in each stratum. Five hundred and eighty
seven individuals passed screening and were enrolled, of
these, 567 provided complete data sets, with 287 respond-
ents in the VAS arm and 280 in the Likert-type arm.
In addition to completing the test items, respondents were
asked to provide information about the length of time
they had been on their medication, the method of its
administration, the frequency and severity of any side
effects they might have experienced, and the likelihood
that they would continue to take the medication given its
current level of effectiveness and side effects. They were
also asked about perceptions of their current state of
health, the severity of their illness, and some basic socio-
demographic information (e.g., age, gender, educational
level, and ethnic background).
Results
Respondent characteristics
Respondents' ages ranged from 18 to 88 years, with a
mean of 50.5 (SD 13.0), which did not differ significantly
from the total NFO representative sampling (mean 48.8,
SD 13.4). Thirty nine percent of respondents indicated
that they had received four or more years of college edu-
cation, and 60.1% stated that they were employed full-
time. The educational proxy for socioeconomic status was
roughly equivalent for the original NFO recruitment sam-
ple (31%). Table 1 presents the number of NFO respond-
ents in each of the illness groups, the length of time on the
current medication, the route of its administration, their
rating of the severity of illness, and their rating of current
health status. Approximately 70% of the sample reported
on an oral medication, while the remaining 30% reported
on medications that were used in a topical, inhalable, or
injectable form. As expected given the randomization pro-
cedure, no significant differences were found between the
scaling condition groups (Likert vs. VAS) by gender, age,
educational level, employment status, ethnicity, mode of
Health and Quality of Life Outcomes 2004, 2 />Page 5 of 13
(page number not for citation purposes)
medication administration or length of time on
medication.
Construct dimensionality of the TSQM
Multi-step exploratory factor analyses (EFA) were
employed to investigate the construct validity of the
TSQM. Two separate EFAs were conducted, one using glo-
bal TS-M items, and another using items that referred to
more specific domains of medication experiences (e.g.,
Effectiveness, Side effects, Convenience) [64]. Such multi-
step EFA procedures have been recommended by Gorsuch
[65,66] and Russell [67] as a way to evaluate the structure
and dimensionality of measures that include both global
and specific item content. The global TS-M items are super
ordinate conceptually and psychologically, and thus may
be redundant and confounding measures of the construct.
As the goal is to identify the underlying construct or fac-
tor, redundant and confounding variance should be min-
imized. The confounding of subordinate construct
dimensionality by global items shows up as unwanted
covariance, manifest as cross-loading of global items
across the more specific factors. As a result, separate anal-
yses of global and specific items provide scales with
greater cohesion and homogeneity than when such a
process is not followed.
A first EFA employed principal components extraction
and a subsequent orthogonal varimax rotation of the
more specific TS-M items. This resulted in a three-factor
solution that accounted for 68.3% of the total variance.
Items with the greatest loadings on these factors were then
selected for inclusion in the final TSQM scales. The three
factors in the final solution converged in five iterations,
possessed Eigenvalues greater than 1.7 and explained
75.6% of the overall variance (see Table 2). These were
labeled according to their item content: Side effects
(SIDEF: 4 items, 28.4% of the variance), Effectiveness
(EFFECT: 3 items, 24.1%), and Convenience (CONV: 3
items, 23.1%).
A second EFA (principal component extraction and var-
imax rotation) was conducted using responses to five glo-
bal satisfaction items, comprising a conceptually distinct
second order factor of TS-M. Three items with the highest
loadings were selected for final inclusion. The final solu-
tion was unidimensional (Eigenvalue = 2.3), with factor
loadings between .86 and .90, which explained 79.1% of
the total variance. The three items asked about were; 1)
the confidence individuals had in the benefits of the med-
ication, 2) their comparative evaluation of the benefits
versus drawbacks of the medication, and 3) their overall
satisfaction with the medication. The final instrument
(see Table 3) consisted of 13 items that made up three spe-
cific scales (EFFECT, SIDEF, CONV) and one global satis-
faction scale (GLOBAL). Scale scores were transformed
into scores ranging from 0 to 100. The inter-correlations
between scales shown in Table 4, suggest that the strong-
est specific-scale correlate of GLOBAL was EFFECT. It
would be surprising if this were not the case, since medi-
cation is typically taken for its curative effects. SIDEF and
CONV ratings were about equally correlated with results
on the GLOBAL satisfaction scale.
Scale characteristics and scaling comparisons
The performance of the two scaling methods was evalu-
ated based on the strength of the factorial solution and the
estimates of internal consistency of resulting TSQM scales.
The factorial dimensionality and item loading order were
the same using either scaling dataset. However, the
strength of the factorial solution and Cronbach's Alpha
coefficients were greater when using the Likert-type results
compared to the VAS results. As expected, the score distri-
butions resulting from both scaling methods were charac-
terized by ceiling effects and skew that plague this class of
PRO instrumentation (Table 5) [11,23,36,40]. Of note,
the VAS scaling method had more problems with ceiling
effects than the Likert-type scaling method, particularly on
items making up GLOBAL. The Likert-type method
tended to have higher skew statistics on two scales due to
Table 1: TSQM Validation Survey: Respondent Characteristics (n = 567)
Illness Group Major Route of Admin:
Total (%)
Weeks on Medication
Mean (SD)
Health Rating
+
Mean
(SD)
Illness Severity
++
Mean
(SD)
Migraine (n = 68) Oral: 60 (88.2%) 57.2 (76.4) 2.8 (.8) 1.9 (.6)
Arthritis (n = 75) Oral: 71 (94.7%) 38.2 (40.4) 2.9 (.9) 1.9 (.6)
High BP (n = 76) Oral: 76 (100%) 52.1 (53.2) 2.5 (.8) 1.7 (.6)
Asthma (n = 72) Inhaled: 62(86.1%) 92.4 (114.8) 2.9 (1.0) 1.8 (.7)
Diabetes (n = 63) Injected: 53 (84.1%) 125.0 (115.4) 3.4 (.9) 2.2 (.5)
Psoriasis (n = 63) Topical: 53 (84.1%) 49.7 (60.1) 2.9 (.9) 1.7 (.6)
High Cholesterol (n = 75) Oral: 75 (100%) 31.0 (34.7) 2.8 (1.0) 2.0 (.6)
Depression (n = 75) Oral: 75 (100%) 42.9 (42.7) 2.6 (.9) 2.1 (.5)
+
1 = Excellent, 2 = Very Good, 3 = Good, 4 = Fair, 5 = Poor;
++
1 = Mild, 2 = Moderate, 3 = Severe
Health and Quality of Life Outcomes 2004, 2 />Page 6 of 13
(page number not for citation purposes)
a more pronounced taper on the lower (dissatisfied) end
of the scales.
Possible reasons for the distributional skew of SIDEF were
explored further. The removal of respondents who
reported rare or very infrequent side effects from the sam-
Table 2: Loadings of Treatment Satisfaction with Medication Items (n = 567)
Factor I Factor II Factor III
Side effects 1: Side effects interfere with physical function .89 .10 .16
Side effects 2: Bothersomeness of side effects .87 .09 .13
Side effects 3: Side effects interfere with mental function .79 .05 .14
Side effects 4: Side effects impact overall satisfaction .76 .19 .06
Effectiveness 1: Ability to prevent or treat the condition .14 .90 .06
Effectiveness 2: Ability to relieve symptoms .13 .88 .08
Effectiveness 3: Time it takes medication to start working .09 .85 .09
Convenience 1: Convenience of administration .16 .15 .88
Convenience 2: Ease/Difficulty of planning .12 .11 .88
Convenience 3: Ease/Difficulty following schedule .14 .06 .86
75.6% of Total Variance Explained; by Factor I (28.4%), Factor II (24.1%) and Factor III (23.1%)
Table 3: Final Items for the Treatment Satisfaction Questionnaire for Medication (TSQM)
++
Item # TSQM Item
1* How satisfied or dissatisfied are you with the ability of the medication to prevent or treat your condition?
2* How satisfied or dissatisfied are you with the way the medication relieves your symptoms?
3* How satisfied or dissatisfied are you with the amount of time it takes the medication to start working?
4** As a result of taking this medication, do you currently experience any side effects at all?
5 How bothersome are the side effects of the medication you take to treat your condition?
6 To what extent do the side effects interfere with your physical
health and ability to function (i.e., strength, energy levels, etc.)?
7 To what extent do the side effects interfere with your mental
function (i.e., ability to think clearly, stay awake, etc.)?
8 To what degree have medication side effects affected your overall satisfaction with the medication?
9 How easy or difficult is it to use the medication in its current form?
10 How easy or difficult is it to plan when you will use the medication each time?
11 How convenient or inconvenient is it to take the medication as instructed?
12 Overall, how confident are you that taking this medication is a good thing for you?
13 How certain are you that the good things about your medication outweigh the bad things?
14* Taking all things into account, how satisfied or dissatisfied are you with this medication?
* These items are scaled on a seven point bipolar scale from 'Extremely Satisfied' to 'Extremely Dissatisfied'. **Item #4 is a dichotomous response
option with a conditional skip to item #9.
++
Obtaining the TSQM: Electronic versions of the TSQM in multiple languages and scoring algorithms
are available by contacting Quintiles, Inc. (415.633.3100/3243, FAX 415.633.3133, )
Table 4: Interscale correlation matrices* for VAS/Likert-type methods
Effectiveness (EFFECT) Side effects (SIDEF) Convenience (CONV)
VAS** Likert*** VAS** Likert*** VAS** Likert***
Effectiveness 1.00 1.00
Side effects .23 .37 1.00 1.00
Convenience .22 .36 .33 .35 1.00 1.00
Global Satisfaction .60 .72 .36 .43 .41 .48
* Spearman correlations are significant at the .0001 level (2-tailed); **VAS sample (n = 287); ***Likert type sample (n = 280)
Health and Quality of Life Outcomes 2004, 2 />Page 7 of 13
(page number not for citation purposes)
ple resulted in an essentially normal distribution (skew =
13, <4% of scores at ceiling value). This suggested that
respondents appropriately provided high satisfaction rat-
ings in situations where the side effects of the medication
were very infrequent. Thus, the skew and ceiling effects
associated with this particular scale do not seem to be sim-
ply due to problems associated with an uninterpretable
respondent bias.
Medication and illness characteristics associated with
treatment satisfaction
No significant differences in mean TSQM scale scores
were observed by gender or education level. Significant
differences in satisfaction levels were found on all TSQM
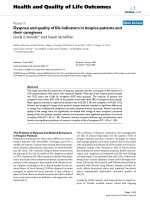
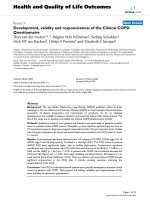
scales by route of medication administration (Figure 1).
As documented elsewhere, individuals using injectables
reported low satisfaction with convenience of use [68].
Also, despite low ratings on SIDEF and CONV by the
injectable group, the GLOBAL and EFFECT ratings were
highest – presumably due to the influence of insulin-
dependence in our injectable sample. Also, consistent
with other research, high GLOBAL and CONV ratings
were associated with orally administered medications
[68-70] although satisfaction with the effectiveness of oral
medications was a bit lower than with the injectables. The
topicals were associated with the highest levels of satisfac-
tion with SIDEF and CONV, but the lowest levels of on the
GLOBAL and EFFECT scales – likely due to their safety and
ease of use, but relative ineffectiveness at treating the con-
Table 5: The Distributional and Scale Characteristics of the TSQM
Scale Mean (SD) Cronbach's Alpha % Scores at Scale Ceiling Skewness**
TSQM
Scales
VAS Method
(n = 287)
Likert Method
(n = 280)
VAS Method Likert
Method
VAS Method Likert Method VAS Method Likert Method
Effectiveness 69.7 (21.8) 68.6 (20.4) .87 .88 13.0% 8.9% 47 76
Side effects 84.3 (19.2) 83.7 (19.5) .84 .88 44.3% 41.1% -1.1 -1.2
Convenience 84.9 (19.7) 83.2 (18.7) .86 .90 44.9% 36.8% -1.3 -1.1
Global
Satisfaction
78.0 (20.4) 71.1 (22.6) .80 .86 25.1% 12.9% 81 97
** Skewness Standard Error VAS Method = .14, Likert-type Method = .15
Table 6: Comparison of Satisfaction with Oral Medication by Patients' Ratings of Seriousness of Illness and Health Appraisal (n = 378)
Seriousness of Illness
Mild (n = 87)
Mean (SD)
Moderate (n =
237)
Mean (SD)
Severe (n = 54)
Mean (SD)
F Value p Value
Effectiveness 73.5 (18.9) 70.2 (19.2) 64.8 (25.5) 3.09 .05
Side effects 90.9 (15.1) 84.6 (18.7) 73.6 (24.0) 14.17 .000
Convenience 92.6 (11.5) 90.2 (14.2) 84.2 (19.5) 5.79 .003
Global 80.2 (19.4) 75.8 (18.8) 67.3 (28.2) 6.57 .002
Appraisal of Health
Excellent (n =
23)
Mean (SD)
Very Good (n
= 139)
Mean (SD)
Good (n = 153)
Mean (SD)
Fair (n = 48)
Mean (SD)
Poor (n = 15)
Mean (SD)
F Value p Value
Effectiveness 76.6 (23.5) 75.9 (17.7) 67.5 (19.1) 61.6 (19.4) 63.3 (33.4) 7.03 .000
Side effects 91.8 (17.5) 88.3 (16.9) 81.7 (20.6) 81.4 (20.8) 75.8 (19.9) 4.08 .003
Convenience 92.8 (16.3) 92.8 (11.3) 87.9 (15.7) 88.5 (15.9) 83.3 (20.1) 3.21 .013
Global 81.1 (22.6) 82.4 (16.6) 71.9 (20.6) 68.6 (21.7) 64.8 (32.1) 8.20 .000
Health and Quality of Life Outcomes 2004, 2 />Page 8 of 13
(page number not for citation purposes)
dition, which in this case was psoriasis [71]. Taken
together, these observations provide some evidence for
the criterion-related validity of the TSQM scales.
Consistent with earlier discussion of clinical drift, individ-
uals on medication for less than two months reported sig-
nificantly lower satisfaction with both the effectiveness
and side effects of their medication than those on medica-
tions for a longer period (68.3, sd 18.8 vs. 74.4, sd 17.2,
F(df) = 8.57(1), p = .004; 84.6, sd 16.4 vs. 88.4, sd 14.2;
F(df) = 4.76(1), p = .03 respectively). This observation
provides preliminary evidence that individuals who con-
tinue to experience either low effectiveness or trouble-
some side effects may be more likely to switch or
discontinue their medication, and thus contribute to the
changing distributional characteristics of cross-sectional
satisfaction data over time. Illness conditions also
appeared to influence satisfaction levels. Higher illness
severity ratings were associated with lower levels of satis-
faction on all TSQM scales, particularly SIDEF. Similarly,
poorer appraisal of general health was associated with
lower satisfaction scores on all scales, particularly EFFECT
(Table 6). These findings are likely due to the inability of
the current medication to cure or effectively manage the
condition without intolerable side effects. The availability
of, and access to, alternative treatment options may also
have prevented 'clinical drift' and, as a result, influenced
the distribution of patients' satisfaction scores.
Determinants of overall satisfaction and medication
persistence
A series of regression analyses were used to examine the
specific aspects of TS-M that predicted GLOBAL TSQM sat-
isfaction ratings. Table 7 presents the standardized beta
coefficients and percent variance explained (Adjusted R
2
)
within these statistical models. The three specific TSQM
scales were all entered as independent variables and GLO-
BAL as the dependent variable for each different illness
Mean Medication Satisfaction Levels by Route of AdministrationFigure 1
Mean Medication Satisfaction Levels by Route of Administration Notes: Effectiveness by Route, F(3,552) = 11.98, p <
.0001 Side Effects by Route, F(3,552) = 5.87, P < .001 Convenience by Route, F(3, 552) = 58.92, p < .0001 Global by Route, F(3,
552) = 4.89, p < .01
Route of Administration
InhalerInjectionTopicalOral
Mean Satisfaction Score
100
90
80
70
60
50
40
Satisfaction w/:
Effectiveness
Side Effects
Convenience
Global
Health and Quality of Life Outcomes 2004, 2 />Page 9 of 13
(page number not for citation purposes)
group. Across all groups, between 40–70% of the variance
in GLOBAL ratings were explained by satisfaction ratings
on the three specific TSQM scales. Moreover, EFFECT
accounted for the most variance in GLOBAL, while the rel-
ative influence of the two other specific scales varied
across illness groups.
In order to explore the effects of TS-M on patients' choice
to either continue or discontinue using a medication, a
composite variable was derived – "Likelihood to
Discontinue" medication. This variable was computed by
taking the respondents' ratings of their 'likelihood to con-
tinue on the current medication given its current level of
effectiveness' and subtracting it from ratings of their 'like-
lihood to request a change in medication due to current
side effects. The four TSQM scale scores were then entered
as independent variables into a stepwise multiple regres-
sion analysis. The final model contained 3 of the 4 satis-
faction scales; GLOBAL, SIDEF and EFFECT (Adjusted R
2
= .50, F(3,563) = 186.2, p < .0001). GLOBAL accounted
for more variance than did the more specific TSQM scales
and was the most significant independent variable
accounting for medication non-persistence (standardized
Beta coefficient = 35, p < .0001). This scale was followed
by SIDEF (Beta = 22, p < .0001) and EFFECT (Beta = 28,
p < .0001). On its own, CONV was not found to be signif-
icantly correlated to respondents' ratings of Likelihood to
Discontinue medication.
Results in Table 8 hint at the strength of the association
between patients' TS-M and their expectations regarding
future persistence with their medication regimen. Across
six of the eight illness groups between 50 and 60% of the
variation patients' expected persistence with medication
was predicted by TSQM scores.
Discussion
Sampling considerations
The response by two-thirds of the NFO panel invitees was
much greater than that usually found for broad and less
targeted Internet-based health surveys, which typically
range between 20–30% [72-75]. Nevertheless, our sam-
ples should not be considered representative of the
general US population, and only, at best, an approximate
sampling of membership within each of the illness pan-
els. Fortunately, concerns about sampling bias are rarely
Table 7: Standardized Beta Regression and shared variance estimates of specific satisfaction scales Predicting global satisfaction ratings
by illness group (n = 567)
Effectiveness Side effects Convenience Adjusted R Squared*
Migraine .57*** .27** .49
Arthritis .53*** .34*** .52
Depression .73*** .21** .18** .72
Asthma .52*** .33*** .51
Diabetes .57*** .20* .25* .67
Psoriasis .54*** .26** .23* .60
Cholesterol .48*** .36*** .43
Hypertension .60*** .19* .23** .59
*Regression Model: Effectiveness + Side effects + Convenience = Global Satisfaction
Table 8: Standardized Beta Regression Coefficients and Shared Variance Estimates of Satisfaction Variables Predicting Ratings of
Likelihood to Change Medication by Illness Group (n = 567)
Global Satisfaction Effectiveness Side effects Convenience Adjusted R Squared*
Migraine 37*** 32** 28** .61
Arthritis 46*** 23* 23* .59
Depression 51*** 37*** .56
Asthma 44*** 29* .42
Diabetes 37** 47*** .60
Psoriasis 31* 40*** 23* .56
Cholesterol 40*** 49*** .55
Hypertension 36*** 28** .26
*Regression Model: Effectiveness + Side effects + Convenience + Global Satisfaction = Likelihood to Change Medication
Health and Quality of Life Outcomes 2004, 2 />Page 10 of 13
(page number not for citation purposes)
raised as a serious criticism in this type of psychometric
study, since the main objective is to empirically examine
the content and measurement dimensions that underpin
a theoretical construct. So long as the constructs of meas-
ure remain fairly consistent across the illness populations,
it is unlikely that a moderate degree of sampling and selec-
tion bias alters the item-item covariance structure used to
identify the dimensionality of such constructs. Such bias
becomes more problematic where determination and
comparison of score levels is of interest, as is the case
when estimating population parameters or testing group
score differences.
A more serious threat to demonstration of the construct
validity of the TSQM, however, is the interdependency
between illness conditions, illness severity, and medica-
tion type. Such interdependencies preclude a clear deline-
ation of their independent effects on TSQM results. This
concern became most apparent during our examination
of the effects of the route of medication administration on
TSQM results. It was not possible to clearly separate the
effects of medication route from illness group member-
ship, a fact that we acknowledged when describing these
results.
TSQM performance
Given the heterogeneity of the sample, the reliability and
construct validity characteristics of the TSQM scales were
surprisingly strong. The internal consistency estimates of
the scales were high given the small number of items and
their broad content coverage. The patterns of item load-
ings within the factor analyses provide clear evidence for
the orthogonal dimensionality of the three specific TSQM
scales and, by inference, discrete sub-dimensionality of
the TS-M construct. In turn, when predicting GLOBAL rat-
ings, the regression weights associated with specific TSQM
scales differed across illness groups, reflecting the different
importance of TS-M dimensions to overall satisfaction
across illness/medication types. This finding provides fur-
ther evidence that GLOBAL cannot be simplified to a
generalizable summation of specific scales across all ill-
ness groups since the relative weighting of specific aspects
of TS-M on GLOBAL scores appears to be influenced by
both medication-specific and disease-specific experience
across patient groups. Despite its non-uniform derivation,
the importance of GLOBAL was manifest through its cor-
relation with patients' perception of treatment persistence
(likelihood to continue/discontinue medication), which
was stronger than any specific dimension of TS-M, even
the effectiveness dimension.
The results of scaling comparisons (VAS versus Likert-type
method) support earlier work by Ware and Hays [51] that
reported better predictive performance of a Likert-type
scaling compared to VAS scaling of TS items. Despite our
best efforts to assure both metric and sample equivalence
between the two scaling conditions, better distributional
characteristics and lower measurement error was associ-
ated with the Likert approach, particularly on GLOBAL. As
a result, this scaling method was associated with a greater
proportion of meaningful variance across a variety of par-
ametric analyses. Moreover, a commonly cited advantage
of VAS type scales is ease of completion, yet when asked,
the patients in the two scaling conditions did not differ on
the reported ease of questionnaire completion. As a result,
the Likert-type scaling method was selected to scale the
final version of the TSQM.
Atypical cross-sectional score distributions
As expected, our scaling efforts did not effectively correct
the distributional problems. Indeed, some of the most
consistent findings in the PS literature are the persistent
distributional skew and ceiling effects associated with this
type of data. One of major causes of such skew in the cur-
rent study was item relevance. This was clearly demon-
strated using SIDEF items, where satisfaction ratings were
consistently high when problems with side effects were
rare or non-existent. Approximately 50% of the sample
reported rarely experiencing side effects and, when this
was taken into account, the distribution of SIDEF satisfac-
tion scores became essentially normal. A similar pattern of
results might have occurred for CONV, however, informa-
tion on the frequency of inconvenient medication-related
events was not collected.
In addition to item relevance, we hypothesized that a por-
tion of the skew and ceiling effects might be due to a con-
tinuous self- and clinical-selection process, leading to
sample drift as over time, individuals who are less satis-
fied with either the effectiveness or side effects of their
medication seek alternatives. Supporting this idea,
respondents' length of time on medication was positively
associated with mean differences on both EFFECT and
SIDEF. Those on medications for more than two months
expressed higher levels of satisfaction on the two dimen-
sions of TS-M. Moreover, the distributions of scores had
greater skew towards the more satisfied end of the
continuum.
Acting against such a trend may be a lack of effective treat-
ment alternatives for those with more serious conditions.
Respondents who rated themselves as either in worse
health, or as more ill, were less satisfied across all TSQM
scales. One might hypothesize that patients with more
severe conditions may have been willing to tolerate higher
side effects in order to affect a cure. However, this does not
easily explain the lower EFFECT scores also reported by
persons with poor health ratings. It is most likely that less
satisfaction with the effectiveness of treatment is associ-
Health and Quality of Life Outcomes 2004, 2 />Page 11 of 13
(page number not for citation purposes)
ated with treatment resistant illness conditions and/or
fewer effective treatment alternatives.
Our results suggest that non-normal distribution of cross-
sectional satisfaction scores should not be quickly dis-
missed as an artifact of systematic respondent bias, but
rather understood as the result of a complex interaction
between clinical-selection, the availability and effective-
ness of treatment alternatives, and respondents' health
status over time. Unfortunately, the cross-sectional design
of our current study does not permit a meaningful charac-
terization of the cumulative effects of such characteristics
on TSQM score distributions over time, and is only sug-
gestive of a need for longitudinal research to more fully
address this phenomenon.
Treatment satisfaction and the cost of care
From a disease-management perspective, it is likely that
assessment of TS-M will become increasingly important in
the future; in part due to the increasing prevalence of
chronic disease in our aging population and the increas-
ing number of patients being asked to persist with long
courses of pharmaceutical treatments. With the exception
of certain areas of medicine where patient compliance is
particularly problematic, relatively little is known about
the influence of patients' satisfaction on medication
adherence behavior. It is particularly pressing, given rising
costs of health care, to identified and address the causes of
non-adherence; since such behavior increases the use of
medical resources to manage treatment failure. While the
health care costs resulting from non-compliance are fairly
well characterized for many conditions, such costing stud-
ies less frequently include patient preference data. Longi-
tudinal economic research is required to explore these
important causal relationships.
The pharmaceutical industry may also be an interested
stakeholder. Evidence of the growing importance of
patients' satisfaction can be found at most levels of our
health service delivery systems. For example, the Health
and Human Services' Agency for Healthcare Research and
Quality and the American Hospitals' Association has
recently begun to require that patient satisfaction data be
published by hospitals to aid patients in their selection of
hospital services, and possibly informing financial reim-
bursement schedules [76]. Such developments may fore-
shadow the role of TS-M within the pharmaceutical sector,
in that TS-M outcomes directly influence the degree of
market success enjoyed by new therapeutic technologies
and medications. For example, TS-M assessment may play
an expanded role in formulary access decisions.
Relevance to the delivery of clinical care
Patients' dissatisfaction with treatment may act as an early
warning of threats to the clinical effectiveness and effi-
ciency of medical care. Patients who perceive their medi-
cation to be ineffective, laden with side effects, or very
inconvenient to use are less likely to either fill prescrip-
tions or take their medication as prescribed. This in turn
can impact the effectiveness of treatment and may result
in service inefficiencies associated with treatment failure.
TSQM provides a unique opportunity to compare various
medications used to treat a particular illness on the pri-
mary dimensions of treatment satisfaction. Routine
assessment of patients' level of TS-M provides a way for
clinicians to screen individuals whose current medication
experiences may increase the risk of poor medication
adherence. If collected from many patients, such informa-
tion could foster a deeper consideration of patients' per-
spectives when evaluating the merits and drawbacks of
various treatment alternatives.
As partial compensation for the potential drain that indi-
vidualized assessments can place on already burdened
clinical staff, the dimensionality of TSQM offers a set of
convenient reference points to quickly focus patient-car-
egiver discussion on potential problem areas, thereby
facilitating a corrective engagement process. For example,
a better appreciation of patients' experiences with a partic-
ular medication's side effects or inconveniences may lead
physicians to optimize dosing or review administration
instructions with their patients. Alternately, if patients'
dissatisfaction with the effectiveness of their medication
does not seem to be clinically warranted, some patient
education may be in order. This later point is particularly
important when the therapeutic actions of a medication
are not physically or mentally discernable by most
patients (e.g., preventive treatments of hyperlipidemia or
hypertension). In general, clinicians who show an active
interest in patients' experiences are more likely to be seen
as possessing good clinical skills and a genuine concern
for patients' well-being [77].
Conclusion
Results from this initial validation study suggest that the
TSQM is a psychometrically robust instrument, tapping
the most important dimensions of patients' experiences
with their medication. If carefully applied, the general
nature of the instrument provides a way of evaluating and
comparing patients' satisfaction with various types and
forms of medications. Moreover, the TSQM may contrib-
ute to our understanding of patients' medication-related
decisions and behaviors, thus proving TS-M to be both an
important determinant and outcome of effective clinical
care.
Authors' contributions
MJA, Principle Investigator, Project Director, Study Design
& Planning, Psychometric Design & Analysis, Primary
Authorship
Health and Quality of Life Outcomes 2004, 2 />Page 12 of 13
(page number not for citation purposes)
AS, Study Coordinator, Second Authorship, Project Man-
agement, Literature Review, Qualitative Analysis, Data
Management, Discussion Guide Design
SLH, Study Design & Planning, Contributing Author
SSC, Study Planning & Focus Group Facilitator, Design of
Qualitative Methodologies, Discussion Guide Design
RNK, Literature Review, Contributing Author
MB, Initial Conceptual Framework Design, Contributing
Author
CRR, Study Design & Planning, Contributing Author
Acknowledgements
Portions of this work have been presented at the 9
th
Annual Conference of
the International Society of Quality of Life Research, Orlando, 2002. Fund-
ing for this project was made possible by a grant from Pharmacia Corpora-
tion (now Pfizer Inc).
References
1. Golin CE, DiMatteo MR, Gelberg L: The role of patient participa-
tion in the doctor visit. Implications for adherence to diabe-
tes care. Diabetes Care 1996, 19:1153-1164.
2. Katz JN: Patient preferences and health disparities. JAMA 2001,
286:1506-1509.
3. Owens DK: Spine update. Patient preferences and the devel-
opment of practice guidelines. Spine 1998, 23:1073-1079.
4. Eriksen LR: Patient satisfaction with nursing care: concept
clarification. Journal of Nursing Measurement 1995, 3:59-76.
5. Gattellari M, Butow PN, Tattersall MH: Sharing decisions in can-
cer care. Soc Sci Med 2001, 52:1865-1878.
6. Turnbull JE, Luther KM: Patient satisfaction report paves way to
improved care. QRC Advisor 1996, 13:1-7.
7. Wright JG: Evaluating the outcome of treatment. Shouldn't
We be asking patients if they are better? J Clin Epidemiol 2000,
53:549-553.
8. Brody D, Miller S, Lerman C, Smith D, Caputo G: Patient percep-
tion of involvement in medical care: Relationship to illness
attitudes and outcomes. Journal of General Internal Medicine 1989,
4:506-511.
9. Taylor TR: Understanding the choices that patients make. Jour-
nal of the American Board of Family Practice 2000, 13:124-133.
10. Albrecht G, Hoogstraten J: Satisfaction as a determinant of
compliance. Community Dent Oral Epidemiol 1998, 26:139-146.
11. McCracken LM, Klock A, Mingay DJ, Asbury JK, Sinclair DM: Assess-
ment of satisfaction with treatment for chronic pain. Journal
of Pain & Symptom Management 1997, 14:292-299.
12. Weaver M, Patrick DL, Markson LE, Martin D, Frederic I, Berger M:
Issues in the measurement of satisfaction with treatment.
Am J Manag Care 1997, 3:579-594.
13. Anderson RB, Hollenberg NK, Williams GH: Physical Symptoms
Distress Index: a sensitive tool to evaluate the impact of
pharmacological agents on quality of life. Archives of Internal
Medicine 1999, 159:693-700.
14. Awad AG, Voruganti LN: Quality of life and new antipsychotics
in schizophrenia. Are patients better off? Int J Soc Psychiatry
1999, 45:268-275.
15. Diamond R: Drugs and the quality of life: the patient's point of
view. Journal of Clinical Psychiatry 1985, 46:29-35.
16. Adverse effects of the atypical antipsychotics. Collaborative
Working Group on Clinical Trial Evaluations. J Clin Psychiatry
1998, 59(Suppl 12):17-22.
17. Gelber RD, Gelman RS, Goldhirsch A: A quality-of-life-oriented
endpoint for comparing therapies. Biometrics 1989, 45:781-795.
18. Gopalakrishna P, Mummalaneni V: Examination of the role of
social class as a predictor of choice of health care provider
and satisfaction received a model and empirical test. Journal of
Ambulatory Care Marketing 1992, 5:35-48.
19. Greiner DL, Addy SN: Sumatriptan use in a large group-model
health maintenance organization. American Journal of Health-Sys-
tem Pharmacy 1996, 53:633-638.
20. Llewellyn-Thomas HA: Investigating patients' preferences for
different treatment options. Canadian Journal of Nursing Research
1997, 29:45-64.
21. Schommer JC, Kucukarslan SN: Measuring patient satisfaction
with pharmaceutical services. American Journal of Health-System
Pharmacy 1997, 54:2721-2732.
22. Robinson A, Thomson R: Variability in patient preferences for
participating in medical decision making: implication for the
use of decision support tools. Quality in Health Care 2001,
10(Suppl 1):i34-i38.
23. Fraenkel L, Bodardus S, Wittink DR: Understanding patient pref-
erences for the treatment of lupus nephritis with adaptive
conjoint analysis. Med Care 2001, 39:1203-1216.
24. Hakim Z, Pathak DS: Modelling the EuroQol data: a compari-
son of discrete choice conjoint and conditional preference
modelling. Health Economics 1999, 8:103-116.
25. Lloyd AJ: The extent of patients' understanding of the risk of
treatments. Quality in Health Care 2001, 10(Suppl 1):i14-i18.
26. Feighner JP: Impact of anxiety therapy on patients' quality of
life. American Journal of Medicine 1987, 82:14-19.
27. Bowling A, Ebrahim S: Measuring patients' preferences for
treatment and perceptions of risk. Quality in Health Care 2001,
10(Suppl 1):i2-i8.
28. Dunbar-Jacob J, Erlen JA, Schlenk EA, Ryan CM, Sereika SM, Doswell
WM: Adherence in chronic disease. Annual Review of Nursing
Research 2000, 18:48-90.
29. Bukstein DA: Incorporating quality of life data into managed
care formulary decisions: a case study with salmeterol. Am J
Manag Care 1997, 3:1701-1706.
30. Fottler MD, Ford RC, Bach SA: Measuring patient satisfaction in
healthcare organizations: qualitative and quantitative
approaches. Best Pract Benchmarking Healthc 1997, 2:227-239.
31. Ross CK, Steward CA, Sinacore JM: The importance of patient
preferences in the measurement of health care satisfaction.
Med Care 1993, 31:1138-1149.
32. Aharony L, Strasser S: Patient satisfaction: what we know about
and what we still need to explore. Medical Care Review 1993,
50:49-79.
33. Strasser S, Aharony L, Greenberger D: The patient satisfaction
process: moving toward a comprehensive model. Medical Care
Review 1993, 50:219-248.
34. Bredart A, Razavi D, Delvaux N, Goodman V, Farvacques C, Van
Heer C: A comprehensive assessment of satisfaction with
care for cancer patients. Supportive Care in Cancer 1998,
6:518-523.
35. Bredart A, Razavi D, Robertson C, Didier F, Scaffidi E, Fonzo D,
Autier P, de Haes JC: Assessment of quality of care in an oncol-
ogy institute using information on patients' satisfaction.
Oncology 2001, 61:120-128.
36. Hudak PL, Wright JG: The characteristics of patient satisfaction
measures. Spine 2000, 25:3167-3177.
37. Lubeck DP, Litwin MS, Henning JM, Mathias SD, Bloor L, Carroll PR:
An instrument to measure patient satisfaction with health-
care in an observational database: results of a validation
study using data from CaPSURE. Am J Manag Care 2000, 6:70-76.
38. Westbrook JI: Patient satisfaction: methodological issues and
research findings. Australian Health Review 1993, 16:75-88.
39. Avis M, Bond M, Arthur A: Satisfying solutions? A review of
some unresolved issues in the measurement of patient
satisfaction. J Adv Nurs 1995, 22:316-322.
40. Bradley C: Diabetes treatment satisfaction questionnaire.
Change version for use alongside status version provides
appropriate solution where ceiling effects occur. Diabetes Care
1999, 22:530-532.
41. Carr-Hill RA: The measurement of patient satisfaction. Journal
of Public Health Medicine 1992, 14:236-249.
42. Lin B, Kelly E: Methodological issues in patient satisfaction sur-
veys. International Journal of Health Care Quality Assurance 1995,
8:32-37.
Publish with Bio Med Central and every
scientist can read your work free of charge
"BioMed Central will be the most significant development for
disseminating the results of biomedical research in our lifetime."
Sir Paul Nurse, Cancer Research UK
Your research papers will be:
available free of charge to the entire biomedical community
peer reviewed and published immediately upon acceptance
cited in PubMed and archived on PubMed Central
yours — you keep the copyright
Submit your manuscript here:
/>BioMedcentral
Health and Quality of Life Outcomes 2004, 2 />Page 13 of 13
(page number not for citation purposes)
43. Pouwer F, Snoek FJ, Heine RJ: Ceiling effect reduces the validity
of the Diabetes Treatment Satisfaction Questionnaire. Diabe-
tes Care 1998, 21:2039.
44. Petterson T, Lee P, Hollis S, Young B, Newton P, Dornan T: Well-
being and treatment satisfaction in older people with
diabetes. Diabetes Care 1998, 21:930-935.
45. Singh J, Wood VR, Goolsby J: Consumers' satisfaction with
health care delivery: issues of measurement, issues of
research design. Journal of Ambulatory Care Marketing 1990,
4:105-115.
46. Sitzia J, Wood N: Response rate in patient satisfaction
research: an analysis of 210 published studies. International Jour-
nal for Quality in Health Care 1998, 10:311-317.
47. Sitzia J: How valid and reliable are patient satisfaction data?
An analysis of 195 studies. International Journal for Quality in Health
Care 1999, 11:319-328.
48. Attkisson CC, Greenfield TK: The Consumer Satisfaction Ques-
tionnaire (CSQ) Scales and the Service Satisfaction Scale-30
(SSS-30). In Outcomes Assessment in Clinical Practice Edited by: Sederer
L, Dickey B. Baltimore: Williams & Wilkins; 1996:120-127.
49. Streiner DL, Norman GR: Health measurement scales: a practical guide
to their development and use 2nd edition. Oxford, England: Oxford Univer-
sity Press; 1995.
50. Williams SA, Swanson MS: The effect of reading ability and
response formats on patients' abilities to respond to a
patient satisfaction scale. Journal of Continuing Education in Nursing
2001, 32:60-67.
51. Ware JE Jr, Hays RD: Methods for measuring patient satisfac-
tion with specific medical encounters. Med Care 1988,
26:393-402.
52. Torrance GW, Feeny D, Furlong W: Visual analog scales: do they
have a role in the measurement of preferences for health
states? Medical Decision Making 2001, 21:329-334.
53. Hanita M: Self-report measures of patient utility: should we
trust them? J Clin Epidemiol 2000, 53:469-476.
54. Gill K: Social psychological artifacts in the measurement of
consumer satisfaction with health care. Dissertation Abstracts
International: Section B: The Sciences & Engineering 1996, 57(2-B):1495.
55. Chatterton ML, Scott-Lennox J, Wu AW, Scott J: Quality of life and
treatment satisfaction after the addition of lamivudine or
lamivudine plus loviride to zidovudine-containing regimens
in treatment-experienced patients with HIV infection. Phar-
macoEconomics 1999, 15 Suppl 1:67-74.
56. Cohen JA, Beall D, Beck A, Rawlings J, Miller DW, Clements B, Pait
DG, Batenhorst A: Sumatriptan treatment for migraine in a
health maintenance organization: economic, humanistic,
and clinical outcomes. Clinical Therapeutics 1999, 21:190-204.
57. Colman SS, Brod MI, Krishnamurthy A, Rowland CR, Jirgens KJ,
Gomez-Mancilla B: Treatment satisfaction, functional status,
and health-related quality of life of migraine patients treated
with almotriptan or sumatriptan. Clinical Therapeutics 2001,
23:127-145.
58. Lewis R, Bennett CJ, Borkon WD, Boykin WH, Althof SE, Stecher VJ,
Siegel RL: Patient and partner satisfaction with Viagra (silde-
nafil citrate) treatment as determined by the Erectile Dys-
function Inventory of Treatment Satisfaction Questionnaire.
Urology 2001, 57:960-965.
59. Mathias SD, Warren EH, Colwell HH, Sung JC: A new treatment
satisfaction measure for asthmatics: a validation study. Qual
Life Res 2000, 9:873-882.
60. Payne R, Mathias SD, Pasta DJ, Wanke LA, Williams R, Mahmoud R:
Quality of life and cancer pain: satisfaction and side effects
with transdermal fentanyl versus oral morphine. Journal of Clin-
ical Oncology 1998, 16:1588-1593.
61. Glasser BG, Strauss AL: The Discovery of Grounded Theory: Strategies for
Qualitative Research New York, Aldine de Gruyter; 1967.
62. Krueger HP, Patton MQ: Focus Groups. A practical guide for applied
research Newbury Park, Sage Publications; 1988.
63. Merton RK, Friske M, Kendall PL: The Focused Interview. A Manual of
Problems and Procedures 2nd edition. New York, The Free Press; 1990.
64. Grogan S, Conner M, Norman P, Willits D, Porter I: Validation of a
questionnaire measuring patient satisfaction with general
practitioner services. Quality in Health Care 2000, 9:210-215.
65. Gorsuch RL: Exploratory factor analysis: Its role in item
analysis. Journal of Personality Assessment 1997, 68:532-560.
66. Gorsuch RL: New procedures for extension analysis in explor-
atory factor analysis. Educational and Psychological Measurement
1997, 57:725-740.
67. Russell D: In search of underlying dimensions: The use (and
abuse) of factor analysis in Personality and Social Psychology
Bulletin. Personality and Social Psychology Bulletin 2002, 28:1629-1646.
68. Borner MM, Schoffski P, de Wit R, Caponigro F, Comella G, Sulkes A,
Greim G, Peters GJ, van der BK, Wanders J et al.: Patient prefer-
ence and pharmacokinetics of oral modulated UFT versus
intravenous fluorouracil and leucovorin: a randomised cross-
over trial in advanced colorectal cancer. European Journal of
Cancer 2002, 38:349-358.
69. Liu G, Franssen E, Fitch MI, Warner E: Patient preferences for
oral versus intravenous palliative chemotherapy. Journal of
Clinical Oncology 1997, 15:110-115.
70. Stier DM, Gause D, Joseph WS, Schein JR, Broering JM, Warolin KL,
Doyle JJ: Patient satisfaction with oral versus nonoral thera-
peutic approaches in onychomycosis. Journal of the American
Podiatric Medical Association 2001, 91:521-527.
71. Liem WH, McCullough JL, Weinstein GD: Effectiveness of topical
therapy for psoriasis: results of a national survey. Cutis 1995,
55:306-310.
72. Cronk BC, West JL: Personality research on the Internet: a
comparison of Web-based and traditional instruments in
take-home and in-class settings. Behavior Research Methods,
Instruments, & Computers 2002, 34:177-180.
73. Hatcher M: Internet usage and potential impact for acute care
hospitals: survey in the United States. Journal of Medical Systems
1998, 22:371-378.
74. Ness TJ, Jones L, Smith H: Use of compounded topical analge-
sics – results of an Internet survey. Regional Anesthesia & Pain
Medicine 2002, 27:309-312.
75. Rzymski P: A study of Internet use by doctors and patients in
Poland. Journal of Telemedicine & Telecare 2001, 7:344-347.
76. Duff S: Paying more for results. CMS tries to enlist Premier
to tie hospital reimbursement to quality performance. Mod-
ern Healthcare 2002, 32:9.
77. Clark PA: Medical practices' sensitivity to patients' needs.
Opportunities and practices for improvement. Journal of Ambu-
latory Care Management 2003, 26:110-123.