Health and Quality of Life Outcomes BioMed Central Research Open Access +Psychometric evaluation pptx
Bạn đang xem bản rút gọn của tài liệu. Xem và tải ngay bản đầy đủ của tài liệu tại đây (339.45 KB, 15 trang )
BioMed Central
Page 1 of 15
(page number not for citation purposes)
Health and Quality of Life Outcomes
Open Access
Research
+Psychometric evaluation of the MacDQoL individualised measure
of the impact of macular degeneration on quality of life
Jan Mitchell*
1
, James S Wolffsohn
2
, Alison Woodcock
1
, Stephen J Anderson
2
,
Carolyn V McMillan
1
, Timothy ffytche
3
, Martin Rubinstein
4
,
Winfried Amoaku
4
and Clare Bradley
1
Address:
1
Department of Psychology, Royal Holloway, University of London, Egham, Surrey, TW20 0EX, UK,
2
Neurosciences Research Institute,
Aston University, Birmingham, B4 7ET, UK,
3
Hospital for Tropical Diseases, Capper Street, London WC1E 6AU, UK and
4
Eye Department, Queen's
Medical Centre, Derby Road, Nottingham, NG7 2UH, UK
Email: Jan Mitchell* - ; James S Wolffsohn - ; Alison Woodcock - ;
Stephen J Anderson - ; Carolyn V McMillan - ;
Timothy ffytche - ; Martin Rubinstein - ;
Winfried Amoaku - ; Clare Bradley -
* Corresponding author
Abstract
Background: The MacDQoL is an individualised measure of the impact of macular degeneration (MD) on quality of life
(QoL). There is preliminary evidence of its psychometric properties and sensitivity to severity of MD. The aim of this
study was to carry out further psychometric evaluation with a larger sample and investigate the measure's sensitivity to
MD severity.
Methods: Patients with MD (n = 156: 99 women, 57 men, mean age 79 ± 13 years), recruited from eye clinics (one
NHS, one private) completed the MacDQoL by telephone interview and later underwent a clinic vision assessment
including near and distance visual acuity (VA), comfortable near VA, contrast sensitivity, colour recognition, recovery
from glare and presence or absence of distortion or scotoma in the central 10° of the visual field.
Results: The completion rate for the MacDQoL items was 99.8%. Of the 26 items, three were dropped from the
measure due to redundancy. A fourth was retained in the questionnaire but excluded when computing the scale score.
Principal components analysis and Cronbach's alpha (0.944) supported combining the remaining 22 items in a single scale.
Lower MacDQoL scores, indicating more negative impact of MD on QoL, were associated with poorer distance VA
(better eye r = -0.431 p < 0.001; worse eye r = -0.350 p < 0.001; binocular vision r = -0.419 p < 0.001) and near VA
(better eye r = -0.326 p < 0.001; worse eye r = -0.226 p < 0.001; binocular vision r = -0.326 p < 0.001). Poorer MacDQoL
scores were associated with poorer contrast sensitivity (better eye r = 0.392 p < 0.001; binocular vision r = 0.423 p <
0.001), poorer colour recognition (r = 0.417 p < 0.001) and poorer comfortable near VA (r = -0.283, p < 0.001). The
MacDQoL differentiated between those with and without binocular scotoma (U = 1244 p < 0.001).
Conclusion: The MacDQoL 22-item scale has excellent internal consistency reliability and a single-factor structure. The
measure is acceptable to respondents and the generic QoL item, MD-specific QoL item and average weighted impact
score are related to several measures of vision. The MacDQoL demonstrates that MD has considerable negative impact
on many aspects of QoL, particularly independence, leisure activities, dealing with personal affairs and mobility. The
measure may be valuable for use in clinical trials and routine clinical care.
Published: 14 April 2005
Health and Quality of Life Outcomes 2005, 3:25 doi:10.1186/1477-7525-3-25
Received: 06 October 2004
Accepted: 14 April 2005
This article is available from: />© 2005 Mitchell et al; licensee BioMed Central Ltd.
This is an Open Access article distributed under the terms of the Creative Commons Attribution License ( />),
which permits unrestricted use, distribution, and reproduction in any medium, provided the original work is properly cited.
Health and Quality of Life Outcomes 2005, 3:25 />Page 2 of 15
(page number not for citation purposes)
Background
Macular degeneration (MD) is a chronic, progressive eye
condition that mainly affects people over the age of 50
years. It is the leading cause of blindness among those of
European descent over the age of 60 years [1]. Recently it
was estimated that, in the UK, between 182,000 and
300,000 people are blind or partially sighted because of
MD [2]. For the majority there is no treatment and, where
treatment is available, it does not cure the condition but
instead slows or halts its progress for an indeterminate
period [3]. People with MD lose their central vision and
this precludes daily activities requiring fine vision such as
reading, driving, watching TV and recognising faces.
Peripheral vision is usually retained. MD can impair effi-
ciency in performing most daily activities and may com-
promise the ability to live an independent life. The
psychological impact of the condition can be devastating
[4,5]. An ageing population means that the prevalence of
MD is likely to increase [3].
New treatments for MD are being developed, as are reha-
bilitation programmes. Quality of life (QoL) is increas-
ingly required as an outcome measure in clinical trials and
an appropriate instrument is necessary. There has been lit-
tle consensus about the definition and measurement of
QoL in ophthalmology, just as in other areas of medicine
[6]. Measures of health status, functional status and psy-
chological well-being have all been used and described as
QoL measures, but the interpretation of data used in this
way can be misleading [7]. Some researchers into the
impact of vision impairment on QoL have used health sta-
tus measures such as the SF-36 [8] or the Sickness Impact
Profile [9], but these have not proved informative [10,11],
as many of the aspects of 'health' investigated in generic
measures are unlikely to be affected by MD. Others have
measured functional status (e.g. activities of daily living)
[12], referring to it as QoL. Measures of health status and
functional status do not correlate well with visual acuity
(VA). Self-reported visual function, investigated using
measures such as the NEI-VFQ [13] or the Activities of
Daily Vision Scale [14] is moderately associated with VA.
While such instruments can provide valuable information
about functional impairment caused by vision loss, they
do not measure the impact on QoL. One useful way of
measuring the impact of an eye condition on QoL is to
consider the importance to individuals of the aspects of
life investigated in the questionnaire as well perceptions
of the impact of their eye condition on each aspect. The
principle of including participants' ratings of the impor-
tance of domains to their QoL (by ranking the domains)
has been adopted in some generic QoL measures includ-
ing the SEIQoL [15] and the Patient Generated Index [16].
The MacDQoL is an individualised measure of the impact
of MD on QoL, based on the design of the Audit of Diabe-
tes Dependent Quality of Life (ADDQoL) [17], which is
increasingly used [18-20]. The questionnaire begins with
two overview items, measuring: a) present QoL. (In gen-
eral, my present quality of life is:), scored from +3 (excellent),
through 0 (neither good nor bad) to -3 (extremely bad), b)
MD-specific QoL (If I did not have MD, my quality of life
would be:), scored from -3 (very much better) through 0 (the
same) to +1 (worse). The 26 domain-specific items in the
MacDQoL were developed from focus group meetings
with people who have MD and with reference to the liter-
ature and to psychologists experienced in this field (Table
2) [21]. Each has questions asking about both the impact
of MD on that aspect of life and the importance of the
aspect of life to QoL. The paper version is designed for
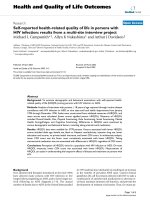
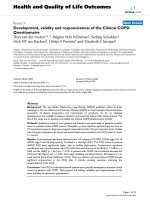
completion by visually impaired people. Figures 1 and 2
show the presentation in the questionnaire of the two
overview items and one domain-specific item, with the
scores for each response option shown. For the domain-
specific items, impact scores (from -3 to +1) are multi-
plied by importance scores (from 0 to 3) to give a
weighted impact score for each domain of between -9 and
+3. The use of impact and importance scores enables an
estimation of the impact of MD on an individual's QoL,
not merely on function. For example, MD may adversely
affect the time it takes an individual to do things, but if
time taken is not important to his/her quality of life there
will be no negative impact on QoL. Conversely, a small
impact on a domain such as family life may lead to a con-
siderable diminution of QoL if family life is very impor-
tant to a person. Some domains have a 'not applicable'
option (indicated by *, Table 2). A final item asks the
respondent whether MD affects his/her life in any ways
not already covered by the questionnaire, with a space to
write a response for people who reply 'yes'. The measure
has face and content validity and preliminary evidence of
internal consistency reliability and sensitivity to differ-
ences in vision status (registered as blind, partially-sighted
or not registered) has been reported previously [21].
Other work has shown preliminary evidence of reproduc-
ibility using self-completion in a sample of 61 people
with MD [22]. The correlation between scores at time one
and time 2 (mean interval 39 days) was 0.9 and there was
no difference between AWI scores at times one and two (t
= 1.2, p > 0.05).
The research reported here formed the first part of a longi-
tudinal study to carry out further evaluation of the
MacDQoL.
Previous research has indicated that completion of vision-
related questionnaires by pen and paper (self-comple-
tion) and by interview may not yield equivalent results
[23]. This is also the case for the MacDQoL [22]. We antic-
ipated that a substantial proportion of participants in this
study would be unable to self-complete the MacDQoL
Health and Quality of Life Outcomes 2005, 3:25 />Page 3 of 15
(page number not for citation purposes)
because of their visual impairment and it was decided to
complete the measure by telephone interview for all
participants.
Methods
Participants
Potential participants were identified from the clinic lists
(NHS and private) of a consultant ophthalmologist (WA).
Patients were considered suitable if they had age-related
MD, treated or untreated, in one or both eyes. They were
excluded for any of the following:
• cataracts that were considered sufficiently severe to
impair vision
• glaucoma
• diabetic retinopathy sufficiently severe to impair vision
• degenerative myopia
• any macular condition other than age-related MD
• one non-functioning eye for reasons other than age-
related MD
• unable to understand and speak English
Procedure
Patients who met the inclusion criteria were contacted,
initially by telephone, by an ophthalmic nurse known to
all the patients. She told patients about the research, read-
ing from a prepared script, and invited them to partici-
pate. Those willing to take part were given an
appointment for a vision assessment at the hospital. Writ-
ten information was despatched within three days of the
telephone conversation. A member of the research team
(JM) telephoned soon after and agreed the time of a tele-
phone interview, which was carried out by a psychologist
(CM or JM) not more than 14 days prior to the vision
assessment appointment. During the interviews partici-
pants completed:
• MacDQoL
• demographic items
• other vision-related questions followed the MacDQoL
and the demographic items. These will be reported fully
elsewhere.
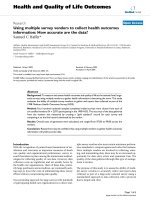
MacDQoL present QoL and MD-specific overview items with scores shownFigure 1
MacDQoL present QoL and MD-specific overview items
with scores shown.
In
g
eneral, m
yp
resent
q
ualit
y
of life is:
•
exc e lle n t
3
•
very good………………………
2
•
good……………………………
1
•
neither good nor bad… … … …
0
•
bad……………………………….
-1
•
very bad……… …… ………… …
-2
•
extrem ely b a d……………… ….
-3
IfIdidnothaveMD,m
yq
ualit
y
of life would be :
•
ver y muc h be tter
-3
•
m u c h be tter ……………………
-2
•
a little bet t e r ……………………
-1
•
the same ………………………
0
•
worse…………………………….
1
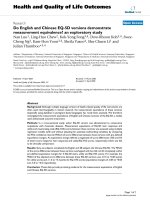
MacDQoL domain-specific item with scores shownFigure 2
MacDQoL domain-specific item with scores shown.
If I did not have MD, my friendships and social life would be:
•
very much better
-3
•
much better……………………
-2
•
a little better…………………
-1
•
the same………………………
0
•
worse…………………………
1
My friendships and social life are:
•
very important………… ………
3
•
important………………………
2
•
somewhat impor tant…………
1
•
not at all important……………
0
Health and Quality of Life Outcomes 2005, 3:25 />Page 4 of 15
(page number not for citation purposes)
Interviewers were not informed of the clinical characteris-
tics of the individual participants
Responses to questions were entered into a computerised
on-screen questionnaire using SPSS Data Entry Builder
[24]. The data were automatically stored as an SPSS data
file.
Vision assessments, carried out by optometrists (SA, JW,
MR) included:
• distance visual acuity, using Bailey-Lovie logMAR charts
with Early Treatment for Diabetic Retinopathy Study
(ETRDS) protocol [25] for monocular and binocular
vision
• near visual acuity (MNREAD charts with ETDRS proto-
col) for monocular and binocular vision [26]
• comfortable visual acuity for monocular and binocular
vision. This was computed from time taken to read script
of different sizes of print (MNREAD charts with ETDRS
protocol). The time taken to read each line was recorded.
When the time to read a line increased substantially, this
showed that it was no longer 'comfortable' to read that
size print and smaller prints [26].
• contrast sensitivity, using Pelli-Robson charts [27] for
monocular and binocular vision
• presence of distortion or a scotoma in central 10 degrees
of vision (Amsler grid with concentric circles) for monoc-
ular and binocular vision. Patients fixated the central spot
and identified the presence of distorted or missing grid
lines in their peripheral field [28].
• colour vision (PV-16 colour vision test for visually
impaired people) for binocular vision only. This consisted
of a number of coloured blocks that the participant was
asked to arrange in the order of the spectrum and is an
enlarged version of the D-15 colour vision test [29].
• recovery from glare (Eger stressometer glare test) for bin-
ocular vision only. This test recorded the number of sec-
onds taken to be able to read the smallest readable print
again, after a brief flash of light [30].
The optometrists who carried out the vision assessments
were not provided with participants' questionnaire
responses.
These data were entered manually into Excel and trans-
ferred to SPSS.
Ethical approval was obtained from the Nottingham
Research Ethics Committee.
Statistical methods
SPSS 9.0 [31] was used. The range of responses was exam-
ined to ascertain the need for the full range of response
options and the 'not applicable' options. The effect of
incorporating impact and importance ratings on the rank
order of domains was investigated.
Fourteen of the 26 MacDQoL domain-specific items had
a non-normal distribution. Since reliability and factor
analyses are parametric procedures, measures were taken
to normalise the data using transformations. Principal
components analyses were carried out on both raw and
transformed data.
Factor structure
Principal components analysis was carried out to identify
possible subscales within the MacDQoL. To allow for data
from the maximum number of participants to be used in
the psychometric analyses, principal components analysis
and internal consistency reliability analyses were con-
ducted twice: first with missing data due to items being
not applicable recoded as zero and participants with miss-
ing data being deleted listwise; secondly with 'not applica-
ble' responses treated as missing data and pairwise
deletion being used to minimise loss of data.
Internal consistency reliability
Cronbach's alpha coefficient of internal consistency relia-
bility of was calculated. The higher the alpha, the stronger
the internal consistency reliability, indicating that all
items are measuring aspects of the same underlying con-
struct. Corrected item-total correlations were carried out
to investigate the strength of individual items' associa-
tions with the construct.
Redundancy
Redundancy of items was investigated by examining cor-
relations between items. The distributions of the scores of
the items were examined and Wilcoxon signed rank tests
were carried out to compare scores of items of similar con-
tent. Principal components analysis and Cronbach's
alpha were repeated after removal of redundant items.
Construct validity
Construct validity is established by examining predicted
relationships between the questionnaire scores and other
clinical or psychological variables. Spearman's correla-
tions and Mann Whitney tests were used to investigate the
relationship between the MacDQoL overview items and
the average weighted impact score (AWI) with twelve
measures of vision (see Table 6).
Health and Quality of Life Outcomes 2005, 3:25 />Page 5 of 15
(page number not for citation purposes)
It was hypothesised that the MD-Specific QoL overview
item and the AWI would be correlated with better eye and
binocular distance visual acuity (VA), better eye and bin-
ocular near VA, better eye and binocular contrast sensitiv-
ity, binocular colour recognition, binocular comfortable
reading speed and binocular presence or absence of
scotoma and distortion, with greater visual impairment
being associated with greater impact of MD on QoL. Since
it does not focus specifically on the impact of MD on QoL,
it was also hypothesised that the present QoL overview
item would be correlated with these variables, but less
strongly than the MD-Specific QoL overview item and the
AWI.
Results
Participants
Of the 223 people telephoned by the research nurse, 38
people (17%) declined to take part (mean age of those
who declined = 79.8 ± 13 years, 47% women, 53% men).
Reasons for non-participation included being too ill, hav-
ing too far to travel to the hospital or being unable to
make suitable travel arrangements, having no one to
accompany them to the vision assessment, being unavail-
able on the vision assessment dates and not being inter-
ested in taking part in the research. Twenty-nine people
(69% women, 31% men, mean age 82.6 years) who
agreed initially to take part subsequently changed their
minds, or did not attend the vision assessments for other
reasons. Of these, five completed the telephone interview
before deciding not to participate further.
The mean age of the 156 participants was 78.96 years (s.d.
6.64, median 79.76, range 52.47 to 91.61). The mean age
at leaving full time education was 15.28 years (s.d. 2.21,
median 14 years, minimum 12 years, maximum 27
years). Other demographic data are reported in Table 1.
Clinical data are reported in Table 1. Only six (3.8%) peo-
ple had just one eye affected by MD. Ninety people
(57.7%) had wet MD in both eyes.
The MacDQoL: range of responses
The completion rate for the MacDQoL items was 99.8%
The full range of scoring options for impact of MD (-3 to
+1) was used in four domains (Table 2). All scoring
options except +1 (indicating a positive impact of MD on
QoL) were used in all other domains except work, where
only -2 and -3 were used. The most negatively impacted
domain in the MacDQoL was work (-2.33), although this
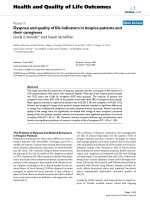
Mean weighted impact scores of MacDQoL domainsFigure 3
Mean weighted impact scores of MacDQoL domains.
-9
-8
-7
-6
-5
-4
-3
-2
-1
0
i
n
d
e
p
e
n
d
e
n
c
e
l
e
i
s
u
r
e
w
o
r
k
h
o
b
b
i
e
s
p
e
r
s
o
n
a
l
a
f
f
a
i
r
s
g
e
t
o
u
t
a
n
d
a
b
o
u
t
d
o
f
o
r
o
t
h
e
r
s
d
o
p
h
y
s
i
c
a
l
l
y
s
h
o
p
p
i
n
g
n
a
t
u
r
e
s
e
l
f
-
c
o
n
f
i
d
e
n
c
e
h
o
u
s
e
h
o
l
d
t
a
s
k
s
f
u
t
u
r
e
h
o
l
i
d
a
y
s
m
i
s
h
a
p
s
f
a
m
i
l
y
l
i
fe
l
o
n
g
j
o
u
r
n
e
y
s
f
r
i
e
n
d
s
a
n
d
s
o
c
i
a
l
t
i
m
e
t
a
k
e
n
m
o
t
i
v
a
t
i
o
n
e
n
j
o
y
m
e
a
l
s
p
h
y
s
i
c
a
l
a
p
p
e
a
r
a
n
c
e
p
e
r
s
o
n
a
l
r
e
l
a
t
i
o
n
s
h
i
p
p
e
o
p
l
e
'
s
r
e
a
c
t
i
o
n
s
o
c
i
e
t
y
'
s
r
e
a
c
t
i
o
n
f
i
n
a
n
c
e
s
MacDQoL domains
weighted impact score
Health and Quality of Life Outcomes 2005, 3:25 />Page 6 of 15
(page number not for citation purposes)
domain was applicable to only three respondents (Table
3). Among the least impacted domains were finances (-
0.45) and people's reaction (-0.73) (Table 3).
The full range of importance ratings (0 – 3) was used in 24
of the 26 domains (Table 2). Mean importance ratings
ranged from 2.69 (personal relationship) to 1.59 (time
taken) (Table 3). The rank order of domains in order of
impact score changed when impact scores were multiplied
by importance to give weighted impact scores, with only
three domains remaining in the same position after
weighting by importance (Table 3). Positions in the rank
order of mean values changed by between zero and five
places. Changes for individual respondents were even
more substantial. Figure 3 shows the weighted impact
scores of each domain. The greatest negative impact was
reported for independence (-5.29) followed by leisure and
work. The least impacted domain was finances (-1.02).
Five items had not applicable (N/A) options (Table 2).
The greatest use of the N/A option was for work (n = 153,
98%), followed by personal relationship (n = 75, 48%).
Only seven (4.5%) people reported that family life was N/
A.
Transforming the data
Data for some MacDQoL domains were not normally dis-
tributed. Average weighted impact scores were trans-
formed using first log and then reflect and log
transformations. It was not possible to achieve normality
for all domains using either transformation, though the
size of the sample will protect against the problems of
non-normality. Principal components analyses using
transformed data produced results that were very similar
to those using untransformed data. The results reported
here were obtained using untransformed data.
Structure of 26-item MacDQoL
(a) Not applicable items scored as zero
Principal components analysis with varimax rotation pro-
duced five components with Eigenvalues greater than 1.
Eleven items loaded >0.4 on the first factor, including
items relating to activities, such as household tasks, personal
affairs, getting out and about, hobbies and do things for others.
Eight items loaded on the second factor, including several
relating to self-consciousness, such as appearance, people's
reaction and mishaps. Finances loaded on factors 2 and 5
and leisure and hobbies loaded on both factors 1 and 3. In
a forced single-factor analysis, all items loaded > 0.4
except work and finances.
(b) Not applicable items scored as missing, using pairwise deletion
Work was removed from the analysis because it was appli-
cable for only three people. Principal components analy-
sis with varimax rotation seeking Eigenvalues >1 revealed
a 4-factor structure. Seven items double-loaded and the
Table 1: Patient characteristics: Sex, marital status, number of eyes affected by MD, type of MD, whether both eyes diagnosed at same
time, registration status.
Demographic and clinical data N (valid %)
Sex women 99 (63.5)
men 57 (36.5)
Marital status married or living with partner 74 (47.4)
widowed 68 (43.6)
divorced or separated 8 (5.1)
single 6 (3.6)
Number of eyes affected by MD one 6 (3.8)
two 150 (96.2)
Type of MD wet only 90 (57.7)
dry only 19 (12.2)
wet and dry 42 (26.9)
wet and type MD in 2
nd
eye not specified 4 (2.6)
type of MD not specified 1 (0.6)
Both eyes diagnosed at same time yes 46 (32.6)
no 95 (67.4)
missing 15
Registration status blind 8 (5.4)
partially sighted 67 (45.6)
not registered 72 (46.2)
missing 9
Health and Quality of Life Outcomes 2005, 3:25 />Page 7 of 15
(page number not for citation purposes)
factor structure and the factors were not conceptually dis-
tinct. A forced single-factor analysis showed loadings very
similar to the one with N/A scored as 0 except that personal
relationship loaded 0.662 with N/A scored missing com-
pared with 0.419 with N/A scored as zero. Finances still
loaded < 0.4.
(c) Removal of items
A priority was to shorten the questionnaire to reduce the
demand on respondents. Three pairs of items were inves-
tigated to establish whether there was any redundancy:
People's reaction and society's reaction; leisure and hobbies;
holidays and long journeys.
The items society's reaction and people's reaction were origi-
nally both included to establish which one was easier to
understand. The telephone interviewers found that partic-
ipants hesitated less over people's reaction and sometimes
had difficulty differentiating between the two items. The
item scores were highly correlated with each other (r =
0.692, p <0.001), more so than with any other items. The
distributions of impact and importance scores were
similar for the two items. To control for familywise error,
a Bonferroni correction was applied (p < 0.016 accepted).
There was no difference in weighted impact scores
between the two items (median people's reaction = 0 [range
0 to -9]; median society's reaction = 0 [range 0 to -9], p >
0.05). People's reaction is easier to translate into other lan-
guages and this is an important consideration if the meas-
ure is to be used in international trials. Finally, evidence
from semi-structured interviews in the UK and Germany
during the development of a similar measure for use in
diabetic retinopathy (RetDQoL) [32] supported the inclu-
sion of people's reaction rather than society's reaction on
grounds of ease of comprehension. So ciety's reaction was
therefore dropped and people's reaction retained.
The items leisure activities and hobbies and interests were
highly correlated with each other (r = 0.711, p < 0.001).
Distribution of scores was similar for the two items. A Wil-
coxon signed ranks test showed no significant difference
after applying the Bonferroni correction (median leisure
activities = -6 [range 0 to -9], median hobbies and interests =
-6 [range 0 to -9]; Z = -2.33, p = 0.02; p < 0.016 accepted).
Table 2: Frequencies of impact and importance scores for domains of the MacDQoL
Item Impact score frequencies Importance score frequencies
-3 -2 -1 0 1 3 2 1 0
household tasks 46 56 26 28 0 55 76 20 5
personal affairs 65 41 22 28 0 75 57 17 6
shopping 67 43 24 22 0 47 76 23 10
*work 1 2 0 00 1110
*personal relationship 10 12 12 47 0 58 19 3 0
*family life 27 35 24 60 3 108 36 4 1
friends and social 33 43 26 54 0 63 71 14 8
physical appearance 22 22 41 71 0 67 57 26 6
do physically 44 50 37 25 0 80 62 12 2
get out and about 62 34 30 30 0 92 50 12 2
*long journeys 28 37 13 24 1 27 41 26 10
*holidays 38 33 23 27 0 38 48 27 8
leisure activities 97 37 16 13 0 64 65 21 6
hobbies684619 220 6364236
self-confidence 41 55 29 31 0 80 58 12 6
motivation 31 48 31 45 1 51 64 33 8
people's reaction 12 25 27 91 0 48 66 27 14
society's reaction 14 25 26 88 0 28 61 43 22
future 43 56 27 30 0 52 60 33 11
financial situation 11 13 12 119 1 38 79 30 9
independence 71 37 27 21 0 97 45 10 4
do for others 56 46 23 31 0 66 65 21 4
mishaps 40 34 43 39 0 69 60 21 6
enjoy meals 31 33 26 66 0 49 72 26 9
time taken 41 49 32 33 0 30 56 45 24
enjoy nature 48 47 23 38 0 56 62 26 12
* indicates a 'not applicable option
Health and Quality of Life Outcomes 2005, 3:25 />Page 8 of 15
(page number not for citation purposes)
The telephone interviewers noted that people often talked
about hobbies and other interests such as embroidery and
playing musical instruments when considering the leisure
item. The understanding of these two items appeared to
overlap and retaining both may lead to artificial inflation
of the AWI. Therefore only one item was retained and
reworded to specify leisure activities as well as hobbies.
For the purposes of analysing the present data the mean of
the two weighted impact scores was calculated for each
participant (hobbies and leisure = [hobbies
wi
+ leisure
wi
]/
2).
The items long journeys and holidays were highly correlated
with each other (r = 0.692, p <0.001). The patterns of
distribution of the scores were similar for both items.
There was no difference in weighted impact scores for the
two items (median long journeys = -3 [range 3 to- -9],
median holidays = -3 [range 0 to -9]; Z = -1.82, p > 0.05).
Fewer scores were lost to the N/A option with holidays
than with long journeys. During telephone interviews, the
earlier item, long journeys, elicited comments about holi-
days, and respondents often considered the two activities
to be part of the same event, since most people were
retired and so work-related travel was not a consideration.
To keep both items may lead to artificial inflation of the
AWI, so holidays was retained and long journeys removed.
(d) Structure of the 23-item MacDQoL
Further principal components analyses were carried out
following the removal of the three items. An unforced
analysis with varimax rotation yielded four factors. The
first factor still contained predominantly activity items
together with confidence. The remaining three factors
could not be labelled coherently. Appearance did not load
on to any factor >0.4. In a forced single-factor analysis, all
items except work and finances loaded > 0.42.
Work was removed and the analyses re-run, with N/A
items scored as zero. Again, principal components analy-
sis yielded four factors (Table 4). Six items double-loaded
and one of the factors was not conceptually distinct. In a
forced one-factor analysis of the 22 items, all items loaded
>0.42, except finances, although the loading of this now
approached 0.4 (0.356)(Table 4). The item work was
applicable to only three people, but those for whom it was
applicable reported a high negative impact. It was decided
Table 3: MacDQoL domain-specific items in descending order of impact; mean impact scores, mean importance scores and positions
of domains in rank order of weighted impact
Domains in descending order
of impact score (n)
Mean impact score (s.d.) Mean importance rating (s.d.) Rank order of weighted
impact
1 work (3) -2.33 (1.08) 2 (1) 3
2 leisure activities (155) -2.31 (0.96) 2.2 (0.81) 2
3 hobbies (156) -2.03 (1.07) 2.18 (0.82) 4
4 independence (156) -2.01 (1.08) 2.51 (0.73) 1
5 shopping (156) -1.99 (1.07) 2.03 (0.84) 9
6 personal affairs (156) -1.92 (1.13) 2.3 (0.82) 5
7 get out and about (156) -1.82 (1.16) 2.49 (0.7) 6
8 do for others (156) -1.81 (1.13) 2.24 (0.78) 7
9 household tasks (156) -1.77 (1.06) 2.16 (0.77) 12
10 do physically (156) -1.72 (1.04) 2.41 (0.69) 8
11 future (156) -1.72 (1.07) 1.98 (0.91) 13
12 self-confidence (156) -1.68 (1.07) 2.36 (0.79) 11
13 holidays (121) -1.68 (1.14) 1.96 (0.9) 14
14 nature (156) -1.67 (1.15) 2.04 (0.91) 10
15 long journeys (103) -1.65 (1.14) 1.82 (0.93) 17
16 time taken (156) -1.63 (1.09) 1.59 (0.97) 19
17 mishaps (156) -1.48 (1.13) 2.23 (0.83) 15
18 motivation (156) -1.40 (1.12) 2.01 (0.86) 20
19 friends and social (156) -1.35 (1.16) 2.21 (0.81) 18
20 enjoy meals (156) -1.19 (1.18) 2.03 (0.85) 21
21 family life (149) -1.15 (1.2) 2.68 (0.56) 16
22 physical appearance (156) -1.14 (1.08) 2.19 (0.85) 22
23 personal relationship (81) -0.81 (1.10) 2.69 (0.54) 23
24 society's reaction (153) -0.77 (1.03) 1.62 (0.94) 25
25 people's reaction (155) -0.73 (1.00) 1.95 (0.92) 24
26 financial situation (156) -0.45 (0.92) 1.94 (0.82) 26
Health and Quality of Life Outcomes 2005, 3:25 />Page 9 of 15
(page number not for citation purposes)
that work should remain in the questionnaire, but be
scored as a separate item. The weighted impact score of
finances was the lowest of all remaining 22 items, at -1.02.
However, some negative impact of MD on finances was
reported by 35 (23%) of participants and only nine
(5.8%) people thought it was not at all important. It was
decided to retain finances, not only because of the rele-
vance to a minority in the present UK sample but also
because this aspect of life is likely to be more impacted in
people from countries where there is greater financial
hardship for people with vision loss due to MD.
Reliability of the 22-item MacDQoL AWI scale score
Internal consistency reliability of the shortened, 22-item
scale was investigated, first with N/A items scored as zero
(N = 151). Cronbach's alpha coefficient of internal con-
sistency reliability was 0.944. When the analysis was
repeated with N/A items scored as missing (N = 62), alpha
was 0.946. In both cases only finances detracted from the
reliability, reducing it negligibly, by 0.012 in each case.
The pattern of results was similar for both methods of
dealing with N/A items. Table 5 shows the reliability anal-
ysis with N/A scored as zero.
Missing data
The AWI score can be computed despite some missing
data. Missing data for up to half the items can be tolerated
without Cronbach's alpha falling below 0.8. The AWI
score can be calculated from the items for which
responses have been given providing at least 11 items
have complete responses.
Correlation between MacDQoL AWI and overview items
Mean scores of the MacDQoL overview items and AWI
scores are shown in Table 6. Spearman's r correlations
indicated that the AWI score was, as expected, more highly
correlated with the MD-specific QoL overview item (r =
0.58, N = 156, p < 0.001) than with the present QoL item
(r = 0.47, N = 156, p < 0.001).
Construct validity
Construct validity of the MacDQoL was investigated by
examining relationships between the two overview items
and AWI scores and the twelve measures of vision taken at
the visual assessments. Since the MD-specific overview
item and several of the vision measures yielded non-nor-
mal data, non-parametric tests were used.
Table 4: Unforced principal components analysis with varimax rotation after removal of items and forced one-factor analysis with N/A
items scored as zero (items loading at > 0.4 in bold).
Item Rotated Component Matrix
Four factor solution
(variance explained = 64.3%)
Single factor solution
(variance explained = 49%)
Factor 1 Factor 2 Factor 3 Factor 4 Factor 1
household tasks 0.734 0.098 0.136 0.312 0.6869
personal affairs 0.754 0.254 0.146 0.099 0.7264
shopping 0.747 0.042 0.317 0.219 0.7145
personal relationship 0.210 -0.062 0.132 0.778 0.4219
family 0.179 0.411 0.199 0.629 0.6127
friends and social 0.252 0.604 0.095 0.541 0.6961
appearance 0.342 0.210 0.443 0.181 0.5821
do physically 0.587 0.473 0.269 0.023 0.7659
get out and about 0.699 0.324 0.252 0.125 0.7809
holidays 0.199 0.793 0.188 0.050 0.6582
hobbies/leisure 0.589 0.549 0.081 0.091 0.7484
self-confidence 0.495 0.282 0.259 0.266 0.6691
motivation 0.387 0.444 0.310 0.291 0.7150
peoples reaction 0.265 0.259 0.702 -0.071 0.5935
future 0.189 0.284 0.533 0.162 0.5541
finances 0.048 -0.070 0.747 0.148 0.3558
independence 0.716 0.444 0.173 0.158 0.8345
do for others 0.679 0.322 0.227 0.099 0.7491
mishaps 0.387 0.651 0.419 0.176 0.7906
enjoy meals 0.375 0.349 0.538 0.160 0.7141
time taken 0.321 0.460 0.466 0.204 0.7208
nature 0.305 0.752 0.150 0.127 0.7122
Health and Quality of Life Outcomes 2005, 3:25 />Page 10 of 15
(page number not for citation purposes)
Table 5: Reliability of the 22-item MacDQoL scale, with N/A items scored as zero (Cronbach's alpha = 0.9440)
MacDQoL
item
Scale mean if
item deleted
Scale variance if
item deleted
Corrected
item-total
correlation
Alpha if
item deleted
household tasks -71.92 1890.0 0.65 0.9414
personal affairs -71.19 1855.3 0.68 0.9408
shopping -71.53 1876.8 0.68 0.9410
personal relationship -74.74 1967.5 0.39 0.9446
family -72.93 1879.3 0.58 0.9426
friends and social -72.80 1875.0 0.66 0.9412
appearance -73.65 1915.5 0.54 0.9428
do physically -71.57 1858.6 0.72 0.9402
get out and about -71.32 1838.4 0.74 0.9399
holidays -73.16 1882.9 0.61 0.9419
hobbies/leisure -70.87 1874.7 0.71 0.9405
confidence -71.66 1879.3 0.63 0.9417
motivation -72.83 1876.9 0.68 0.9409
people's reaction -74.16 1918.8 0.55 0.9427
future -72.03 1909.2 0.52 0.9433
financial situation -74.89 1987.8 0.33 0.9452
independence -70.57 1822.7 0.80 0.9390
do for others -71.45 1847.3 0.71 0.9404
mishaps -72.31 1839.5 0.76 0.9397
meals -73.30 1882.1 0.68 0.9410
time -72.88 1870.7 0.69 0.9408
nature -72.08 1866.9 0.67 0.9410
Table 6: Mean scores for MacDQoL variables and vision measures. For distance VA and near VA, larger numbers indicate poorer
vision. For contrast sensitivity, larger numbers indicate greater sensitivity. Larger numbers indicate poorer colour recognition and
comfortable VA. For the glare test, larger numbers indicate a longer recovery time.
Variable Mean s.d. Median
MacDQoL present QoL
overview
0.90 1.13 1
MacDQoL MD-specific
overview
-2.13 0.89 -2
MacDQoL AWI -3.57 2.14 -3.7
Distance VA (logMAR) better eye 0.42 0.46 0.39
worse eye 1.23 0.95 0.95
binocular 0.39 0.46 0.37
Near VA better eye 0.45 0.43 0.3
worse eye 1.09 0.58 1.1
binocular 0.42 0.41 0.30
Contrast sensitivity better eye 1.01 0.77 1.05
worse eye 0.43 0.49 0.15
binocular 1.01 0.44 1.05
Comfortable VA 0.50 0.35 0.4
Colour recognition
(errors)
21.60 7.74 21.9
Glare test recovery
(seconds)
11.02 8.94 8.5
Health and Quality of Life Outcomes 2005, 3:25 />Page 11 of 15
(page number not for citation purposes)
Mean scores of the vision measures for better and worse
eye and binocular vision are shown in Table 6. Spear-
man's correlations were used to investigate relationships
between these and the three MacDQoL variables (Table
7). To control for the possibility of familywise error with
36 correlations, a Bonferroni correction was applied (p <
0.00138 accepted). Twenty-nine of the 36 correlations
indicated associations of poorer QoL with worse vision,
with p-values of <0.05. Twenty of these associations were
still significant after correcting for familywise error (p <
0.00138). As expected, in most cases, the AWI score corre-
lated with vision measures more strongly than did the two
overview items. For near VA, distance VA and contrast sen-
sitivity, the strongest correlations were with better-eye
scores as predicted. Binocular measures showed similar
relationships and worse eye measures showed poorer and
less consistent associations with the MacDQoL variables
Table (7). Comfortable VA and colour recognition were
not associated with present QoL and comfortable VA was
not associated with the MD-specific QoL overview item.
None of the three MacDQoL variables was associated with
recovery from glare Table (7), neither were relevant indi-
vidual items, such as holidays or get out and about.
Frequencies of reported scotomas and distortion are given
in Table 8. Mann Whitney tests were carried out to com-
pare MacDQoL scores in those who did and did not report
binocular distortion or scotomas within 10° of vision. A
Bonferroni correction was applied (six tests, p <0.0083
accepted). None of the MacDQoL scores distinguished
between those who did and did not report distortion, but
compared with those who did not have binocular scoto-
mas, those who did reported poorer present QoL (means
[s.d.]: yes = 0.56 [1.21], no = 1.00 [1.09], U = 1728, p =
0.037), poorer MD-specific QoL (means [s.d.]: yes = -2.44
[0.79], no = -2.03 [0.88], U = 1607, p = 0.007) and lower
AWI scores (means [s.d.]: yes = -4.73 [2.04], no = -3.10
[2.02], U = 1244, p < 0.001) The MD-specific QoL
overview item and the AWI score comparisons remained
significant after applying the Bonferroni correction.
Open-ended question
In response to the final, open-ended question, 'Does MD
affect your quality of life in any ways that have not been
covered by the questionnaire?', 56 people answered 'yes'.
Those people stated one or more ways in which MD
affected their QoL. In most cases, the statements were
covered by items in the MacDQoL. Sixteen mentioned
reading, 11 hobbies, 6 getting out and about and 7 men-
tioned driving specifically. Seven people mentioned not
being able to recognise people, which may be related to
friends and social life or to people's reaction, but it may not
Table 7: Correlations (Spearman's r) between MacDQoL outcome variables and vision measures (*remains significant after Bonferroni
correction).
Present QoL p-value MD-specific
QoL
p-value AWI p-value
Distance VA better eye -0.301 <0.001* -0.310 <0.001* -0.431 <0.001*
Near VA better eye -0.327 <0.001* -0.192 0.017 -0.326 <0.001*
Contrast
sensitivity
better eye 0.200 0.012 0.300 0.001* 0.392 <0.001*
Colour vision binocular -0.204 0.011 -0.291 <0.001* -0.417 <0.001*
Comfortable
VA
binocular -0.207 0.012 -0.121 >0.05 -0.283 <0.001*
Glare test binocular -0.069 >0.05 -0.010 >0.05 0.022 >0.05
Table 8: Frequencies (and valid %) of reported scotomas and distortion in each eye and with binocular vision
Scotoma Distortion
Yes (valid%) No (valid%) Yes (valid%) No (valid%)
Right eye 80 (52.3) 73 (47.7) 68 (44.4) 85 (55.6)
Left eye 75 (48.7) 79 (51.3) 50 (32.7) 103 (67.3)
Binocular 39 (25.7) 113 (74.3) 58 (37.9) 95 (62.1)
Health and Quality of Life Outcomes 2005, 3:25 />Page 12 of 15
(page number not for citation purposes)
be fully encompassed by either item. Five people said they
were frustrated by MD. Frustration might be caused by
many aspects of living with MD, including items in the
MacDQoL, such as time taken, mishaps and losing things,
household tasks, personal affairs among others. There was no
clear case for needing additional items.
Non-attenders
Five people completed the interview but subsequently did
not attend the vision assessment. Mean MacDQoL scores
(and s.d.s) for those people were: present QoL = 1.00
(1.22); MD-specific QoL overview = -2.4 (0.89); AWI = -
3.13 (3.1). There were no significant differences in the
MacDQoL scores between attenders and non-attenders
(p's > 0.05).
Discussion
A total of 156 people completed both the telephone inter-
view and the vision assessment. This was 70% of those ini-
tially approached, representing a good response rate,
particularly for this elderly population. The excellent com-
pletion rate of MacDQoL items (99.85%) far exceeds the
75% obtained with utility measures [33] and it indicates
that the MacDQoL is a questionnaire that is acceptable to
respondents.
The wide individual variation in the ratings of impact and
of importance in the MacDQoL confirms that an individ-
ualised measure is needed. Weighting impact scores by
importance ratings further refines the validity and investi-
gative qualities of the measure. The fact that only three
item means remained in the same rank order of impact
once importance ratings had been incorporated shows
that incorporating importance scores has a noticeable
effect on QoL domain scores even at the level of group
means and individual scores are markedly affected by
weighting with importance scores.
The high reported negative impact on MD-specific
domains such as independence, personal affairs and do for
others suggests that the condition-specific measure will be
more sensitive than a generic QoL measure, as it investi-
gates aspects of life that are particularly impacted by MD
and these are not included in many, if any, generic
measures.
The 26-item MacDQoL was a long questionnaire and the
removal of three redundant items will reduce the burden
involved in its completion. Their meaning is encom-
passed in items retained in the questionnaire. A fourth
item, finances, also appeared to be a candidate for
removal, with a low impact rating, the lowest weighted
impact score and a small reduction to the internal consist-
ency of the scale. Also, it did not load well in the forced
single-factor analysis. However, at the time of the study,
the currently favoured treatment for focal wet MD, photo-
dynamic therapy, was not available free of charge through
the National Health Service and, for those who elected to
have the treatment, the financial burden was considera-
ble. The mean weighted impact score for finances masked
considerable individual variation, suggesting it would be
inappropriate to remove the item. If the MacDQoL is used
in countries where payment for treatment is also the
norm, the finances item will be salient. MD can also affect
finances in other ways, with extra costs being incurred for
work such as dressmaking, housework and house mainte-
nance, which people with MD may have undertaken
themselves when they had good eyesight. For some, there
may be an improvement in finances due to an entitlement
to disability allowances for severely visually impaired
people. In the present study one person reported that his
financial situation would be worse if he did not have MD.
Our preference was for a single factor, since a single score
is easier to use in both research and clinical contexts. Prin-
cipal components analysis was carried out to investigate
the possibility of a strong multi-factor structure. Factors
should be not only mathematically but also conceptually
distinct and they should form logical rather than appar-
ently arbitrary groups. There was some evidence of logical
grouping in the analyses but it was not convincing for all
items. In addition, when items were removed during the
item reduction process, the factor structure did not with-
stand these changes, indicating that the factor structure
was not stable. The forced single-factor analysis showed
that all items except work and finances loaded well
together and demonstrated a good single-factor structure,
supporting the use of an overall average weighted impact
score. The single factor structure improved further with
the removal of work from the scale. Since the work item
was applicable to so few people and there was little varia-
bility in the scores, this had an adverse effect on the cohe-
siveness of the scale. However, the item is likely to show
high impact and importance for those who do work, and
so it is important to retain the item in the questionnaire
for scoring separately. The factor structure of the
MacDQoL will be revisited at a later date using longitudi-
nal data to ensure that sensitivity to change over time is
not better measured using subscales.
The Cronbach's alpha of 0.944 for the 22-item scale indi-
cates high internal consistency reliability. An alpha of at
least 0.8 is regarded as adequate for group comparisons
but for clinical work, with individual patients, an alpha of
0.9 is regarded as a minimum [34]. Together with the
single-factor analysis, the reliability coefficient offered
considerable support for combining the MacDQoL items
in a single scale. Item-total correlations were also encour-
aging, ranging from 0.33 to 0.80. The alpha-if-item
deleted figures showed that items are similar in their effect
Health and Quality of Life Outcomes 2005, 3:25 />Page 13 of 15
(page number not for citation purposes)
on alpha and these data did not offer clear evidence for
the exclusion of any particular items. The high Cronbach's
alpha, however, suggested that other items could be
removed without detriment to the scale properties. It may
be useful to consider further the weighted item scores and
assess the impact of removing those with low weighted
impact. Nevertheless, as seen with reference to the finances
item, there may be good reasons for retaining some items
even though their weighted impact scores are low.
Correlations between the MacDQoL AWI and the two
overview items were moderate, with a higher correlation
between the AWI and the MD-specific QoL item, as
expected. The magnitude of the correlation, 0.58, which is
markedly less than the 0.7 required to indicate minimum
equivalence [35], indicates that the MD-specific QoL item
is no substitute for the AWI score.
Investigations of the relationships between the MacDQoL
scores and the scores on vision measures suggested that
the questionnaire has construct validity since, before Bon-
ferroni correction, 29 of the 36 associations investigated
were significant (p < 0.05), and 20 of these remained sig-
nificant after correction for familywise error. The associa-
tions that remained significant were, for the large part,
those that were expected to show the strongest relation-
ships. Overall, measures of better eye and binocular vision
were more strongly associated with the MacDQoL varia-
bles than measures of worse eye vision. This is to be
expected, since visual ability is largely a function of the
better eye and binocular function will be mainly
dependent on function in the better eye. The MacDQoL
demonstrates that MD has considerable negative impact
on many aspects of QoL, particularly independence, lei-
sure activities, ability to deal with personal affairs and
mobility. The more severe the visual impairment due to
MD, the greater is the negative impact of the condition on
QoL.
The AWI score showed stronger correlations with vision
measures than the MD-specific QoL overview item. The
AWI is a combination of scores from domains that
participants are specifically asked to consider, and the var-
iable thus offers a more systematic assessment of the
impact of MD on QoL than does the overview item. We
would expect it to show a stronger association with the
vision measures than the overview item. Nevertheless, the
MD-specific QoL overview item may be sufficiently sensi-
tive to be considered for use alone, for example, for audit
purposes.
The present QoL item was less strongly associated with
vision measures than were the AWI score and, to a lesser
extent, the MD-specific QoL overview item and this find-
ing was anticipated since, in assessing present QoL, indi-
viduals consider many factors other than the impact of
MD on QoL. The present QoL item did show significant
associations with a number of measures (particularly
measures of binocular vision), even after the Bonferroni
correction, and this demonstrates the extent of the dam-
age done to QoL by vision loss resulting from MD.
The only vision test with which the MacDQoL scores did
not show any relationship was the Eger glare test. The use-
fulness of the Eger stressometer in assessing the effect of
glare on people with MD has yet to be established but the
present data suggest little if any impact on QoL of glare as
measured by this new method of assessment.
Bradley et al [17] noted that items with an N/A option pre-
sented challenges when carrying out psychometric evalu-
ation of QoL measures. The procedure employed here for
dealing with missing data caused by N/A options was used
by Bradley et al [17] in order to retain sufficient data to
carry out the psychometric analyses and to make best use
of the available data. Both in the earlier study [17] and in
the present study, using zero to replace N/A, with listwise
deletion and treating N/A as missing with pairwise dele-
tion yielded similar results. In subsequent data analysis,
however, items that were N/A were excluded from the
weighted mean scores. If there were no N/A options avail-
able, participants would be likely to use 'the same'
responses to the impact scale and score zero for any item
that was not relevant to them and this would artificially
lower the AWI score. The N/A option is a feature of this
and other measures based on the ADDQoL that, in
addition to weighting items by importance, makes the
instruments individualised measures.
The open-ended question, which asked if there were any
ways in which MD affected QoL that were not covered by
the questionnaire, solicited 56 responses. However, in the
majority of cases, people commented on aspects of life
that had in fact been covered by the questionnaire. People
often made comments at this point to emphasize the
things that were most important to them, such as reading
and driving. Five people mentioned frustration. Frustra-
tion has not been stated explicitly in any MacDQoL items,
but it is implicit in most of them. Seven people men-
tioned not recognising people and, whereas there are a
number of items that refer to interacting with others, this
problem may not adequately be addressed by any of
them. It will be monitored in future work.
There was no difference in the MacDQoL scores of those
who did and did not attend the vision assessment. The
large discrepancy in the number of people in each group
would make a significant difference unlikely, but most of
those who did not attend were either ill on the day or una-
Health and Quality of Life Outcomes 2005, 3:25 />Page 14 of 15
(page number not for citation purposes)
ble to travel due to bad weather. It is not surprising, there-
fore, that the MacDQoL scores are similar.
The MacDQoL was originally designed for self-comple-
tion. Due to the anticipated severity of visual impairment
of some people in this sample the questionnaire was
administered by telephone. A mixture of completion
methods was decided against since previous research has
shown that people report less negative impact of MD on
QoL during telephone interviews than when self-complet-
ing the MacDQoL [22]. Using a single administration
method ensured that real differences in QoL due to sever-
ity of MD were not masked by biases caused by
methodology.
The sample participating in this study may differ from the
MD population as a whole in several ways. All but six peo-
ple had MD in both eyes. This probably reflects the fact
that participants were selected from an ophthalmologist's
clinic records. In the general population, many cases of
dry MD in one eye alone remain undiagnosed, or do not
get referred to a specialist, as there is currently no treat-
ment available. The full range of severity of MD, wet and
dry, was represented in the sample ensuring that the suit-
ability of the MacDQoL was assessed for representatives of
the MD population as a whole. The AWI score may be rel-
atively high due to the sample generally having more
severe MD than in the MD population as a whole, but this
would not affect the psychometric properties of the ques-
tionnaire in any way or its usefulness for people with
milder MD.
Participants completed the MacDQoL by telephone inter-
view and the methodology precluded seven people who
were originally selected to be invited to participate but
who did not have a telephone. A number of people who
were also originally selected to be invited to participate
were not contactable because contact details, including
telephone numbers, were not up to date. It was not possi-
ble to ascertain whether those people had moved, no
longer had a telephone or were deceased. Hearing impair-
ment would also have precluded people from
participating, but no one who was approached gave hear-
ing impairment as a reason for not wishing to take part.
Conclusion
The MacDQoL individualised measure of the impact of
MD on quality of life has been shown to have good psy-
chometric properties. By inviting participants to rate both
the impact of MD on domains of life and the importance
of those domains to QoL and by providing 'not applica-
ble' options it allows for a more individualised investiga-
tion of the impact of MD on QoL than is possible with
visual function questionnaires. Excellent completion rates
attest to the acceptability of the measure. The MacDQoL
has been shown to have good face and construct validity
with expected associations with visual function, particu-
larly when assessed binocularly or with the better eye. The
measure demonstrates that MD has a considerable nega-
tive impact on many aspects of life and on quality of life
per se. The MacDQoL is now ready for use in clinical trials,
routine clinical care and the evaluation of service
provision.
Authors' contributions
JM participated in the design of the study and in coordi-
nation of the research, carried out telephone interviews,
performed statistical analysis and drafted the manuscript.
JW participated in the design of the study, carried out
vision assessments and prepared the vision assessment
data for analysis. AW participated in the design of the
study, led the writing of the protocol and application for
ethical approval and participated in coordination of the
research. SJA participated in the design of the study, car-
ried out vision assessments and, with JW, prepared the
clinical data for analysis. CM carried out telephone inter-
views and contributed to the selection of redundant items.
Tf participated in the design of the study and advised on
clinical matters in the selection of participants. MR partic-
ipated in the design of the study and carried out vision
assessments. WA participated in the design of the study,
selected participants from his clinics and oversaw the
recruitment of participants and the vision assessment clin-
ics. CB, the lead investigator, conceived of the study, par-
ticipated in its design and oversaw progress of the work.
All authors read and approved the final manuscript.
Copyright of MacDQoL questionnaire
For access to and permission to use the MacDQoL ques-
tionnaire, contact the copyright holder, Clare Bradley
PhD, Professor of Health Psychology, Health Psychology
Research, Royal Holloway, University of London, Egham,
Surrey, TW20 0EX:
Acknowledgements
Alcon Research Ltd provided funding for the research. Our thanks go to
the research nurse, Kate Willbond, for her part in recruiting patients and
managing the vision assessment clinics. Our thanks also go to all the study
participants.
References
1. Evans J, Wormald R: Is the incidence of registrable age-related
macular degeneration increasing? British Journal of Ophthalmology
1996, 80:9-14.
2. Fletcher A, Donoghue M, Owen C: Low vision services for people
with age-related macular degeneration in the UK: A review
of service need and provision. Denbigh, Macular Disease Society;
2001.
3. Chopdar A, Chakravarthy U, Dinesh V: Age related macular
degeneration. B M J 2003, 326:485-488.
4. Williams RA, Brody BL, Thomas RG, Kaplan RM, Brown SI: The psy-
chosocial impact of macular degeneration. Arch Ophthalmol
1998, 116:514-520.
5. Mitchell J, Bradley P, Anderson SJ, ffytche T, Bradley C: Perceived
quality of health care in macular disease: a survey of mem-
Publish with Bio Med Central and every
scientist can read your work free of charge
"BioMed Central will be the most significant development for
disseminating the results of biomedical research in our lifetime."
Sir Paul Nurse, Cancer Research UK
Your research papers will be:
available free of charge to the entire biomedical community
peer reviewed and published immediately upon acceptance
cited in PubMed and archived on PubMed Central
yours — you keep the copyright
Submit your manuscript here:
/>BioMedcentral
Health and Quality of Life Outcomes 2005, 3:25 />Page 15 of 15
(page number not for citation purposes)
bers of the Macular Disease Society. Br J Ophthalmol 2002,
86:777-781.
6. Bowling A: Measuring Health. 2nd edition. Buckingham, Open Uni-
versity Press; 1998.
7. Bradley C: Importance of differentiating health status from
quality of life. Lancet 2001, 357:7-8.
8. Ware JE, Snow K, Kosinski M, Gaandek B: SF-36 health survey:
Manual and interpretation guide. Boston, MA, The Health Insti-
tute, New England Medical Center; 1993.
9. Bergner M: Development, testing and use of the Sickness
Impact Profile. In Quality of Life Assessment and application Edited by:
Walker SR and Rosser RM. Lancaster, MIT press; 1993.
10. Mangione CM, Gutierrez PR, Lowe G, Orav EJ, Seddon JM: Influence
of age-related maculopathy on visual functioning and health-
related quality of life. American Journal of Ophthalmology 1999,
128:45-53.
11. Mills RP: Correlation of quality of life with clinical symptoms
and signs at the time of glaucoma diagnosis. Trans American
Ophthalmological Society 1998, XCVI:753-812.
12. Rubin GS, Roche KB, Prasada-Rao P, Fried LP: Visual impairment
and disability in older adults. Optometry and Vision Science 1994,
71:750-760.
13. Mangione CM, Lee PP, Pitts J, Gutierrez P, Berry S, Hays RD: Psycho-
metric properties of the National Eye Institute Visual Func-
tion Questionnaire (NEI-VFQ). NEI-VFQ Field Test
Investigators. Archives of Ophthalmology 1998, 116:1496-1504.
14. Mangione CM, Phillips RS, Seddon JM, MG L, EF C, R D, L G: Devel-
opment of the 'Activities of Daily Vision Scale': a measure of
functional health status. Medical Care 1992, 30:1111-1126.
15. McGee HM, O'Boyle CA, Hickey AM, O'Malley K, Joyce CRB:
Assessing the quality of life of the individual: the SEIQoL
with a healthy and a gastroenterology unit population. Psycho-
logical Medicine 1991, 21:749-759.
16. Ruta DA, Garratt AM, Russell IT: Patient centred assessment of
quality of life for patients with four common conditions. Qual-
ity in Health Care 1999, 8:22-29.
17. Bradley C, Todd C, Gorton T, Symonds E, Martin A, Plowright R:
The development of an individualized questionnaire meas-
ure of perceived impact of diabetes on quality of life: the
ADDQoL. Quality of Life Research 1999, 8:79-91.
18. Kinmonth AL, Woodcock A, Griffin S, Spiegel N, Campbell MJ: Ran-
domised control trial of patient-centred care in general
practice: impact on current well-being and future disease
risk. British Medical Journal 1998, 317:1202-1208.
19. Bradley C, Speight J: Patient perceptions of diabetes and diabe-
tes therapy: assessing quality of life. Diabetes Metabolism and
Research Reviews 2002, 18:S64-S69.
20. DAFNE Study Group: Training inflexible, intensive insulin man-
agement to enable dietary freedom in people with type 1
diabetes: the dose adjustment for normal eating (DAFNE)
randomised controlled trial. B M J 2002, 325:746-749.
21. Mitchell J, Bradley C: Design of an individualised measure of the
impact of macular disease on quality of life: the MacDQoL.
Quality of Life Research 2004, 13:1163-1175.
22. Mitchell J, Woodcock A, Bradley C: Comparison between tele-
phone interview and self-completion of the MacDQoL. Quality
of Life Research 2004, 13:1548 abstract.
23. Wolffsohn JS, Cochrane AL, Watt NA: Implementation methods
for vision-related quality of life questionnaires. British Journal of
Ophthalmology 2000, 84:1035-1040.
24. SPSS: SPSS Data Entry Builder 3.0 user's guide. Chicago, SPSS
Inc.; 2001.
25. Ferris FL, Kassoff A, Bresnick GH, Bailey I: New visual acuity
charts for clinical research. American Journal of Ophthalmology
1982, 94:91-96.
26. Ahn SJ, Legge GE, Luebker A: Printed cards for measuring low-
vision reading speed. Vision Research 1995, 35:1939-1944.
27. Pelli DG, Robson JG, Wilkins AJ: The design of a new chart to
measure contrast sensitivity. Clinical Vision Science 1988,
2:187-199.
28. Engler CB, Sander B, Koefoed P, Larsen M, Vinding T, Lundandersen
H: Interferon alpha-2A treatment of patients with subfoveal
neovascular macular degeneration - a pilot investigation. Acta
Ophthalmologica 1993, 71:27-31.
29. Atchison DA, Bowman KJ, Vingrys AJ: Quantitave scoring meth-
ods for D15 panel tests in the diagnosis of congenital colour-
vision deficiencies. Optometry and Vision Science 1991, 68:41-48.
30. Bartlett H, Davies LN, Eperjesi F: Reliability, normative data, and
the effect of age-related macular disease on the Eger Macu-
lar Stressometer. Ophthalmic Physiol Opt 2004, 24:594-599.
31. Statistics Package for the Social Sciences. 9.,0 edition. Chicago,
SPSS Inc; 1998.
32. Woodcock A, Bradley C, Plowright R, Ffytche T, Kennedy-Martin T,
Hirsch A: The influence of diabetic retinopathy on quality of
life. Interviews to guide the design of a condition-specific,
individualised questionnaire: the RetDQoL. Patient Educ Couns
2004, 53:365-383.
33. Mitchell J, Bradley C: Measuring quality of life in macular dis-
ease: what use are utilities? Quality of Life Research 2003, 12:865.
34. Nunnally JC, Bernstein IH: Psychometric theory: third edition.
New York, McGraw-Hill; 1994.
35. Tabachnick BG, Fidell LS: Using multivariate statistics. 3rd edi-
tion. New york, Harper Collins; 1996.