Health and Quality of Life Outcomes BioMed Central Research Open Access Injection Drug Use potx
Bạn đang xem bản rút gọn của tài liệu. Xem và tải ngay bản đầy đủ của tài liệu tại đây (271.77 KB, 10 trang )
BioMed Central
Page 1 of 10
(page number not for citation purposes)
Health and Quality of Life Outcomes
Open Access
Research
Injection Drug Use Quality of Life scale (IDUQOL): A validation
study
Anita M Hubley*
1
, LaraBRussell
1
and Anita Palepu
2,3
Address:
1
Measurement Evaluation and Research Methodology, Dept of ECPS, 2125 Main Mall, The University of British Columbia, Vancouver,
BC, Canada,
2
Division of Internal Medicine, Department of Medicine, Faculty of Medicine, University of British Columbia, Vancouver, BC, Canada
and
3
Centre for Health Outcome and Evaluation Sciences, St. Paul's Hospital, Vancouver, BC, Canada
Email: Anita M Hubley* - ; Lara B Russell - ; Anita Palepu -
* Corresponding author
Drug UseFactor AnalysisPsychometricsQuality of LifeReliabilityValidity
Abstract
Background: Existing measures of injection drug users' quality of life have focused primarily on
health and health-related factors. Clearly, however, quality of life among injection drug users is
impacted by a range of unique cultural, socioeconomic, medical, and geographic factors that must
also be considered in any measure. The Injection Drug User Quality of Life (IDUQOL) scale was
designed to capture the unique and individual circumstances that determine quality of life among
injection drug users. The overall purpose of the present study was to examine the validity of
inferences made from the IDUQOL by examining the (a) dimensionality, (b) reliability of scores, (c)
criterion-related validity evidence, and (d) both convergent and discriminant validity evidence.
Methods: An exploratory factor analysis using principal axis factoring in SPSS 12.0 was conducted
to determine whether the use of a total score on the IDUQOL was advisable. Reliability of scores
from the IDUQOL was obtained using internal consistency and one-week test-retest reliability
estimates. Criterion-related validity evidence was gathered using variables such as stability of
housing, sex trade involvement, high-risk injection behaviours, involvement in treatment programs,
emergency treatment or overdose over the previous six months, hospitalization and emergency
treatment over the subsequent six month period post data collection. Convergent and discriminant
validity evidence was gathered using measures of life satisfaction, self-esteem, and social desirability.
Results: The sample consisted of 241 injection drug users ranging in age from 19 to 61 years.
Factor analysis supports the use of a total score. Both internal consistency (alpha = .88) and one-
week test-retest reliability (r = .78) for IDUQOL total scores were good. Criterion-related,
convergent, and discriminant validity evidence supports the interpretation of IDUQOL total scores
as measuring a construct consistent with quality of life.
Conclusion: The findings from this study provide initial evidence to support the use of the
IDUQOL total score. The results of the study also suggest the IDUQOL could be further
strengthened with additional attention to how some IDUQOL domains are described and
satisfaction is measured.
Published: 19 July 2005
Health and Quality of Life Outcomes 2005, 3:43 doi:10.1186/1477-7525-3-
43
Received: 04 May 2005
Accepted: 19 July 2005
This article is available from: />© 2005 Hubley et al; licensee BioMed Central Ltd.
This is an Open Access article distributed under the terms of the Creative Commons Attribution License ( />),
which permits unrestricted use, distribution, and reproduction in any medium, provided the original work is properly cited.
Health and Quality of Life Outcomes 2005, 3:43 />Page 2 of 10
(page number not for citation purposes)
Background
Existing measures of injection drug users' (IDUs) quality
of life (QoL) have focused primarily on health and health-
related factors. The Opiate Treatment Index, the only
standardized instrument designed specifically for IDUs, is
essentially a symptom checklist [1]. The Nottingham
Health Profile [2,3] focuses exclusively on health. The
MOS surveys (MOS SF-36, MOS SF-20 and MOS-HIV)
have been used in IDU populations but because they are
constructed to measure the range of health in the general
population (with the exception of MOS-HIV), IDUs score
very poorly [4,5]. It makes intuitive sense that IDUs have
lower physical and psychological health relative to the
general population. It is not surprising that IDU scores
tend to be clustered at the low end of the distribution and
that instruments devised for the general population may
not be particularly sensitive to change in the IDU popula-
tion. For example, some studies found that, in working
with HIV patients with a history of injection drug use,
some scales measuring the physical aspects of QoL were
relatively insensitive to change and that the effects of drug
use tended to overshadow the impact of HIV on health
[6,7]. Among crack smokers, most SF-36 subscales did not
reflect the adverse health effects of crack cocaine use and
therefore appeared to have limited applicability with this
population [8].
A meta-analysis of existing QoL studies indicated that
QoL and health status are distinct constructs that should
not be used interchangeably [9]. Of the instruments used
with IDUs, only the MOS series examine QoL domains
other than health. With the exception of the MOS-HIV
(which was adapted for use with HIV patients), the MOS
domains were chosen to measure QoL of the general pop-
ulation. Existing QoL tools do not measure the QoL of
drug users in a culturally-sensitive fashion [10]. Problems
arise with both the item content and methods of admin-
istration. These measures clearly do not take into account
the full complexity of drug dependence or account for the
individual factors that may compromise effective admin-
istration. The social context in which drug injectors live is
likely a key component of their QoL and most measures
do not capture the chronic long-term impact of drug use
on diverse domains such as social, psychological, physical
and occupational realms [11]. Even instruments such as
the MOS-HIV that are devised for HIV-infected individu-
als are often not applicable to actively using IDUs because
the effects of drug use tend to overshadow the impact of
HIV [6].
QoL assessment continues to be widely used in clinical tri-
als and observational studies of health and disease to eval-
uate clinical interventions, treatment side effects, and
disease impact over time [12]. It has become evident that
population-sensitive approaches that consider the many
components of an individual's life that are deemed critical
to his/her QoL are needed. Clearly, QoL among IDUs
encapsulates a range of unique cultural, socioeconomic,
political, medical, and geographic factors that must be
considered in measuring QoL. With these considerations
in mind, the Injection Drug User Quality of Life (IDU-
QOL) scale, an instrument that captures the unique and
individual circumstances that determine QoL among
IDUs, was developed [13]. To be able to use an instrument
with confidence, however, one needs to be able to provide
evidence of the validity – that is, the meaningfulness, use-
fulness, and appropriateness – of the inferences to be
made from scores obtained on the instrument with a
given population and in a given context [14-16]. The over-
all purpose of the present study was to examine the valid-
ity of inferences made from the IDUQOL. Several lines of
construct validity evidence were examined: (a) essential
unidimensionality supporting use of an IDUQOL total
score, (b) internal consistency and test-retest reliability of
IDUQOL scores, (c) criterion-related validity evidence,
and (d) both convergent and discriminant validity
evidence.
Methods
Sample
Participants consisted of a sub-sample of individuals par-
ticipating in the Vancouver Injection Drug User Study
(VIDUS), a longitudinal study of the incidence of HIV
among IDUs in Vancouver, Canada. The research design
and methods of the VIDUS have been previously
described [17]. In brief, this open cohort study was initi-
ated in 1996 to clarify the socio-demographic and behav-
ioural determinants of HIV sero-conversion among this
group. Eligibility for initial enrolment required current
injection drug use (injected at least once within the last
month) and evidence of recent injection was required by
inspection of needle tracks. Potential participants also
were required to reside in the Lower Mainland of British
Columbia and provide informed consent. Most partici-
pants (82%) were recruited through word of mouth and
street outreach programs. The remaining participants were
referred by the needle-exchange program (5%), other
storefront agencies (10%), and clinics (3%). Participants
who have stopped injecting after the baseline visit are still
eligible for follow-up. Trained interviewers administer a
survey instrument every 6 months. Participants are asked
about their demographics, needle sharing, drug using
behaviour, sexual behaviours, access to clean needles and
syringes, access to health care, service needs, and medical
service use (e.g., self-reported visits to primary care/outpa-
tient clinics, Emergency Department, detoxification,
methadone maintenance, ambulance use and hospital
admissions). Participants were reimbursed $20 CDN for
each study visit, at which time referrals were provided for
medical care, HIV/AIDS care, available drug and alcohol
Health and Quality of Life Outcomes 2005, 3:43 />Page 3 of 10
(page number not for citation purposes)
treatment and counselling as needed. The VIDUS study
participants may not be representative of all IDUs because
those in the lowest socioeconomic group are overrepre-
sented in this study sample. However, it is this group that
is most in need of innovative interventions.
In the present study, a total of 250 individuals were
recruited in the order in which they appeared for their reg-
ularly scheduled appointment for VIDUS. A subsequent
appointment for the quality of life study was scheduled
and participants were paid $10 CDN in each session of the
present study. Data from nine participants were excluded
because of missing data or because they were deemed, at
the time of data collection, to be too impaired to focus on
the research tasks. The final sample consisted of 241 IDUs
ranging in age from 19 to 61 years (M = 39.4, SD = 9.5
years). There were more males (63%) than females (37%)
and most participants (85%) had completed high school.
There were no significant socio-demographic or drug
using behaviour differences between the 250 recruited
individuals and the other VIDUS participants.
The first 50 participants were invited to return for a second
session within 6–8 days to collect test-retest reliability
data. All 50 participants returned for the second session as
scheduled. In the test-retest group, 58% were male and
42% were female. These participants ranged in age from
22 to 59 years (M = 41.7, SD = 9.2). Most of the partici-
pants (90%) had completed high school.
Measures
Injection Drug User Quality of Life Scale (IDUQOL)
The present version of the IDUQOL consists of 21 life
domains and builds on the original version first pub-
lished by Brogly et al. [13]. Many of these domains (e.g.,
Being Useful, Drugs, Drug Treatment, Harm Reduction
and Neighbourhood Safety) are particularly relevant to
the physical, social, psychological, occupational, and geo-
graphical reality of IDUs' lives. Life domains are each rep-
resented on a 5 by 5 inch card, with the name of the
domain and a simple representative picture on the front
of the card and a description of the domain on the back of
the card. Graphic representations were used so that this
measure would be more accessible to respondents who do
not speak English as a first language or have low literacy
skills.
Although the administration of the IDUQOL permitted
respondents to subjectively weight the importance of the
life domains to his/her quality of life, a review of the liter-
ature on importance ratings and weighting [18] as well as
an empirical comparison of the utility of weighted versus
unweighted scores with the IDUQOL showed that weight-
ing does not improve upon the use of simpler unweighted
scores [19]. Thus, unweighted scores are used in the
present study, wherein the respondent simply assigned a
satisfaction rating for each life domain using a 7-point
Likert-type scale ranging from 1 (very dissatisfied) to 7
(very satisfied) and illustrated with seven stylised frown-
ing and smiling faces. Again, visual representation was
included as a guide for respondents with limited English
or literacy skills. Domain scores were summed and aver-
aged to obtain an overall quality of life score ranging from
1 (very dissatisfied) to 7 (very satisfied).
Satisfaction with Life Scale (SWLS)
The SWLS is a 5-item global measure of life satisfaction
[20]. Scores range from 5 to 35, with higher scores repre-
senting greater life satisfaction. This measure was selected
because life satisfaction was seen as a related construct to
quality of life.
Rosenberg's Self-Esteem Scale (RSES)
The RSES is a 10-item measure of global self-esteem [21].
Total scores range from 10 to 40, with higher scores repre-
senting greater self-esteem. This measure was selected
because self-esteem was seen as a related construct to
quality of life.
Marlowe-Crowne Social Desirability Scale Short Form X2
(MC X2)
The MC X2 [22] is a 10-item short form version of the
Marlowe-Crowne Social Desirability Scale (MC SDS) [23].
Strahan and Gerbasi reported that it correlates .80 or
higher with the MC SDS. The MC X2 provides an estimate
of socially desirable responding as a potential source of
measurement error. Total scores range from 0 to 10, with
higher scores representing higher social desirability in
responding. The MC X2 was selected because measures of
pervasive characteristics such as social desirability are
strongly recommended to assess discriminant validity
[24,25].
Demographic Information
In examining criterion-related validity, the following
demographic variables were used to create groups
expected to differ in their quality of life: stability of hous-
ing, sex trade involvement, high-risk injection behaviours
(i.e., lending or borrowing needles, daily use of heroin,
cocaine, speed, or crack), involvement in a methadone
maintenance program or drug treatment program, report-
ing hospitalization and emergency department attend-
ance or overdose within the previous six months.
Predictive criterion variables included: hospitalization
and emergency treatment over the six-month period post-
data collection. All variables were measured and coded
dichotomously.
Health and Quality of Life Outcomes 2005, 3:43 />Page 4 of 10
(page number not for citation purposes)
Procedures
Ethics approval for this study was obtained from the Uni-
versity of British Columbia and Providence Health Care
Research Ethics Boards. Participants met one-on-one with
one of three trained VIDUS staff members for a single ses-
sion lasting approximately 25–30 minutes. Participants
were identified only by their VIDUS study ID code on all
research forms utilized for this project. All participants
provided informed consent and then completed the study
measures in the same order (IDUQOL, MC X2, SWLS,
RSES). Demographic and predictive criterion data were
obtained from VIDUS using the participants' VIDUS ID
codes, a use that was disclosed to participants as part of
their informed consent. Retest sessions for the sub-sample
of 50 participants followed the same consent process, for-
mat, and tasks as the initial session.
Results
Essential unidimensionality and use of IDUQOL total score
To be able to use a summed total score on a measure such
as the IDUQOL, it is important to demonstrate that the
measure shows either strict or essential unidimensionality
[26,27]. Strict unidimensionality denotes the presence of
a single common factor whereas essential unidimension-
ality indicates the presence of a reasonably dominant
common factor along with secondary minor dimensions
[28,29].
An exploratory factor analysis using principal axis factor-
ing in SPSS 12.0 was conducted on the 21 items of the
IDUQOL to determine whether essential unidimensional-
ity was present and supported the use of the IDUQOL
total score. According to Gorsuch's guideline of 5 to 10
cases per item [30], the sample size for the present study
(n = 241) was considered adequate for factor analysis of
the 21-item IDUQOL. The data met the criteria for Bar-
tlett's Test of Sphericity, χ
2
(210) = 1488.02, p < 0.001 and
the Kaiser-Meyer-Olkin criteria for sampling adequacy,
KMO = .88 [31]. The first factor had an eigenvalue of 6.40
and explained 30.5% of the variance in participants'
responses. The ratio of the first to the second eigenvalue
was 4.3 which exceeds the strict criterion of a ratio greater
than 4.0 for evidence of unidimensionality [30,32,33].
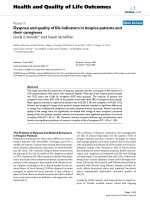
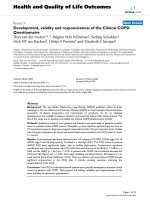
These results, in addition to a visual examination of the
scree plot (see Figure 1) indicated an essentially unidi-
mensional factor structure for the IDUQOL, which sup-
ported the use of a total score [32-35]. Factor loadings
ranged from .31 to .71 for all IDUQOL items on a single
factor.
Mean performance and reliability
Table 1 displays the inter-item correlation matrix for the
IDUQOL. The mean inter-item correlation was .26, which
Clark and Watson [36] describe as acceptable. Table 2
shows the mean performance and internal consistency of
scores obtained by the sample on the IDUQOL, SWLS,
RSES, and MC X2. Given the focus in the present study on
the IDUQOL, gender differences on scores from this
measure were also examined. No statistically significant
differences in performance on the IDUQOL were found
between men (M = 4.25, SD = 0.96) and women (M =
4.10, SD = 1.02), t (239) = 1.14, p = .20, and the effect size
(d = 0.15) is considered small according to Cohen [37].
In addition to an internal consistency reliability estimate,
the one-week test-retest reliability estimate for the IDU-
QOL scores was also computed. Based on the sub-sample
of 50 participants who completed the measure twice, the
test-retest reliability estimate was .78, with correlations for
each domain across the two sessions ranging from .32 to
.67. Table 3 shows the test-retest correlations for all
domains.
Criterion-related validity evidence
Table 4 shows the correlations of the IDUQOL total scores
with the dichotomously scored criterion variables. Of the
statistically significant correlations, all were in the
expected direction. That is, lower IDUQOL scores were
related to unstable housing, sex trade involvement, bor-
rowing and lending needles, daily use of heroin and
speed, and overdose in the past six months. The IDUQOL
scores did not correlate significantly with daily use of
cocaine or crack, methadone or drug treatment, emer-
gency treatment, or hospitalization within the six months
prior to, or following, the initial test session.
IDUQOL scores are based on a wide range of domains
that encompass social, physical and emotional realms,
and therefore, as a total score, might not correlate signifi-
cantly with specific criterion variables. To explore this
possibility, analyses were carried out at the domain level,
matching available criterion variables with relevant IDU-
QOL domains. For example, the criterion variables of
engaged in sex trade and Rosenberg Self-Esteem Scale
scores were correlated with the Feeling Good about Your-
self IDUQOL domain score. Table 5 shows the correla-
tions of selected IDUQOL domain scores and
corresponding criterion variables.
Convergent and discriminant validity evidence
Table 6 shows the correlations of IDUQOL total scores
with the SWLS, RSES, and MC X2. The convergent meas-
ures (SWLS, RSES) showed moderately high correlations
with the IDUQOL as would be expected between con-
structs that are related but not the same. The correlation
between the IDUQOL and the discriminant measure (MC
X2) was in the low to moderate range and thus acceptable
[38]. As expected, the convergent measures were both
more highly correlated with the IDUQOL total score than
was the discriminant measure. Correlations were also
Health and Quality of Life Outcomes 2005, 3:43 />Page 5 of 10
(page number not for citation purposes)
conducted between the MC X2 and both the SWLS (r =
.35) and RSES (r = .41). Because the relationship between
the IDUQOL and the convergent measures could be due
to the common influence of social desirability bias, partial
correlations between the IDUQOL total scores and the
SWLS and RSES, controlling for MC X2 scores, were con-
ducted. These are reported in Table 6.
Discussion
The IDUQOL was developed to be a more appropriate
and sensitive measure of quality of life for IDUs within
their unique context of social, psychological, physical,
occupational, and geographical factors. This study was
designed to examine the construct validity of inferences
made from the IDUQOL by exploring the factor structure,
reliability, criterion-related validity evidence, and conver-
gent and discriminant validity evidence. The exploratory
factor analysis using principal axis factoring indicates the
presence of essential unidimensionality, which, in turn,
supports the use of a total score for the IDUQOL. Internal
consistency and one week test-retest reliability estimates
for the IDUQOL total score were satisfactory.
Criterion-related validity evidence for inferences made
from IDUQOL total scores is weak. That is, although
lower IDUQOL total scores were statistically significantly
related to unstable housing, involvement in the sex trade,
borrowing and lending needles, daily use of heroin and
speed, and overdose in the previous six months, the corre-
lations were low (r = 14 to 26). Moreover, IDUQOL
total scores did not correlate significantly with daily use of
cocaine or crack, methadone or drug treatment, emer-
gency treatment within the previous six months, or hospi-
talization within the following six months (r = 12 to
.07). These results may not be too surprising, however,
given that the IDUQOL measures numerous life domains.
When specific criterion variables were correlated with
individual IDUQOL domains, some showed considerably
stronger correlations (e.g., Rosenberg Self-Esteem Scale
correlated .58 with the Feeling Good about Yourself
Scree Plot Showing Eigenvalues for Each Possible Factor of the IDUQOLFigure 1
Scree Plot Showing Eigenvalues for Each Possible Factor of the IDUQOL.
1 2 3 4 5 6 7 8 9 10 11 12 13 14 15 16 17 18 19 20 21
Factor Number
0
1
2
3
4
5
6
7
Eigenvalue
Health and Quality of Life Outcomes 2005, 3:43 />Page 6 of 10
(page number not for citation purposes)
domain; instability of housing correlated 30 with the
Housing domain; drug treatment program and metha-
done treatment correlated .21 and .19, respectively, with
the Drug Treatment domain). The fact that the correla-
tions between other criterion variables and specific
domains did not change appreciably or even declined
(e.g., daily use of specific drugs with the Drugs domain)
suggests that there may be some lack of consistency in
how participants interpreted the IDUQOL domains. For
example, when rating their level of satisfaction with the
Drugs domain, it is not clear whether individual partici-
pants may have indicated dissatisfaction because of a lack
of availability of drugs or because of the impact of drugs
in their lives. As a result, this lack of clarity may produce
low or near-zero correlations between criterion variables
and some IDUQOL domain ratings. In other cases, corre-
lations may be low because of low variability (e.g., mor-
tality) or reduced information (e.g., dichotomous (yes/
no) rather than continuous (actual number) measure-
ment of overdoses in previous six months) in the criterion
variables. In future criterion-related validity research
involving the IDUQOL, some criterion variables may
need to be measured differently to improve the variability
in scores.
These results suggest that improvements can be made to
how (a) some IDUQOL domains are described, and (b)
satisfaction is measured that would strengthen the utility
Table 1: Inter-item Correlations on the IDUQOL
Item
s
BU DR DT ED FA FG FR HR HE HC HO IN LA MO NS PA RC SX SP TR
BU 1.00
DR 0.27 1.00
DT 0.14 0.37 1.00
ED 0.36 0.13 0.14 1.00
FA 0.35 0.12 0.15 0.13 1.00
FG 0.54 0.43 0.26 0.25 0.34 1.00
FR 0.31 0.22 0.20 0.28 0.35 0.52 1.00
HR 0.21 0.21 0.22 0.17 0.10 0.15 0.15 1.00
HE 0.29 0.38 0.25 0.13 0.25 0.43 0.29 0.13 1.00
HC 0.17 0.20 0.40 0.19 0.23 0.29 0.27 0.18 0.35 1.00
HO 0.23 0.30 0.21 0.16 0.30 0.33 0.40 0.10 0.40 0.37 1.00
IN 0.39 0.34 0.31 0.25 0.28 0.48 0.37 0.22 0.31 0.40 0.31 1.00
LA 0.45 0.35 0.23 0.28 0.22 0.38 0.37 0.22 0.16 0.30 0.31 0.31 1.00
MO 0.35 0.26 0.16 0.30 0.20 0.34 0.33 0.14 0.28 0.31 0.28 0.31 0.41 1.00
NS 0.31 0.18 0.24 0.19 0.22 0.32 0.42 0.26 0.29 0.36 0.36 0.37 0.34 0.34 1.00
PA 0.22 0.14 0.18 0.12 0.26 0.29 0.27 0.04 0.18 0.14 0.26 0.24 0.15 0.11 0.21 1.00
RC 0.18 0.09 0.18 0.24 0.17 0.20 0.29 0.25 0.12 0.27 0.13 0.26 0.25 0.26 0.24 0.11 1.00
SX 0.24 0.18 0.12 0.14 0.36 0.29 0.33 0.06 0.26 0.19 0.25 0.24 0.24 0.23 0.22 0.60 0.20 1.00
SP 0.27 0.25 0.28 0.25 0.29 0.45 0.37 0.17 0.21 0.16 0.18 0.29 0.30 0.24 0.17 0.18 0.11 0.20 1.00
TR 0.29 0.18 0.19 0.34 0.19 0.27 0.34 0.14 0.21 0.22 0.34 0.30 0.34 0.36 0.25 0.10 0.28 0.19 0.21 1.00
TO 0.39 0.29 0.29 0.24 0.25 0.46 0.50 0.13 0.39 0.37 0.34 0.43 0.35 0.31 0.40 0.17 0.24 0.18 0.31 0.30
Items: BU = Being Useful; DR = Drugs; DT = Drug Treatment; ED = Education; FA = Family; FG = Feeling Good; FR = Friends; HR = Harm
Reduction; HE = Health; HC = Health Care; HO = Housing; IN = Independence; LA = Leisure Activities; MO = Money; NS = Neighbourhood
Safety; PA = Partner(s); RC = Resources in the Community; SX = Sex; SP = Spirituality; TR = Transportation; TO = Treatment by Others.
Table 2: Mean Performance and Reliability on the IDUQOL, MC X2, SWLS, and RSES
Possible Score Range Actual Score Range Mean (Standard Deviation) Internal Consistency
IDUQOL 0 – 7 1.9 – 6.7 4.19 (0.98) .88
SWLS 5 – 35 5 – 32 14.44 (7.17) .85
RSES 10 – 40 11 – 40 27.39 (4.96) .82
MC X2 0 – 10 0 – 10 4.53 (2.10) .62
IDUQOL = Injection Drug User Quality of Life Scale, SWLS = Satisfaction with Life Scale, RSES = Rosenberg Self Esteem Scale, MC X2 = Marlowe-
Crowne Social Desirability Short Form X2. Internal consistency reliability estimates were obtained using Cronbach's coefficient alpha.
Health and Quality of Life Outcomes 2005, 3:43 />Page 7 of 10
(page number not for citation purposes)
of this measure. Individual qualitative interviews with
IDUs to explore how individuals are interpreting the IDU-
QOL domains and assigning satisfaction ratings would
provide important guidance on the types of modifications
to be made. More importantly, further consideration
needs to be given to how the IDUQOL can be used effec-
tively as an outcome measure in intervention studies in
which programs addressing specific aspects of quality of
life (e.g., housing, health) are evaluated.
Convergent and discriminant validity evidence for the
IDUQOL was strong. Convergent measures (SWLS, RSES)
Table 3: One Week Test-Retest Reliability Estimates for the IDUQOL Domain and Total Scores
IDUQOL Domain Reliability Estimate
Being Useful .60**
Drugs .59**
Drug Treatment .32*
Education .44**
Family .43**
Feeling Good .67**
Friends .66**
Harm Reduction .47**
Health .44**
Health Care .44**
Housing .63**
Independence .57**
Leisure Activities .62**
Money .55**
Neighbourhood Safety .65**
Partner(s) .64**
Community Resources .34*
Sex .52**
Spirituality .57**
Transportation .59**
Treatment by Others .49**
IDUQOL Total Score .78**
* p <.05, ** p <.01; N = 50
Table 4: Correlations of IDUQOL Total Scores with Criterion Measures
Criterion Variable IDUQOL Total Score
Housing (stable = 0/ unstable = 1) 16*
Engaged in sex trade (no = 0/yes = 1) 17**
Currently borrowing needles (no = 0/yes = 1) 19**
Currently lending needles (no = 0/yes = 1) 25**
At least once daily use of heroin (no = 0/yes = 1) 26**
At least once daily use of cocaine (no = 0/yes = 1) 11
At least once daily use of speed (no = 0/yes = 1) 14*
At least once daily use of crack (no = 0/yes = 1) 12
Currently on methadone treatment (no = 0/yes = 1) .07
Drug treatment program in last 6 months (no = 0/yes = 1) .01
Overdose in last 6 months (no = 0/yes = 1) 14*
Visited ER in last 6 months (no = 0/yes = 1) 06
Hospitalized in last 6 months (no = 0/yes = 1) 06
Visited ER in subsequent 6 months (no = 0/yes = 1) 05
Hospitalized in subsequent 6 months (no = 0/yes = 1) .01
*p < .05, **p < .01; N = 241
Health and Quality of Life Outcomes 2005, 3:43 />Page 8 of 10
(page number not for citation purposes)
correlated more highly with the IDUQOL total scores
than was the discriminant measure (MC X2). The moder-
ate (r = .54 to .59) correlations between the IDUQOL total
scores and the measures of related, but not identical, con-
structs of life satisfaction and self-esteem are to be
expected. The finding of a significant but low moderate
correlation of .35 between the IDUQOL total scores and
the MC X2 provides evidence to support discriminant
validity but also suggests social desirability plays some
role in participants' responses. A similar relationship was
found between the MC X2 and both the SWLS and RSES.
Because the relationship between the IDUQOL and the
convergent measures could be due to the common influ-
ence of social desirability bias, partial correlations
between the IDUQOL total scores and the SWLS and
RSES, controlling for MC X2 scores, were examined. The
results showed that, although the magnitude of these cor-
relations declined slightly, the relationships between the
IDUQOL and both the SWLS and RSES were not due to
social desirability bias.
Conclusion
The findings from this study provide preliminary evidence
to support the meaningfulness, usefulness, and appropri-
ateness of inferences made from IDUQOL total scores.
Factor analysis supports the use of a total score. Both
Table 5: Correlations of Selected IDUQOL Domain Scores with Selected Criterion Variables
Criterion Variable IDUQOL Domains
Drugs
At least once daily use of heroin (no = 0/yes = 1) 13
At least once daily use of cocaine (no = 0/yes = 1) 07
At least once daily use of speed (no = 0/yes = 1) 12
At least once daily use of crack (no = 0/yes = 1) 07
Drug Treatment
Currently on methadone treatment (no = 0/yes = 1) .19**
Drug treatment program in last 6 months (no = 0/yes = 1) .21**
Feeling Good About Yourself
Rosenberg Self Esteem Scale .58**
Engaged in sex trade (no = 0/yes = 1) 20**
Health
Currently on methadone treatment (no = 0/yes = 1) .06
Drug treatment program in last 6 months (no = 0/yes = 1) .01
Visited ER in last 6 months (no = 0/yes = 1) 14*
Hospitalized in last 6 months (no = 0/yes = 1) 16*
Health Care
Visited ER in last 6 months (no = 0/yes = 1) .03
Hospitalized in last 6 months (no = 0/yes = 1) .003
Housing
Housing (stable = 0/ unstable = 1) 30**
How Others Treat You
Engaged in sex trade (no = 0/yes = 1) 15*
*p < .05, **p < .01; N = 241
Table 6: Correlations and Partial Correlations of IDUQOL Total Scores With Convergent and Discriminant Measures
Correlations with IDUQOL Total Score
a
Partial Correlations with IDUQOL Total
Score
b
Convergent Measures
Satisfaction With Life Scale .59** .54**
Rosenberg Self Esteem Scale .54** .47**
Discriminant Measure
Marlowe-Crowne Social Desirability Scale
(MC X2)
.35**
**p < .01;
a
N = 241;
b
Partial correlations control for MC X2 scores, N = 238
Health and Quality of Life Outcomes 2005, 3:43 />Page 9 of 10
(page number not for citation purposes)
internal consistency (Cronbach alpha = .88) and one-
week test-retest reliability (r = .78) for IDUQOL total
scores are good. Convergent and discriminant validity
evidence supports the interpretation of IDUQOL total
scores as measuring a construct consistent with quality of
life and yet distinctive from life satisfaction, self-esteem,
and social desirability bias. The criterion-related validity
evidence is weak, but also suggests that the utility of the
IDUQOL could be further improved with greater atten-
tion to how some IDUQOL domains are described, how
satisfaction is measured, and how the IDUQOL and its
domains may be applied in both the development and
evaluation of various interventions (e.g., drug treatment
programs, health and clinical interventions, and social
programs).
List of abbreviations
IDUQOL injection drug user quality of life scale
QoL quality of life
IDUs injection drug users
VIDUS Vancouver Injection Drug User Study
HIV Human immunodeficiency virus
SWLS Satisfaction with Life Scale
RSES Rosenberg's Self-Esteem Scale
MC SDS Marlowe-Crowne Social Desirability Scale
MC X2 Marlowe-Crowne Social Desirability Scale Short
Form X2
Authors' contributions
AH obtained funding, designed the study, directed the sta-
tistical analyses, prepared the initial draft of the manu-
script and conducted revisions. LR assisted in preparing
the data, performed statistical analyses and assisted with
revisions. AP conceived of the study, obtained funding,
coordinated data collection, and conducted revisions of
the manuscript. All authors read and approved the final
manuscript.
Acknowledgements
This research was supported by an operating grant from the Canadian Insti-
tutes of Health Research (CIHR) to Dr. Anita Palepu and Dr. Anita Hubley.
Additional support was provided through a Canadian Institutes for Health
Research New Investigator Award and a Michael Smith Foundation for
Health Research Senior Scholar Award to Dr. Anita Palepu. The authors
would like to thank Kathy Li, Nancy Laliberte, Dave Isham, and Robin
Brooks and the participants at the Vancouver Injection Drug User Study for
their assistance in collecting and preparing the data for this research.
References
1. Darke S, Hall W, Wodak A, Heather N, Ward J: Development and
validation of a multidimensional instrument for assessing
outcome of treatment among opiate users: Opiate Treat-
ment Index. British Journal of Addiction 1992, 87:733-742.
2. Torrens M, San L, Martinez A, Castillo C, Domingo-Salvany A, Alonso
J: Use of the Nottingham Health Profile for measuring health
status of patients in methadone maintenance treatment.
Addiction 1997, 92:707-716.
3. Puigdollers E, Domingo-Salvany A, Brugal MT, Torrens M, Alvaros J,
Castillo C, Magri N, Martin S, Vazquez JM: Characteristics of her-
oin addicts entering methadone maintenance treatment:
Quality of life and gender. Substance Use & Misuse 2004,
39:1353-1368.
4. Ryan CF, White JM: Health status at entry to methadone main-
tenance treatment using the SF-36 health survey
questionnaire. Addiction 1996, 91:39-45.
5. Stein MD, Mulvey KP, Plough A, Samet JH: The functioning and
well being of persons who seek treatment for drug and alco-
hol use. Journal of Substance Abuse 1998, 10:75-84.
6. Carretero MD, Burgess AP, Soler P, Soler M, Catalan J: Reliability
and validity of an HIV-specific health-related quality-of-life
measure for use with injecting drug users. AIDS 1996,
10:1699-1705.
7. Dalgard O, Egeland A, Skaug K, Vilimas K, Steen T: Health-related
quality of life in active injecting drug users with and without
chronic hepatitis C virus infection. Hepatology 2004, 39:74-80.
8. Falck RS, Wang J, Carlson RG, Siegal HA: Crack-cocaine use and
mental health status as defined by the SF-36. Addictive
Behaviors 2000, 25:579-584.
9. Smith KW, Avis NE, Assmann SF: Distinguishing between quality
of life and health status in quality of life research: A meta-
analysis. Quality of Life Research 1999, 8:447-459.
10. Metzger DS, O'Brien CP: Substance Abuse: The Challenge of
Assessment. In Quality of Life Assessments in Clinical Trials Edited by:
Spilker B. New York, Raven Press, Ltd.; 1990:237-246.
11. Koch T: Life quality vs the 'quality of life': Assumptions and
underlying prospective quality of life instruments in health
care planning. Social Science and Medicine 2000, 51:419-427.
12. Globe DR, Hays RD, Cunningham WE: Associations of clinical
parameters with health-related quality of life in hospitalized
persons with HIV disease. AIDS Care 1999, 17:71-86.
13. Brogly S, Mercier C, Bruneau J, Palepu A, Franco E: Towards more
effective public health programming for injection drug users:
Development and evaluation of the Injection Drug User
Quality of Life Scale. Substance Use & Misuse 2003, 38:965-992.
14. APA, AERA, NCME: Standards for educational and psychologi-
cal testing. Washington, DC, American Psychological Association,
American Educational Research Association, National Council on
Measurement in Education; 1985.
15. Hubley AM, Zumbo BD: A dialectic on validity: Where we have
been and where we are going. J Gen Psychol 1996, 123:207-215.
16. Messick S: Validity of test interpretation and use. Research
Report No. 90-11. Educational Testing Service; 1990.
17. Strathdee SA, Patrick DM, Currie SL, Cornelisse PG, Rekart ML,
Montaner JS, Schechter MT, O'Shaughnessy MV: Needle exchange
is not enough: lessons from the Vancouver injecting drug use
study. AIDS 1997, 11:F59-65.
18. Russell LB, Hubley AM: Importance ratings and weightings: Old
concerns and new perspectives. International Journal of Testing
2005, 5:105-131.
19. Russell LB, Hubley AM, Palepu A, Zumbo BD: Does weighting cap-
ture what's important? Revisiting subjective importance
weighting with a quality of life measure. Social Indicators
Research . in press
20. Diener E, Emmons RA, Larsen RJ, Griffin S: The Satisfaction With
Life Scale. Journal of Personality Assessment 1985, 49:71-74.
21. Rosenberg M: Society and the adolescent self-image. Princeton,
NJ, Princeton University Press; 1965.
22. Strahan R, Gerbasi KC: Short, homonegeous versions of the
Marlow-Crowne Social Desirability Scale. Journal of Clinical
Psychology 1972, 28:191-193.
23. Crowne DP, Marlowe D: A new scale of social desirability inde-
pendent of psychopathology. Journal of Consulting Psychology 1960,
24:349-354.
Publish with BioMed Central and every
scientist can read your work free of charge
"BioMed Central will be the most significant development for
disseminating the results of biomedical research in our lifetime."
Sir Paul Nurse, Cancer Research UK
Your research papers will be:
available free of charge to the entire biomedical community
peer reviewed and published immediately upon acceptance
cited in PubMed and archived on PubMed Central
yours — you keep the copyright
Submit your manuscript here:
/>BioMedcentral
Health and Quality of Life Outcomes 2005, 3:43 />Page 10 of 10
(page number not for citation purposes)
24. Campbell DT: Recommendations for APA test standards
regarding construct, trait and discriminant validity. American
Psychologist 1960, 15:546-553.
25. Foster SL, Cone JD: Validity issues in clinical assessment. Psy-
chological Assessment 1995, 7:248-260.
26. Nandakumar R, Ackerman T: Test modeling. In The SAGE Hand-
book of Quantitative Methodology for the Social Sciences Edited by: Kap-
lan D. Thousand Oaks, CA, SAGE Publications; 2004:93-105.
27. Pedhazur EJ, Schmelkin LP: Measurement and scientific inquiry.
In Measurement, design, and analysis: An integrated approach Hillsdale,
NJ, Lawrence Erlbaum Assoc. Pub.; 1991.
28. Stout W: A nonparametric approach for assessing latent trait
unidimensionality. Psychometrika 1987, 52:589-617.
29. Stout WF: A new item response theory modeling approach
with applications to unidimensionality assessment and abil-
ity estimation. Psychometrika 1990, 55:293-325.
30. Gorsuch RL: Factor analysis. 2nd edition. Hillsdale, NJ, Lawrence
Erlbaum; 1983.
31. Pett MA, Lackey NR, Sullivan JJ: Making sense of factor analysis:
The use of factor analysis for instrument development in
health care research. Thousand Oaks, CA, SAGE Publications;
2003.
32. Hattie J: Methodology review: Assessing unidimensionality of
tests and items. Applied Psychological Measurement 1984, 20:1-14.
33. Hattie J: An empirical study of the various indices for deter-
mining unidimensionality. Multivariate Behavioral Research 1985,
19:49-78.
34. Fabrigar LR, Wegener DT, MacCallum RC, Strahan EJ: Evaluating
the use of exploratory factor analysis in psychological
research. Psychological Methods 1999, 4:272-299.
35. Russell DW: In search of underlying dimensions: The use (and
abuse) of factor analysis in Personality and Social Psychology
Bulletin. Pers Soc Psychol Bull 2002, 28:1629-1646.
36. Clark LA, Watson D: Constructing validity: Basic issues in
objective scale development. Psychological Assessment 1995,
7:309-319.
37. Cohen J: A power primer. Psychological Bulletin 1992, 112:155-159.
38. Netemeyer RG, Bearden WO, Sharma S: Scaling procedures:
issues and applications. Thousand Oaks, CA, SAGE Press; 2003.