báo cáo hóa học:" Misinterpretation with norm-based scoring of health status in adults with type 1 diabetes" ppt
Bạn đang xem bản rút gọn của tài liệu. Xem và tải ngay bản đầy đủ của tài liệu tại đây (301.8 KB, 9 trang )
BioMed Central
Page 1 of 9
(page number not for citation purposes)
Health and Quality of Life Outcomes
Open Access
Research
Misinterpretation with norm-based scoring of health status in adults
with type 1 diabetes
Alison L Supina
1
, David H Feeny
2,3
, Linda J Carroll
4
and
Jeffrey A Johnson*
4,5
Address:
1
Centre for Health and Policy Studies, University of Calgary, Calgary, AB, Canada,
2
Institute of Health Economics, Department of
Economics, University of Alberta, Edmonton, AB, Canada,
3
Kaiser Permanente Northwest Center for Health Research, Health Utilities Inc.,
Dundas, ON, Canada,
4
Department of Public Health Sciences, Faculty of Medicine, University of Alberta, Edmonton, AB, Canada and
5
Institute
of Health Economics, #1200 10405 Jasper Ave NW, Edmonton, Alberta, T5J 3N4 Canada
Email: Alison L Supina - ; David H Feeny - ; Linda J Carroll - ;
Jeffrey A Johnson* -
* Corresponding author
Abstract
Background: Interpretations of profile and preference based measure scores can differ. Profile
measures often use a norm-based scoring algorithm where each scale is scored to have a
standardized mean and standard deviation, relative to the general population scores/norms (i.e.,
norm-based). Preference-based index measures generate an overall scores on the conventional
scale in which 0.00 is assigned to dead and 1.00 is assigned to perfect health. Our objective was to
investigate the interpretation of norm-based scoring of generic health status measures in a
population of adults with type 1 diabetes by comparing norm-based health status scores and
preference-based health-related quality of life (HRQL) scores.
Methods: Data were collected through self-complete questionnaires sent to patients with type 1
diabetes. The RAND-36 and the Health Utilities Index Mark 3 (HUI3) were included.
Results: A total of 216 (61%) questionnaires were returned. The respondent sample was
predominantly female (58.8%); had a mean (SD) age of 37.1 (14.3) years and a mean duration of
diabetes of 20.9 (12.4) years. Mean (SD) health status scores were: RAND-36 PHC 47.9 (9.4),
RAND-36 MHC 47.2 (11.8), and HUI3 0.78 (0.23). Histograms of these scores show substantial left
skew. HUI3 scores were similar to those previously reported for diabetes in the general Canadian
population. Physical and mental health summary scores of the RAND-36 suggest that this
population is as healthy as the general adult population.
Conclusion: In this sample, a preference-based measure indicated poorer health, consistent with
clinical evidence, whereas a norm-based measure indicated health similar to the average for the
general population. Norm-based scoring measure may provide misleading interpretations in
populations when health status is not normally distributed.
Published: 16 March 2006
Health and Quality of Life Outcomes2006, 4:15 doi:10.1186/1477-7525-4-15
Received: 03 January 2006
Accepted: 16 March 2006
This article is available from: />© 2006Supina et al; licensee BioMed Central Ltd.
This is an Open Access article distributed under the terms of the Creative Commons Attribution License ( />),
which permits unrestricted use, distribution, and reproduction in any medium, provided the original work is properly cited.
Health and Quality of Life Outcomes 2006, 4:15 />Page 2 of 9
(page number not for citation purposes)
Background
Interpretation of health-related quality of life (HRQL)
instrument scores and differences between subgroups is
critical in the wide application of such tools [1,2]. Inter-
pretation can, however, be hampered due to various inter-
pretation methods/criteria, differences between measure
development and scoring, and differing perspectives
(individual versus population) [2,3] HRQL scores can be
interpreted statistically or clinically. While statistical inter-
pretation is rather straightforward, clinical interpretation
can be more problematic as a priori criteria for these inter-
pretations may be vague at best, if present at all. Various
operational definitions of scoring and interpretation (e.g.,
norm or distribution-based versus anchor-based) can lead
to difficulties when comparing HRQL scores results
between studies and between groups versus individuals
[3,4]. Exploration of norm-based versus anchor-based
interpretation of HRQL differences can help to illuminate
the strengths and limitations of the measures used.
Generic HRQL measures are intended for general use, irre-
spective of disease state, population or treatment [5].
These measures can also be used in healthy people in the
general population and in patient populations. Appropri-
ate use of generic measures in disease specific populations
depends on whether the instrument covers the relevant
domains, with an appropriate domain continuum, for the
population's disease. Generic measures of HRQL have an
advantage over disease-specific measures in that they per-
mit comparisons of the impact of various diseases on mul-
tiple dimensions of HRQL and allow comparisons across
conditions or populations. Specific measures have the
advantage of focusing on issues of particular concern to
patients with the disease [6]. Also, they may be better able
to identify functional impairments arising for the illness
under study and may be more sensitive to small changes
in health resulting from treatment than generic HRQL
measures [7]. For these reasons, patients and clinicians
often tend to prefer specific measures, as items seem clin-
ically sensible. Disadvantages of disease specific measures
are that they may not permit broad comparisons between
disease states and they may miss the effects of co-morbid-
ities or treatment side effects. For these reasons, disease
specific measures are less informative for resource alloca-
tion decision makers and third party payers. Although
generic HRQL measures may be less sensitive to disease-
specific HRQL burden, they may be expected to distin-
guish between varying degrees of severity within a condi-
tion. Generic measures can be classified into health status
profiles and preference-based measures [5].
Profile measures typically reflect an individual's current
health status on multiple dimensions or domains and
assign a score to each dimension, but do not necessarily
provide an overall score to reflect overall HRQL. Profile
measures are often derived from psychometric or clini-
metric approaches and include key generic health con-
cepts and capture morbidity associated with various
health states. However, the scales are not anchored at
dead, and therefore they do not include mortality.
Multi-attribute ('indirect') preference-based measures also
measure an individual's current health status; however,
they then apply a community-derived utility score to
value that health state. Preference-based measures offer
advantages over profile measures. First, preference meas-
ures include the state of "dead", anchored at a value of 0.0,
thus integrating both morbidity and mortality. In addi-
tion, some preference-based measures allow for negative
utility values that reflect health states worse than dead.
Preference-based measures also allow an overall score to
be obtained, which allows for comparison among dis-
eases and groups as well as an assessment of the overall
net effects of disease and intervention. Interpretation of
profile and preference based measure scores can differ.
The interpretation of preference-based scores, such as the
Health Utilities Index Mark 3 (HUI3) is based on the
anchors of "dead" and "full health" and also involves
comparison of overall scores with existing external popu-
lation norms [8]. Profile measures, such as the SF-36 [9]
or RAND-36 [10], may utilize a norm-based scoring algo-
rithm where scales have a standardized mean and stand-
ard deviation, relative to some reference population (i.e.,
norms). Although an overall score is not generated in a
norm-based scoring system, profile measures and norm-
based scoring allow for possible detection of different
effects on different dimensions of HRQL. Norm-based
scoring is also intended to aid in the interpretation of
health status of a sample by having a "built-in" reference
(i.e., the 'norm' scores for the population) when applied
in any patient population.
Type 1 diabetes is a chronic disease that develops early in
adolescence. It can result in acute and long-term compli-
cations. Long term microvascular and macrovascular
complications account for the majority of the morbidity
and mortality associated with diabetes. For these reasons,
many middle-aged individuals are heavily burdened with
long-term complications and their associated treatments.
There is extensive literature based on generic health sta-
tus/HRQL measurement in diabetes. Previous research
with profile and preference-based measures in type 1 and
type 2 diabetes have found similar trends in determinants
of HRQL burden such as type of treatment and the pres-
ence of diabetic complications [11-16]. Despite previous
research reporting similar trends between profile and pref-
erence-based measures in diabetes, there has been little
research comparing the performance and interpretation of
these measures in type 1 diabetes.
Health and Quality of Life Outcomes 2006, 4:15 />Page 3 of 9
(page number not for citation purposes)
The objective of this study was to compare the interpreta-
tion of norm-based scoring of generic health status and
preference-based HRQL measures in an adult type 1 dia-
betes population.
Methods
Study design and sample
This study used a cross-sectional design, with all data col-
lected through self-complete questionnaires mailed to
adult type 1 diabetes patients. A second questionnaire was
sent to non-responders. Included subjects were adults
with clinically diagnosed type 1 diabetes. Subjects had to
be eighteen years old at the time of survey completion, be
English-speaking, and have a fixed address. All subjects
were type 1 diabetes patients being seen at diabetes clinics
in Edmonton and Calgary, AB, Canada. Participating
endocrinologists and clinic staff provided names and
addresses of potential subjects. These patient names and
addresses were not pre-screened for any reason by clinic
staff. Ethical approval for this study was obtained through
the University of Alberta Health Research Ethics Board
and the University of Calgary Research Ethics Board.
Measures
Clinical and demographic questionnaire
Subjects completed a sociodemographic and clinical self-
report questionnaire. The sociodemographic component
of the questionnaire contained questions about their age,
sex, marital and occupational status, highest level of edu-
cation, and main activity in the last twelve months. The
clinical self-report component of the questionnaire con-
tained questions regarding diagnosis, duration, glycemic
control and advancement of diabetes. Also, it contained
questions regarding signs and symptoms of diabetic com-
plications and a self-report of common co-morbidities,
adopted from the National Population Health Survey
(Statistics Canada) [17].
Health Utilities Index Mark 3 (HUI3)
The HUI3 is preference-based multi-attribute utility meas-
ures of HRQL, which assess multiple domains of health
status, and assigns a valuation to each health state, based
on community preferences for health states [8]. Health
states are classified by a set of dimension or attributes of
HRQL, with a number of different levels for each attribute.
HRQL is classified by eight attributes: vision, hearing,
speech, ambulation, dexterity, emotion, cognition, and
pain. In the HUI3 system, each of the eight attributes has
five or six different levels; these levels describe 972,000
unique HUI3 health states [8]. Overall utility scores on
the HUI3 range from -0.36 to 1.0, where -0.36 represents
the worst possible HUI3 health state, 0.0 represents dead,
and 1.0 represents full health [8].
Differences greater than 0.03 on the HUI3 overall scores
are considered to be clinically important [18,19]. In a
population health survey, overall HUI3 scores were found
to have a test-retest reliability using an intra-class correla-
tion coefficient (ICC) of 0.77 in one-month follow-up
[20]. Other studies of disease specific patient populations
such as multiple sclerosis, hip fracture and rheumatoid
arthritis have reported HUI3 scores to have test-retest reli-
ability using ICCs ranging from 0.72 to 0.87 [20-24].
The HUI3 may be useful in studying HRQL in diabetes
because of several attributes that would likely be affected
by the severity of diabetes and diabetic complications
[19,25]. Specifically, diabetic complications such as
amputation and peripheral neuropathy may affect the
ambulation and dexterity attributes of the HUI3. In addi-
tion, neuropathy and myopathy may affect the pain and
discomfort and dexterity attributes of the HUI3. Retinop-
athy may affect the vision attribute and nephropathy may
affect the ambulation and pain attributes of the HUI3.
While the measurement properties of the HUI3 have been
explored in type 2 diabetes [19,25], no experience existed
with regard to type 1 diabetes.
In addition to containing attributes relevant to diabetes,
the HUI3 has relevance as a reference standard for the gen-
eral Canadian population, as the HUI3 has been included
in all recent national health surveys. Recent experience
with the HUI3 in the general population (from 1996–
1997 National Population Health Survey (Cycle 2) [26]
provided an overall adjusted HUI3 score of 0.88 (95%CI:
0.87–0.89) for respondents with type 2 diabetes alone
(adjusted for age, sex, education and number of medical
conditions) [27]. This was statistically significantly lower
than the score of 0.92 (95%CI: 0.92–0.92) (p < 0.001) for
subjects without diabetes; the difference is also clinically
important [25].
RAND-36 health status inventory
The RAND-36 is a commonly used health profile instru-
ment [8]. It was designed to evaluate 8 areas of behavior
or experience including physical functioning, role limita-
tions due to physical problems, bodily pain, general
health perceptions, vitality, social functioning, and role
limitations due to emotional problems, mental health
and health transition [8]. In addition, two summary
scores representing physical (Physical Health Composite
– PHC) and mental (Mental Health Composite- MHC)
health are generated [8]. Although the RAND-36 employs
the same items as the SF-36, the methodology used to
derive the composite scores for the RAND-36 differs from
the SF-36. Specifically, the RAND-36 uses an oblique rota-
tion, rather than the orthogonal rotation employed in the
SF-36. The orthogonal rotation used for SF-36 is designed
to result in independent uncorrelated composite scores
Health and Quality of Life Outcomes 2006, 4:15 />Page 4 of 9
(page number not for citation purposes)
[10]. The oblique rotation used for the RAND-36 allows
the two summary scores to be correlated [10]. Also, the
domain scores used for composite score construction of
the RAND-36 are only those associated with either physi-
cal or mental health. In contrast, the SF-36 uses all
domain scores in the construction of both the physical
and mental composite scores. In the SF-36, mental
domains have a negative effect and physical domains have
a positive effect on the physical composite scores and vice
versa for the mental composite score.
For these reasons, it is felt that the RAND-36 provides a
more rational and clinically sound scoring system for
HRQL. Recent evidence suggests that the different scoring
approaches will affect the validity of the summary scores,
as represented by the RAND-12 and SF-12 [29,30].
The RAND-36 (or the related SF-36) has been frequently
applied in the assessment of health status in diabetes
[20,22-24]. The RAND-36 summary scores are T-score
norm-based scoring approaches; therefore, interpretation
of these T-scores is based on a general US population
mean of 50.0, with a standard deviation of 10.0 [8]. It is
suggested that a minimum difference of three to five
points on any given scale may be considered clinically
important [31].
It is important to note that there is substantial overlap in
the domains of health status covered by HUI3 and the
RAND-36. For instance, both measures include physical
functioning, bodily pain, and mental health. Of course
there are also domains covered by one measure but not
the other such as vitality (RAND-36) and vision, hearing,
and speech (HUI3).
Data analysis
HRQL measures were scored according to the developers'
guidelines. Descriptive statistics were calculated to present
the minimum, maximum, median and mean (SD) for the
HUI3 and RAND 36 scores in this sample. The respondent
sample was described by self-reported demographic and
clinical characteristics. We compared descriptives and dis-
tributions for the HUI3 and RAND-36. Overall measure
scores were also compared using Pearson's correlations.
Histograms were generated for comparisons of score dis-
tributions.
Table 1: Sample demographic characteristics.
Characteristic n Total*
Age (yrs) – mean (SD) 215 37.13 (14.28)
Sex 216
Female 127 (58.8)
Marital Status 216
Single 69 (31.9)
Married/In a partnership 131 (60.6)
Separated/Divorced 13 (6.0)
Widowed 3 (1.4)
Highest Level of Completed Education 216
Less than high school 16 (7.4)
High school 42 (19.4)
Some college 43 (19.9)
College degree 41 (19.0)
Some university 27 (12.5)
University degree 40 (8.5)
Other 7 (3.2)
Main Activity in Last 12 months 216
Working 126 (58.3)
Looking for work 11 (5.1)
Keeping house 18 (8.3)
Student 30(13.9)
Disability 16 (7.4)
Retired 15 (6.9)
Total Household Income Last Year 196
≤ $10 000 19 (9.7)
$10 000 – 29 999 44 (22.4)
$30 000 – 49 999 37 (18.9)
$50 000 – 69 999 36 (18.4)
≥ $70 000 60 (30.6)
*n (%) unless otherwise specified
Health and Quality of Life Outcomes 2006, 4:15 />Page 5 of 9
(page number not for citation purposes)
Results
A total of 216 questionnaires were returned, for an overall
response rate of 61.0%. Of the 216 respondents who met
all study inclusion criteria, the majority were female (127,
58.8%) and were married or in a partnership (131,
60.6%) (Table 1). The highest level of completed educa-
tion for most respondents included high school (19.4%),
some college education (19.9%), and a college degree
(19.0%). Working (full or part time employment) was the
main activity in the last twelve months for the majority of
respondents (58.3%). Total household income last year
for the sample ranged from ≤ $10 000 (9.7%) to ≥ $70
000 (30.6%).
Respondents had a mean age of 37.1 (SD 14.3) years,
mean (SD) duration of diabetes of 20.9 (SD 12.4) years
(median of 19.0 years), with a median age of diagnosis of
12.0 years (Table 2) The majority of respondents were at
a normal weight (47.9%) at diagnosis, with 92.9% of
individuals starting insulin therapy within 3 months of
diagnosis and a median of 4 insulin injections per day.
These clinical characteristics affirm that the subjects in this
sample would be considered to have type 1 diabetes.
The self-reported presence of diabetic complications is
shown in Table 2. Based on the a priori study criteria for
the presence of diabetic complications, the prevalence of
diabetic complications in this sample was: retinopathy/
diabetic eye disease (40.7%); neuropathy/peripheral vas-
cular disease (33.8%); cardiovascular disease (25.5%);
nephropathy (8.5%); the majority of the sample (62.0%)
reported one or more diabetic complication(s). Thyroid
Table 2: Sample clinical characteristics.
Characteristic n Total*
Duration of Diabetes (yrs) – mean (SD) 215 20.91 (12.43)
Age at Diagnosis (yrs) – median (SD) 215 12.0
Weight at Diagnosis 211
Underweight 89 (42.2)
Normal weight 101 (47.9)
Overweight 21 (10.0)
Started insulin within 3 months 210 195 (92.9)
Insulin injections per day -median (min,
max)
214 4.0 (1.0–5.0)
Presence of Diabetic Complications
Retinopathy 215 88 (40.7)
Neuropathy/Peripheral vascular disease 213 73 (33.8)
Cardiovascular disease 215 55 (22.5)
Nephropathy 214 40 (18.5)
Frequency of Diabetic Complications
No Diabetic complications reported 216 82 (38.0)
1 Diabetic complication reported 216 56 (25.9)
2 Diabetic complications reported 216 44 (20.4)
≥ 3 Diabetic complications reported 216 34 (15.7)
Number of Co-morbidities Reported
†
216
No Co-morbidities Reported 118 (54.6)
1 Co-morbidity Reported 53 (24.5)
2 Co-morbidities Reported 25 (11.6)
≥ 3 Co-morbidities Reported 20 (9.3)
Most prevalent co-morbidities (median) 166 1.0
Thyroid condition 167 35 (21.2)
Arthritis/rheumatism 167 28 (16.8)
Asthma 166 19 (11.4)
*n (%) unless otherwise specified
†
Medical conditions considered to be complications were not included as a co-morbidity
Table 3: Descriptive statistics for HRQL measure overall scores.
Score N Mean SD Min Max Median IQR
HUI3 Overall 213 0.78 0.23 -0.08 1.00 0.85 0.68–0.95
RAND-36 PHC 210 47.92 9.41 16 61 51.00 39–63
RAND-36 MHC 213 47.20 11.77 15 66 50.00 31–69
Health and Quality of Life Outcomes 2006, 4:15 />Page 6 of 9
(page number not for citation purposes)
condition, arthritis/rheumatism, and asthma were the
most prevalent co-morbidities reported.
Respondent's overall mean (± SD) HUI3 score was 0.78 ±
0.23 (Table 3). RAND PHC and MHC composite scores
were 47.92 (± 9.41) and 47.20 (± 11.77), respectively
(Table 3). Overall HUI3 measure scores were strongly cor-
related with RAND-36 PHC and MHC scores (r = 0.68 and
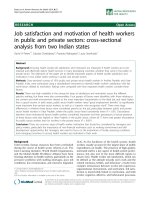
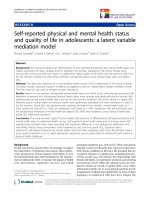
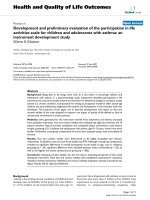
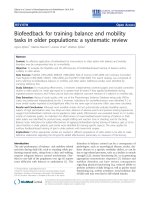
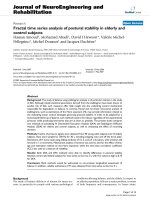
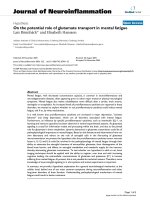
0.71, respectively). Histograms of overall health status
scores show the distribution of scores to be not normally
distributed, with substantial skew to the left for both
measures (Figures 1, 2, 3). The distributions of the RAND-
36 summary scores, particularly the MHC, approach nor-
mality more than the distribution of HUI3 scores; how-
ever, all distributions remained skewed.
In this sample, mean HUI3 and RAND-36 scores reflect a
HRQL burden similar to that previously reported for type
2 diabetes [20,21]. In addition, HUI3 scores in this sam-
ple reflect a large HRQL burden, in comparison to a previ-
ously reported general Canadian population (age and sex
adjusted) norm of 0.90 [26]. Interestingly, the RAND-36,
a norm-based scoring health status measure, did not
reflect a similar HRQL burden in this sample. Norm-
based interpretation of RAND-36 PHC and MHC scores
suggest that this population is as healthy as the average
general Canadian population. Although the RAND-36
summary scores do identify a proportion of individuals
reporting substantial burden, the mean scores are high
enough to be interpreted within the normal range for the
general population.
Discussion
Distribution-based interpretation of RAND-36 scores is
challenging in this study. RAND-36 PHC and MHC scores
of 47.9 and 47.2, respectively, suggest that the sample of
type 1 diabetic subjects is approximately as healthy as the
general US population. We find this interpretation trou-
blesome, as our anchor-based interpretation of HUI
scores show HRQL in adults with type 1 diabetes to be
lower than that of the general Canadian population. It
would seem logical to accept this second interpretation,
Histogram of RAND-36 Mental Health Composite ScoreFigure 3
Histogram of RAND-36 Mental Health Composite Score.
70605040302010
RAND-36 Mental Health Composite
40
30
20
10
0
Frequency
Mean = 47.20
Std. Dev. = 11.77
N = 213
Histogram of Overall HUI3 ScoresFigure 1
Histogram of Overall HUI3 Scores.
1.000.800.600.400.200.00-0.20
Overall HUI3 Utility Score
60
50
40
30
20
10
0
Frequency
Mean = 0.78
Std. Dev. = 0.23
N = 213
Histogram of RAND-36 Physical Health Composite ScoreFigure 2
Histogram of RAND-36 Physical Health Composite Score.
80604020
0
RAND-36 Physical Health Composite
40
30
20
10
0
Frequency
Mean = 47.92
Std. Dev. = 9.41
N = 210
Health and Quality of Life Outcomes 2006, 4:15 />Page 7 of 9
(page number not for citation purposes)
given the prevalence of diabetic complications and co-
morbidities in this sample.
Further analysis of the distribution of HUI and RAND-36
scores demonstrate that, in fact, scores for all measures
were not normally distributed, with substantial skew to
the left; a distributional-based approach assumes scores to
be normally distributed. Here, distributional-based inter-
pretation of RAND-36 scores may lead to misinterpreta-
tion of the HRQL burden associated with type 1 diabetes,
as clinical evidence and other HRQL measures would sug-
gest HRQL is lower than in the general population. When
considered relative to the HUI3 in this study, because of
the strong correlations between overall summary scores, it
appears that the RAND-36 summary scores have distorted
the interpretation of the HRQL burden by imposing a nor-
mal distribution on non-normally distributed data.
Alternative explanations for differences between overall
measure scores need to be considered. The differences in
HRQL burden may be a result of differences in item con-
tent between measures. HUI3 may be more sensitive to
diabetic complications, such as the most prevalent com-
plication of retinopathy. This may increase the HRQL bur-
den as measured by the HUI3 relative to the burden as
measured by the RAND-36. However, with respect to the
HUI3 single-attribute utility score (SAUS) for vision,
95.8% of the sample reported a vision SAUS of ≥ 0.95.
Thus it is unlikely that differences in item content explain
the differences in mean scores between the measures. Dis-
tribution of other SAUS for the HUI3 (i.e., hearing,
speech, ambulation, dexterity) were similar to those of the
vision SAUS. It should be noted that the differences
between PHC and MHC scores for the sample and popu-
lation norms approach a clinically important difference of
3. However, the difference between sample mean and
population norms for HUI3 (diff = 0.14) is nearly 5 times
the clinically important difference for the HUI3 overall
score [8,31].
These results call into question the usefulness of norm-
based scoring in situations where the health of a popula-
tion is unlikely to be normally distributed. This may be
problematic in clinical situations, where prognostic and
therapeutic decisions are guided by interpretation of the
HRQL burden revealed by the HRQL measure, often
based on the mean scores of HRQL measures. Misinter-
pretation of norm-based scores leading to possible under-
estimation of HRQL burden, as seen in this analysis, may
inappropriately inform health research allocation and
policy makers. For this reason, it is important that addi-
tional descriptive statistics (e.g., median, standard devia-
tions, quartiles cut points) should be displayed when
interpreting HRQL scores.
We recognize several limitations in this study. First, all
data and comparisons were cross-sectional. Longitudinal
assessments would provide more valid and reliable infor-
mation regarding the long-term HRQL of this population.
It should be recognized that all clinical data were based on
patient self-report. However, it should be expected that
respondents were motivated to provide valid answers on
information about aspects of their lives, which are of high
personal relevance to them [26]. Previous studies have
shown good agreement between administrative claims,
medical records or physician report and self-report for
chronic conditions, particularly for those conditions with
clear diagnostic criteria, such as diabetes, thus allowing
for useful estimates of population prevalence for these
conditions [32-36] Also, all self-report co-morbidities
were based on a dichotomous response of yes/no there-
fore; we were not able to capture the severity of reported
co-morbidities and complications. Previous research with
generic preference-based measures in diabetes shows the
presence of diabetic complications (particularly microvas-
cular complications), the intensity of diabetes treatment,
and the presence of co-morbidities result in larger HRQL
burdens [9,11-15,37].
Lastly, as with all mail-out self-report questionnaires, the
issue of responder bias is an important consideration. It is
unknown if non-responders were significantly different
from responders; therefore, measurement of responder
bias in this study was not possible. Given the distribution
of sample demographics and clinical characteristics (i.e.,
prevalence of complications and co-morbidities, insulin
use, age and weight at diabetes diagnosis) we feel that this
sample can be considered representative of a mainly
urban-dwelling population of adults with type 1 diabetes,
when compared to Alberta census reports for Edmonton
and Calgary (2001), where the majority of the population
ranges in age from 25–54 years, have a trade or non-uni-
versity certificate/diploma (31.2% and 30.1%, respec-
tively) with a household income of $60,000 and over
(41.9% and 48.8%, respectively) [38]. Also, the preva-
lence of diabetic complications in our sample is similar to
those previously reported for individuals with a duration
of diabetes of twenty-five years or greater where, the prev-
alence of complications are estimated at 10–30% for car-
diovascular and/or peripheral vascular disease, 25–45%
for nephropathy, 50% for neuropathy, and 50–70% for
some degree of retinopathy [39-43].
Conclusion
In this sample, a preference-based measure indicated
poorer health, consistent with clinical evidence, whereas a
norm-based measure indicated health status similar to
that of the general population, despite evidence to the
contrary. Norm-based scoring may lead to misinterpreta-
tion of HRQL norm-based scores.
Health and Quality of Life Outcomes 2006, 4:15 />Page 8 of 9
(page number not for citation purposes)
Competing interests
It should be noted that David Feeny has a proprietary
interest in Health Utilities Incorporated, Dundas,
Ontario, Canada. HUInc. distributes copyrighted Health
Utilities Index (HUI) materials and provides methodolog-
ical advice on the use of HUI.
Authors' contributions
AS was involved in all aspects of this study particularly
study design, data collection, data analysis, data interpre-
tation, presentation and manuscript preparation. JJ, DF,
and LC provided guidance and support in all areas of this
project, particularly in study design, data interpretation
and manuscript preparation. This study was conducted as
a thesis project for AS, under the supervision of JJ. All
authors read and approved the final manuscript.
Acknowledgements
The authors would like to acknowledge the participation and support of
Drs. Ellen Toth and Edward Ryan of the University of Alberta, and Dr. Alun
Edwards of the University of Calgary, and their respective clinic staff. We
would also grateful to all research participants of this project.
This research was supported by funds from a Clinical Center Grant from
the Juvenile Diabetes Research Foundation International and by a New
Emerging Team (NET) grant to the Alliance for Canadian Health Outcomes
Research in Diabetes (ACHORD). The ACHORD NET grant is sponsored
by the Canadian Diabetes Association, the Heart and Stroke Foundation of
Canada, The Kidney Foundation of Canada, the CIHR – Institute of Nutri-
tion, Metabolism and Diabetes and the CIHR – Institute of Circulatory and
Respiratory Health. Ms. Supina holds a Fulltime PhD Health Research Stu-
dentship with the Alberta Heritage Foundation for Medical Research
(AHFMR). Dr. Johnson is a Health Scholar with the AHFMR and is a Canada
Research Chair in Diabetes Health Outcomes. Dr. Carroll is a Health
Scholar with the AHFMR.
References
1. Lydick E, Epstein RS: Interpretation of quality of life changes.
Qual Life Res 1993, 2:221-226.
2. Guyatt GH, Osobora D, Wu A, Wyrwich KW, Norman GR, the Clin-
ical Significance Consensus Meeting Group: Methods to explain
the clinical significance of health status measures. Mayo Clin
Proc 2002, 77:371-383.
3. Cella D, Bullinger M, Scott C, Barofsky I, the Clinical Significance Con-
sensus Meeting Group: Group vs. individual approaches to
understanding the clinical significance of differences or
changes in quality of life. Mayo Clin Proc 2002, 77:384-392.
4. Crosby CD, Kolotkin RL, Williams GR: Defining clinically mean-
ingful change in health-related quality of life. J Clin Epidemiol
2003, 56:395-407.
5. Guyatt GH, Feeny DH, Patrick DL: Measuring health-related
quality of life. Ann Intern Med 1993, 118:622-629.
6. Luscombe FA: Health-related quality of life measurement in
type 2 diabetes. Value Health 2000, 3:S15-S28.
7. MacKeigan LD, Pathak DS: Overview of health-related quality of
life measures. Am J Hosp Pharm 1992, 49:226-245.
8. Feeny DH, Furlong WJ, Torrance GW, Goldsmith CH, Ma ZZ, DeP-
auw S, Denton M, Boyle M: Health Utilities Index. Multiattrib-
ute and single-attribute utility functions for the Health
Utilities Index Mark 3 system. Med Care 2002, 40:113-128.
9. Ware JE, Kosinski M, James D: How to score version 2 of the SF-36®
Health Survey (Standard & Acute Forms) Lincoln, RI: Quality Metric
Incorporated; 2000.
10. Hays RD: RAND-36 Health Status Inventory San Antonio: The Psycho-
logical Corporation; 1998.
11. Tabaei BP, Shill-Novak J, Brandle R, Kaplan RM, Herman WH: Glyc-
emia and the quality of well-being in patients with diabetes.
Qual Life Res 2004, 13:1153-1161.
12. Coffey JT, Brandle M, Zhou H, Marriott D, Burke R: Valuing health-
related quality of life in diabetes. Diabetes Care 2002,
25:2238-2243.
13. Redekop WK, Koopmanschap MA, Stolk RP, Rutten GE, Wolffenbut-
tel BH, Niessen LW: Health-related quality of life and treat-
ment satisfaction in Dutch patients with type 2 diabetes.
Diabetes Care 2002, 25:458-463.
14. Koopmanschap M: Coping with type II diabetes: the patient's
perspective. Diabetologia 2002, 45:S18-22.
15. Hahl J, Hämäläinen H, Sintonen H, Simell T, Arinen S, Simell O:
Health-related quality of life in type 1 diabetes without or
with symptoms of long-term complications. Qual Life Res 2002,
11:427-436.
16. UK Prospective Diabetes Study Group: Quality of life in type 2
diabetic patients is affected by complications but not by
intensive policies to improve blood glucose or blood pres-
sure control (UKPDS 37). Diabetes Care 1999, 22:1125-1136.
17. Statistics Canada: National Population Health Survey, Cycle 2 Documen-
tation .
18. Drummond , Michael : Introducing Economic and Quality of
Life Measurements into Clinical Studies. Ann Med 2001,
33:344-349.
19. Horsman J, Furlong W, Feeny D, Torrance G: The Health Utilities
Index (HUI
®
): concepts, measurement properties and appli-
cations. Health Qual Life Outcomes 2003, 1:54.
20. Boyle MH, Furlong W, Feeny D, Torrance G, Hatcher J: Reliability
of the Health Utilities Index – Mark III used in the 1991 Cycle
6 General Social Survey Health Questionnaire. Qual Life Res
1995, 4:249-257.
21. Fisk JD, Brown MG, Sketris IS, Metz LM, Murray TJ, Stadnyk KJ: A
comparison of health utility measures for the evaluation of
multiple sclerosis treatments. J Neurol Neurosurg Psychiatry 2005,
76:58-63.
22. Jones CA, Feeny D, Eng K: Test-retest reliability of Health Util-
ities Index scores: evidence from hip fracture. Int J Technol
Assess Health Care 2005, 21:393-398.
23. Marra CA, Rashidi AA, Guh D, Kopec JA, Abrahamowicz M, Esdaile
JM, Brazier JE, Fortin PR, Anis AH: Are indirect utility measures
reliable and responsive in rheumatoid arthritis patients. Qual
Life Res 2005, 14:1333-1344.
24. Thoma A, Sprague S, Veltri K, Duku E, Furlong W: Methodology
and measurement properties of health-related quality of life
instruments: a prospective study of patients undergoing
breast reduction surgery. Health Qual Life Outcomes 2005, 3:44.
25. Maddigan SL, Feeny DH, Johnson JA, For the DOVE Investigators: A
comparison of the Health Utilities Index Mark 2 and Mark 3
in type 2 diabetes. Med Decis Making 2003, 23:489-501.
26. Maddigan SL, Feeny DH, Johnson JA: Construct validity of the
RAND-12 and Health Utilities Index Mark 2 and Mark 3 in
type 2 diabetes. Qual Life Res 2004, 13:435-448.
27. Johnson JA, Nowatzki TE, Coons SJ: Health-related quality of life
of diabetic Pima Indians. Med Care 1996, 34:97-102.
28. The Diabetes Control and Complications Trial Research Group, Sha-
moon H, Duffy H, Fleischer N: The effect of intensive treatment
of diabetes on the development and progression of long-
term complications in insulin-dependent diabetes mellitus.
N Engl J Med 1993, 329:977-984.
29. Birbeck GI, Kim S, Hays RD, Vickery BG: Quality of life measures
in epilepsy: How well can they detect change over time? Neu-
rology 2000, 54:1822-1827.
30. Johnson JA, Maddigan SL: Performance of the RAND-12 and SF-
12 summary scores in type 2 diabetes. Qual Life Res 2004,
13:449-456.
31. Hays RD, Morales LS: The RAND-36 measure of health-related
quality of life. Ann Med 2001, 33:350-357.
32. Jacobson AM, de Groot M, Samson JA: The evaluation of two
measures of quality of life in type 1 and type 2 diabetes. Dia-
betes Care 1994, 17:267-274.
33. Wyrwich KW, Tierney WM, Babu AN, Kroenk K, Wolinsky FD: A
comparison of clinically important differences in health-
related quality of life for patients with chronic lung disease,
asthma, or heart disease. Health Serv Res 2005, 40:577-591.
Publish with BioMed Central and every
scientist can read your work free of charge
"BioMed Central will be the most significant development for
disseminating the results of biomedical researc h in our lifetime."
Sir Paul Nurse, Cancer Research UK
Your research papers will be:
available free of charge to the entire biomedical community
peer reviewed and published immediately upon acceptance
cited in PubMed and archived on PubMed Central
yours — you keep the copyright
Submit your manuscript here:
/>BioMedcentral
Health and Quality of Life Outcomes 2006, 4:15 />Page 9 of 9
(page number not for citation purposes)
34. Haapanen N, Miilunpalo S, Pasanen M, Oja P, Vuori I: Agreement
between questionnaire data and medical records of chronic
diseases in middle-aged and elderly Finnish men and women.
Am J Epidemiol 1997, 145:762-769.
35. Kehoe R, Wu SY, Leske MC, Chylack LT: Comparing self-
reported and physician-reported medical history. Am J Epide-
miol 1994, 139:813-818.
36. Martin LM, Leff M, Calonge N, Garrett C, Nelson DE: Validation of
self-reported chronic conditions and health services in a
managed care population. Am J Prev Med 2000, 18:215-218.
37. Maddigan SL, Feeny DH, Johnson JA: Health-related quality of life
deficits associated with diabetes and co morbidities in a
Canadian national population health survey. Qual Life Res
2005, 14:1311-1320.
38. Alberta First Census Division Profiles [er
tafirst.com/profiles/cd/]
39. Hux Janet, Mei Tang : Patterns of Prevalence and Incidence of
Diabetes. In Diabetes in Ontario: An ICES Practice Atlas Edited by: Hux
JE, Booth GL, Slaughter PM, Laupacis A. Institute for Clinical Evalua-
tive Sciences; 2003:1.2-1.3.
40. Oliver Matthew J, Charmaine Lok E, Jane Shi , Deanna Rothwell M:
Dialysis Therapy for Persons with Diabetes. In Diabetes in
Ontario: An ICES Practice Atlas Edited by: Hux JE, Booth GL, Slaughter
PM, Laupacis A. Institute for Clinical Evaluative Sciences;
2003:8.166-8.167.
41. Bailes BK: Diabetes mellitus and its chronic complications.
AORN 2002, 76(2):266-80.
42. Orchard TJ, Dorman JS, Maser RE, et al.: Prevalence of complica-
tions in IDDM by sex and duration: Pittsburgh Epidemiology
of Diabetes Complications Study II. Diabetes 1990, 39:1116-24.
43. Bakaris G: Risk factors for diabetic nephropathy. In UpToDate
Edited by: Rose BD. UpToDate, Wellesley, WA; 2001.